

Circular RNA CirCHIPK3 promotes cell proliferation and invasion of breast cancer by sponging miR-193a/HMGB1/PI3K/AKT axis
- PMID: 32767499
- PMCID: PMC7471055
- DOI: 10.1111/1759-7714.13603
Circular RNA CirCHIPK3 promotes cell proliferation and invasion of breast cancer by sponging miR-193a/HMGB1/PI3K/AKT axis
Abstract
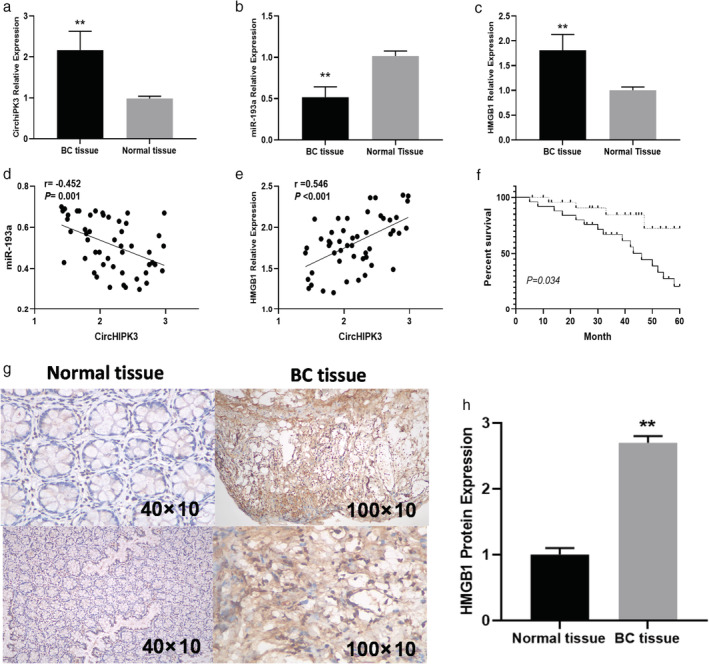
Background: The aim of this study was to explore the potential mechanism of circular RNA (circRNA) CirCHIPK3 on the malignant proliferation and metastasis of breast cancer (BC).
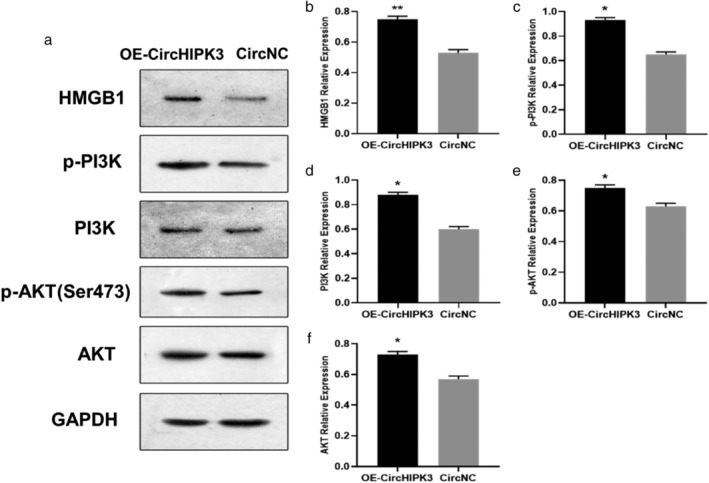
Methods: Human BC samples and their matched normal adjacent tissues were obtained from 50 patients to assess the expression of CirCHIPK3 and its relationship with BC prognosis. A series of in vitro and in vivo functional experiments were carried out to elucidate the role of CirCHIPK3 in BC progression and its underlying molecular mechanisms. Moreover, the interaction of CirCHIPK3, miR-193a, and HMGB1 was examined using bioinformatics, FISH, RIP, RNA-pull down and luciferase reporter assays. Western blot analysis was performed to examine the expression of HMGB1, p-PI3K, total PI3K, p-AKT, and AKT after si-CirCHIPK3 transfection.
Results: Upregulation of CirCHIPK3 was identified in BC, which predicted a worse prognosis in BC patients. Furthermore, it was found that CirCHIPK3 facilitated cell proliferation, migration, and invasion in BC by regulating miR-193a/HMGB1/PI3K/AKT signaling. CirCHIPK3 acted as a sponge for miR-193a to facilitate HMGB1 expression. si-CirCHIPK3 also inhibited tumor growth of BC in nude mice. si-CircCHIPK3 decreased HMGB1/PI3K/AKT signal expression in MDA-MB-231 cells, whereas overexpression of CircCHIPK3 enhanced HMGB1/PI3K/AKT signal.
Conclusions: CirCHIPK3 regulated miR-193a/HMGB1/PI3K/AKT signaling to facilitate BC development and progression, providing a novel therapeutic target for BC.
Keywords: Breast cancer; CirCHIPK3; endogenous competitive RNA; high-mobility group box-1; miR-193a.
© 2020 The Authors. Thoracic Cancer published by China Lung Oncology Group and John Wiley & Sons Australia, Ltd.
Figures
 ) si‐CircHIPK3, (
 ) si‐CircNC, (
 ) OE‐CircNC, (
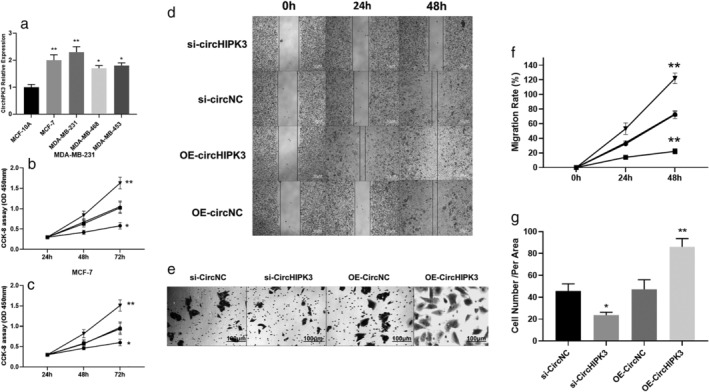
 ) OE‐CircHIPK3. (c) MCF‐7 cell proliferation was detected by MTT assay following si‐CirCHIPK3 and OE‐CirCHIPK3 (*P < 0.05,**P < 0.01) (
 ) si‐CircHIPK3, (
 ) si‐CircNC, (
 ) OE‐CircNC, (
 ) OE‐CircHIPK3. (d and f) Wound healing assay for migration rate after 0, 24 and 48 hours using MDA‐MB‐231 cells following si‐CirCHIPK3 and OE‐CirCHIPK3 (*P < 0.05,**P < 0.01) (
 ) si‐CircHIPK3, (
 ) si‐CircNC, (
 ) OE‐CircNC, (
 ) OE‐CircHIPK3. (e and g) Transwell invasion assay for tumor cell invasion after 0, 24 and 48 hours using MDA‐MB‐231 cells following si‐CirCHIPK3 and OE‐ CirCHIPK3 (*P < 0.05,**P < 0.01).
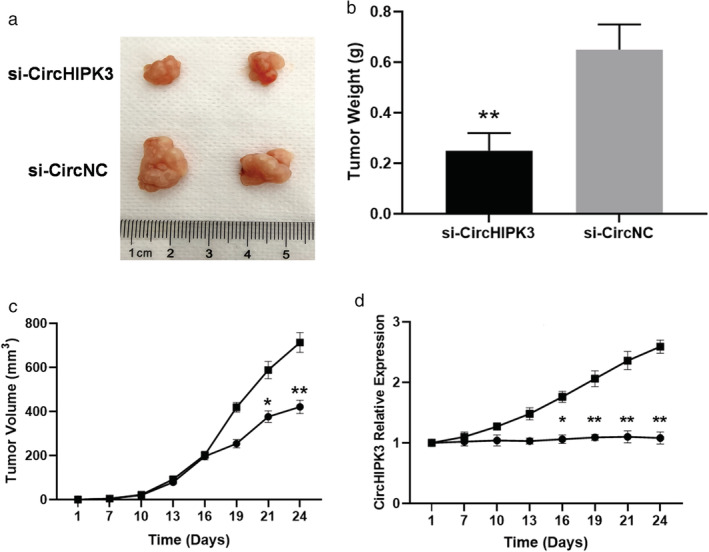
 ) si‐CircHIPK3, (
 ) si‐CircNC. (d) Expressions of CircHIPK3 during the tumor growth between si‐CirCHIPK3 and si‐CircNC groups (
 ) si‐CircHIPK3, (
 ) si‐CircNC.
 ) miR‐NC, (
 ) miR‐193a mimic. (d) Luciferase activity was measured in MDA‐MB‐231 cells cotransfected with mimic NC or miR‐193a mimic and HMGB1‐wt or HMGB11‐mut reporter at 48 hours after transfection (
 ) miR‐NC, (
 ) miR‐193a mimic. HMGB1 was directly targeted by miR‐193a. Relative luciferase activity was quantified and the data were presented as mean ± SD (* P<0.05, ** P<0.01). (e) Representative images of western blot analysis of CircHIPK3 and miR‐193a on HMGB1 expressions. (f) Quantitative analysis of HMGB1 expressions influenced by CircHIPK3 and miR‐193a mimics (* P<0.05).
 ) Anti‐IgG, (
 ) Anti‐AGOC2, (
 ) Input. (b) The biotin‐coupled probe pull‐down assay was performed and the results showed miR‐193a was detected in the CircCHIPK3 pulled‐down pellet compared with the control group. (c) CircCHIPK3 was detected in the biotin‐miR‐193a vector compared with the control group. (d) CIRCHIPK3 and miR‐193a were colocalized MCF‐7 and MDA‐MB‐231 cells by FISH using confocal microscopy. CircCHIPK3 was stained green, miR‐193a was stained red, nuclei were stained blue (DAPI) and overlapped expression was mixed (Scale bar, 20 μm). *P < 0.05,** P < 0.01.
References
-
- Siegel RL, Miller KD, Jema A. Cancer statistics, 2015. CA Cancer J Clin 2015; 65: 5–29. - PubMed
-
- Cardoso F, Castiglione M. Locally recurrent or metastatic breast cancer: ESMO clinical recommendations for diagnosis, treatment and follow‐up. Ann Oncol 2009; 20 (Suppl 4): 15–8. - PubMed
-
- Wang D, Duan L, Tu Z et al The Glasgow prognostic score predicts response to chemotherapy in patients with metastatic breast cancer. Chemotherapy 2016; 61: 217–22. - PubMed
MeSH terms
Substances
LinkOut - more resources
Full Text Sources
Medical
Miscellaneous
