. 2020 Nov;41(16):4718-4729.
doi: 10.1002/hbm.25152. Epub 2020 Aug 7.

The maternal brain: Region-specific patterns of brain aging are traceable decades after childbirth

Affiliations

The maternal brain: Region-specific patterns of brain aging are traceable decades after childbirth

Ann-Marie G de Lange et al. Hum Brain Mapp. 2020 Nov.

Abstract

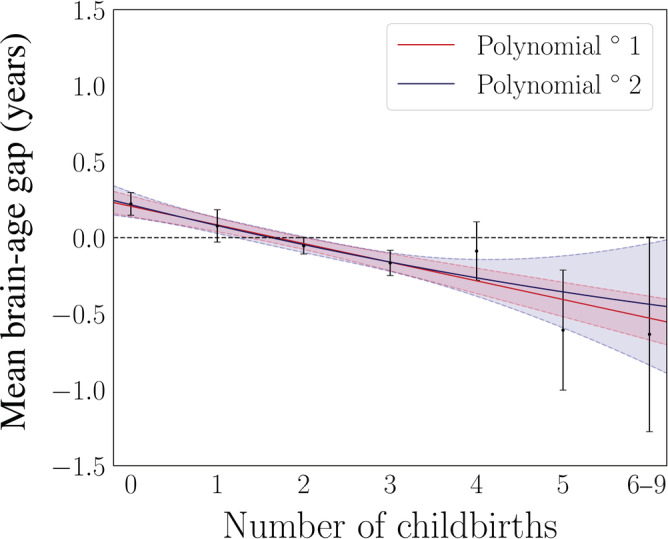
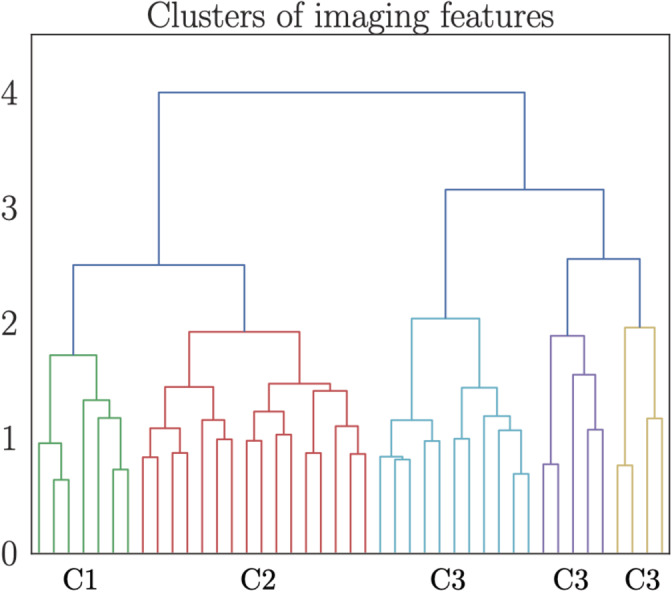
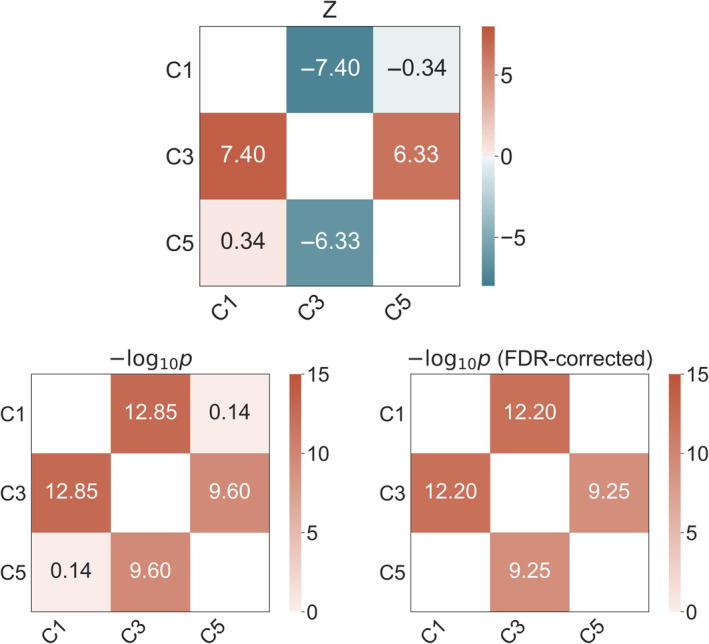
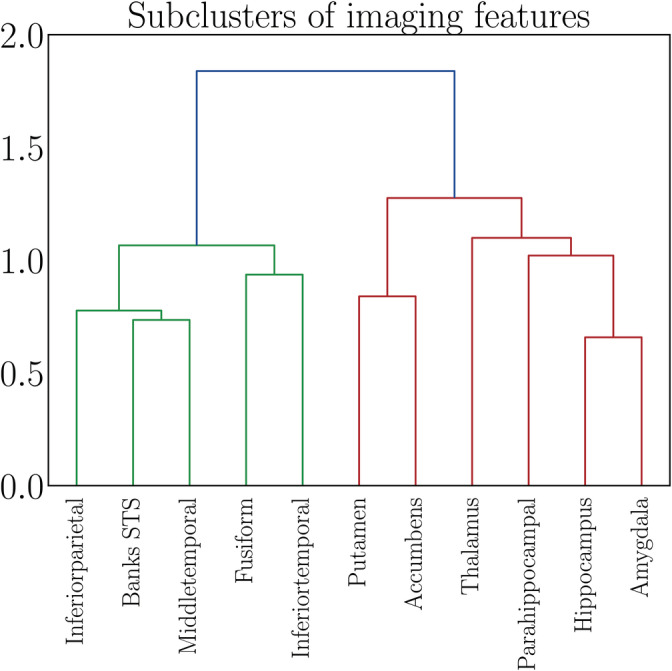
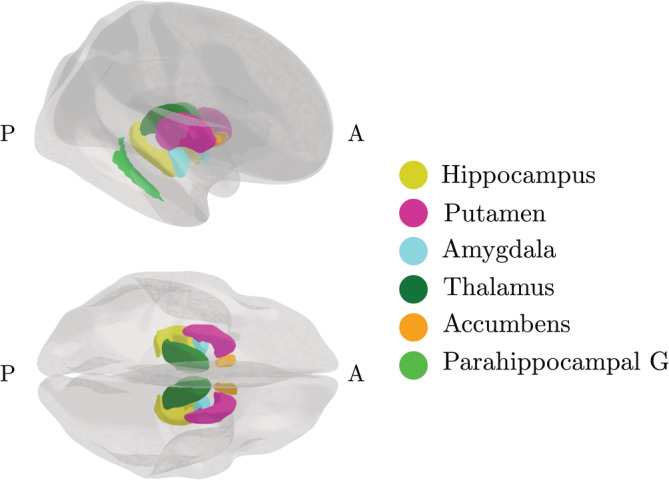
Pregnancy involves maternal brain adaptations, but little is known about how parity influences women's brain aging trajectories later in life. In this study, we replicated previous findings showing less apparent brain aging in women with a history of childbirths, and identified regional brain aging patterns linked to parity in 19,787 middle- and older-aged women. Using novel applications of brain-age prediction methods, we found that a higher number of previous childbirths were linked to less apparent brain aging in striatal and limbic regions. The strongest effect was found in the accumbens-a key region in the mesolimbic reward system, which plays an important role in maternal behavior. While only prospective longitudinal studies would be conclusive, our findings indicate that subcortical brain modulations during pregnancy and postpartum may be traceable decades after childbirth.

Keywords: brain-age prediction; maternal brain aging; neuroimaging; parity.


Figures

FIGURE 1
FIGURE 1
Results from first and second degree polynomial fits for number of childbirths and global brain aging in the newly added participants (N = 8,880). The black points indicate the mean brain age delta ±SE within groups of women based on number of childbirths (x‐axis). The red and blue lines represent the results of the fits, and the shaded areas indicate the 95% confidence intervals for each fit. The horizontal dashed line indicates 0 on the y‐axis. Number of participants in each group: 0 births = 2,065, 1 birth = 1,014, 2 births = 3,912, 3 births = 1,493, 4 births = 311, 5 births = 67, 6 births = 13, 7 births = 3, 8 births = 1, and 9 births = 1. The women with 6–9 children were merged into one gorup to obtain sufficient statistics for least square fits using the SE on the means as weights
FIGURE 2
FIGURE 2
Dendrogram based on hierarchical clustering on the Spearman rank‐order correlations of all features. The colors represent clusters (C) of features that are grouped together based on common covariance. A list of the imaging features contained in each of the clusters is provided in Table 2. The y‐axis shows the degree of colinearity, with higher y‐values indicating less colinearity between clusters
FIGURE 3
FIGURE 3
Statistical differences between cluster‐specific associations with number of childbirths. Top plot: Matrix showing pairwise differences between the significant cluster‐specific associations with number of childbirths, based on Z tests for correlated samples (Equation 1). Bottom left plot: Uncorrected −Log10 p‐values of the differences between the cluster‐specific associations. Bottom right plot: −Log10 p‐values corrected for multiple comparisons using false discovery rate correction (FDR), with only significant values (<.05) displayed. C, cluster
FIGURE 4
FIGURE 4
Dendrogram based on hierarchical clustering on the Spearman rank‐order correlations of the features contained in Cluster 3, which showed the strongest association with number of childbirths (see Figure 3). The colors represent clusters of features that are grouped together based on common covariance; subcluster 1 in green and subcluster 2 in red. The y‐axis shows the degree of colinearity, with higher y‐values indicating less colinearity between clusters. STS, superior temporal sulcus
FIGURE 5
FIGURE 5
Regions in subcluster 2—the cluster that showed the strongest association with number of previous childbirths. A, anterior; G, gyrus; P, posterior. Figure created using the ggseg plotting tool for brain atlases in R (Mowinckel & Vidal‐Piñeiro, 2019)

References

    1. Alfaro‐Almagro, F. , Jenkinson, M. , Bangerter, N. K. , Andersson, J. L. , Griffanti, L. , Douaud, G. , … Smith, S. M. (2018). Image processing and quality control for the first 10,000 brain imaging datasets from UK Biobank. NeuroImage, 166, 400–424. - PMC - PubMed
    1. Barha, C. K. , & Galea, L. A. (2010). Influence of different estrogens on neuroplasticity and cognition in the hippocampus. Biochimica et Biophysica Acta (BBA)‐General Subjects, 1800, 1056–1067. - PubMed
    1. Barha, C. K. , & Galea, L. A. (2011). Motherhood alters the cellular response to estrogens in the hippocampus later in life. Neurobiology of Aging, 32, 2091–2095. - PubMed
    1. Barha, C. K. , & Galea, L. A. (2017). The maternal “baby brain” revisited. Nature Neuroscience, 20, 134–135. - PubMed
    1. Barha, C. K. , Hanna, C. W. , Salvante, K. G. , Wilson, S. L. , Robinson, W. P. , Altman, R. M. , & Nepomnaschy, P. A. (2016). Number of children and telomere length in women: A prospective, longitudinal evaluation. PLoS One, 11, e0146424. - PMC - PubMed

Publication types