

Impact of COVID-19 pandemic on STEMI care: An expanded analysis from the United States
- PMID: 32767652
- PMCID: PMC7436427
- DOI: 10.1002/ccd.29154
Impact of COVID-19 pandemic on STEMI care: An expanded analysis from the United States
Abstract
Objective: To evaluate the impact of COVID-19 pandemic migitation measures on of ST-elevation myocardial infarction (STEMI) care.
Background: We previously reported a 38% decline in cardiac catheterization activations during the early phase of the COVID-19 pandemic mitigation measures. This study extends our early observations using a larger sample of STEMI programs representative of different US regions with the inclusion of more contemporary data.
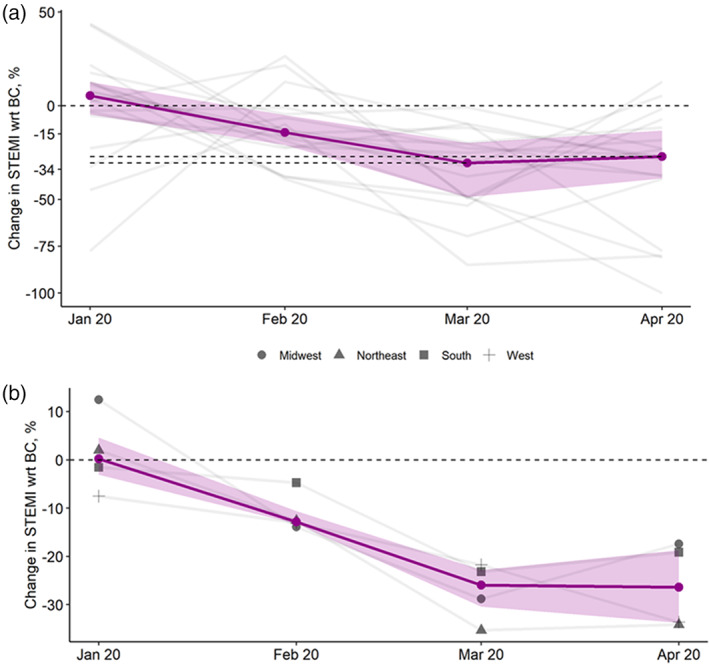
Methods: Data from 18 hospitals or healthcare systems in the US from January 2019 to April 2020 were collecting including number activations for STEMI, the number of activations leading to angiography and primary percutaneous coronary intervention (PPCI), and average door to balloon (D2B) times. Two periods, January 2019-February 2020 and March-April 2020, were defined to represent periods before (BC) and after (AC) initiation of pandemic mitigation measures, respectively. A generalized estimating equations approach was used to estimate the change in response variables at AC from BC.
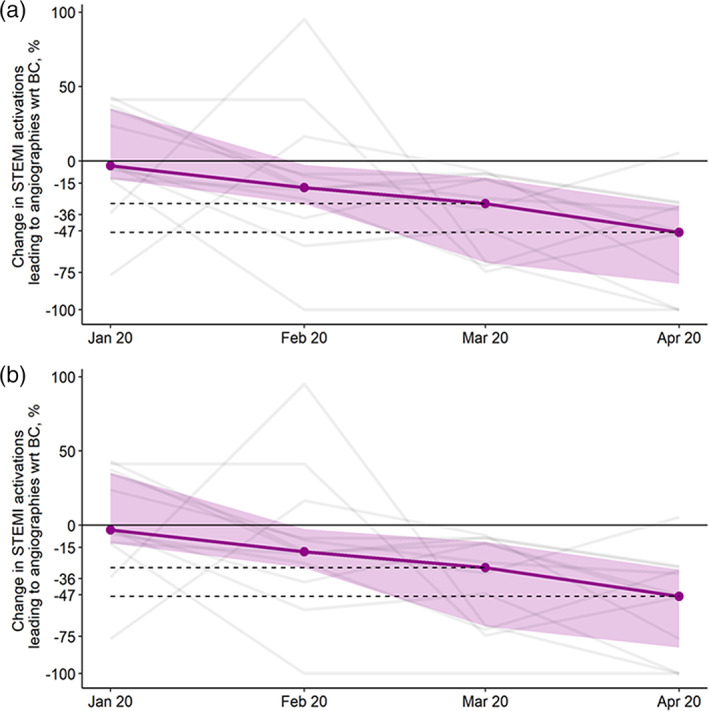
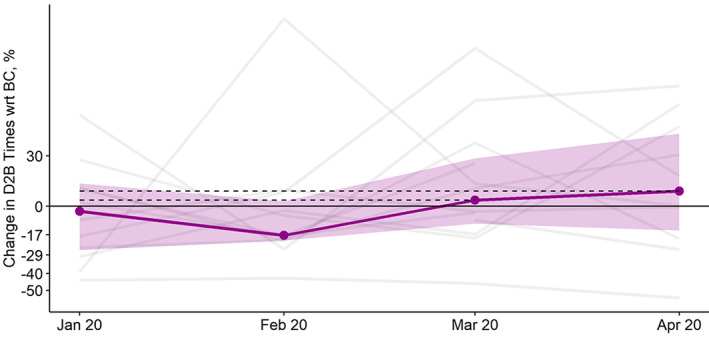
Results: Compared to BC, the AC period was characterized by a marked reduction in the number of activations for STEMI (29%, 95% CI:18-38, p < .001), number of activations leading to angiography (34%, 95% CI: 12-50, p = .005) and number of activations leading to PPCI (20%, 95% CI: 11-27, p < .001). A decline in STEMI activations drove the reductions in angiography and PPCI volumes. Relative to BC, the D2B times in the AC period increased on average by 20%, 95%CI (-0.2 to 44, p = .05).
Conclusions: The COVID-19 Pandemic has adversely affected many aspects of STEMI care, including timely access to the cardiac catheterization laboratory for PPCI.
Keywords: COVID-19; ST-elevation myocardial infarction; STEMI.
© 2020 Wiley Periodicals LLC.
Conflict of interest statement
All authors have no conflict of interest related to this project.
Figures
Comment in
-
Practice patterns for patients with ST-elevation myocardial infarction during the early phase of the COVID-19 pandemic-Valuable lessons learned.Catheter Cardiovasc Interv. 2021 Aug 1;98(2):223-224. doi: 10.1002/ccd.29843. Catheter Cardiovasc Interv. 2021. PMID: 34369060 Free PMC article.
References
-
- http://www.euro.who.int/__data/assets/pdf_file/0007/436354/strengthening.... Accessed May 21, 2020.
-
- https://www.cdc.gov/coronavirus/2019‐ncov/hcp/guidance‐hcf.html?CDC_AA_r.... Accessed May 21, 2020.
Publication types
MeSH terms
LinkOut - more resources
Full Text Sources
Medical
Miscellaneous
