. 2020 Aug 7;10(1):23.
doi: 10.1186/s13395-020-00239-0.

X-linked muscular dystrophy in a Labrador Retriever strain: phenotypic and molecular characterisation

Affiliations

X-linked muscular dystrophy in a Labrador Retriever strain: phenotypic and molecular characterisation

Inès Barthélémy et al. Skelet Muscle. .

Abstract

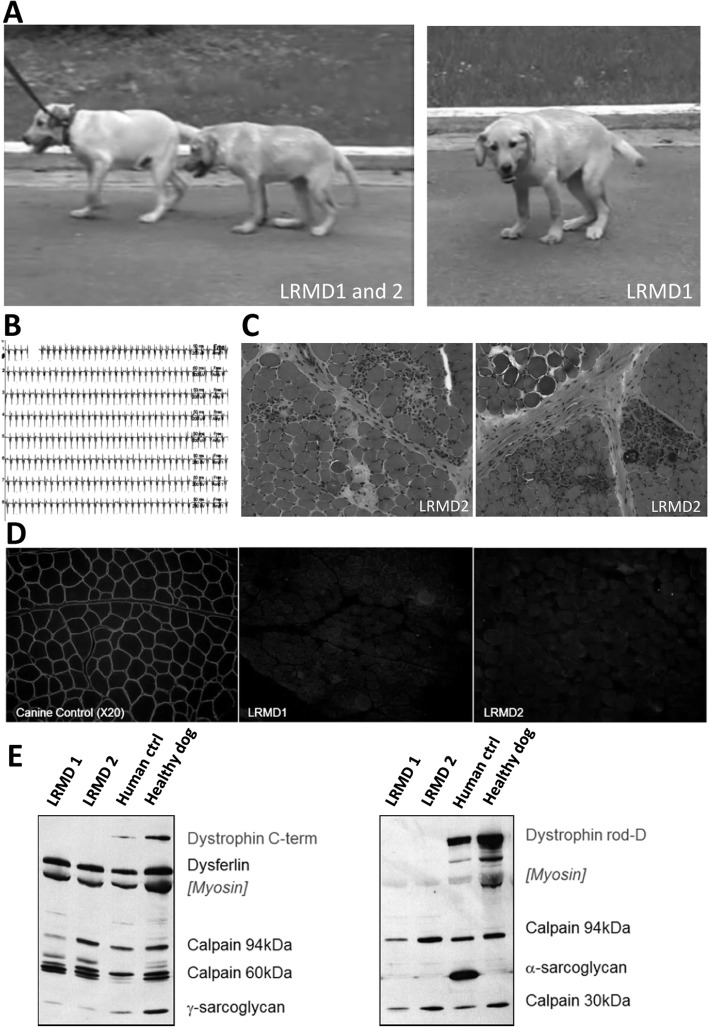
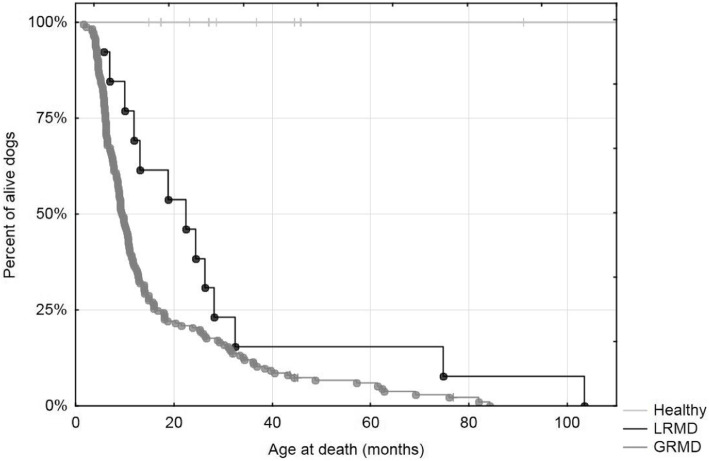
Background: Canine models of Duchenne muscular dystrophy (DMD) are a valuable tool to evaluate potential therapies because they faithfully reproduce the human disease. Several cases of dystrophinopathies have been described in canines, but the Golden Retriever muscular dystrophy (GRMD) model remains the most used in preclinical studies. Here, we report a new spontaneous dystrophinopathy in a Labrador Retriever strain, named Labrador Retriever muscular dystrophy (LRMD).

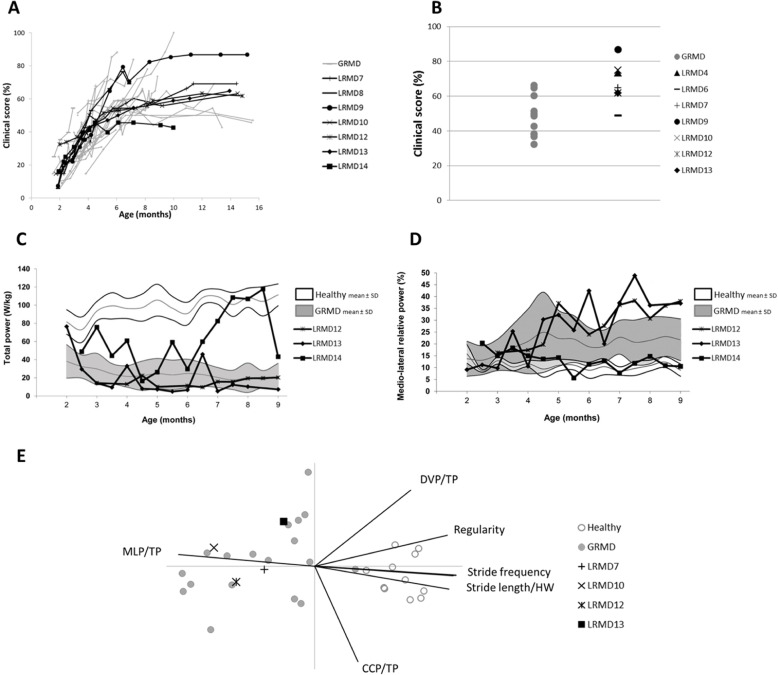
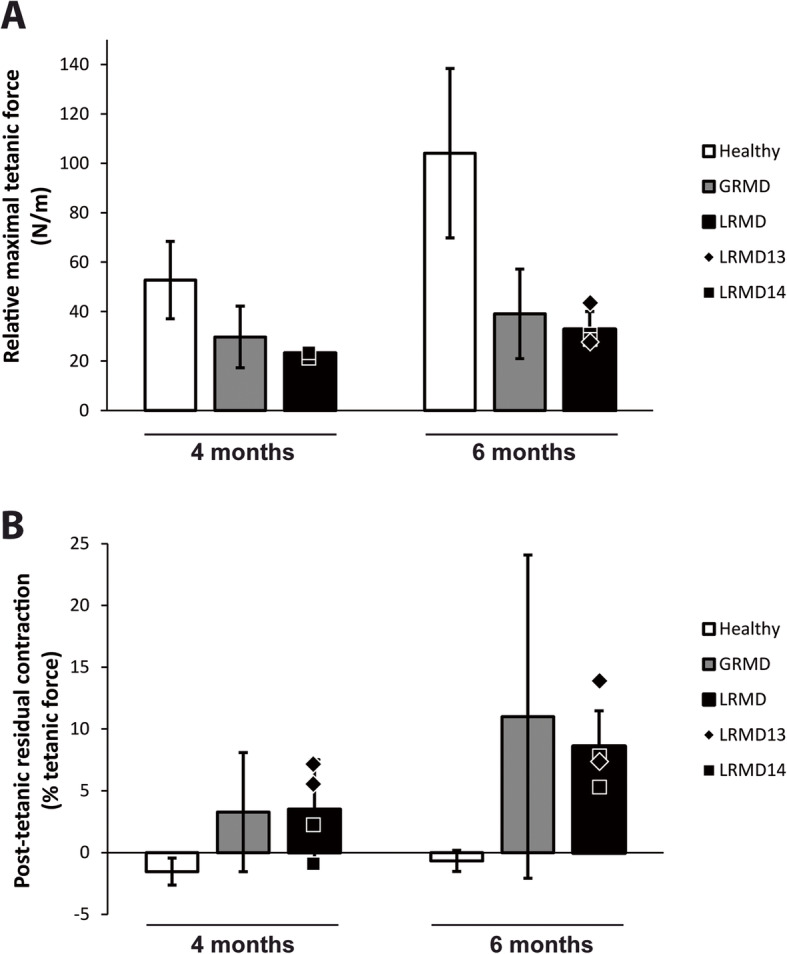
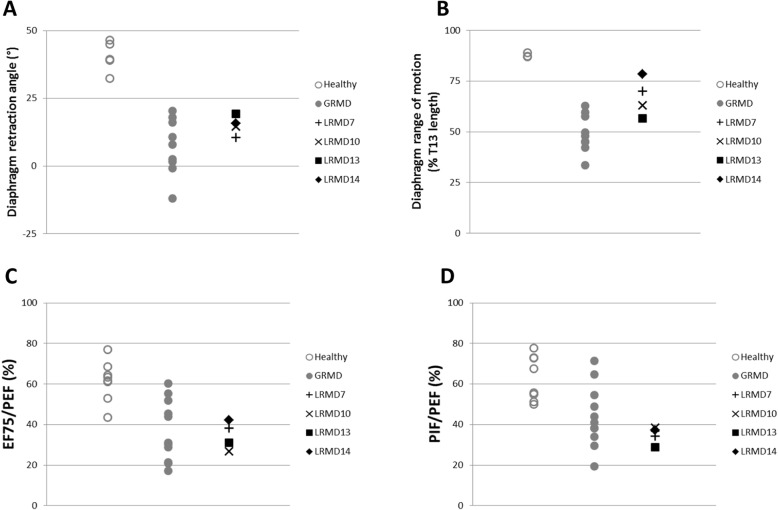
Methods: A colony of LRMD dogs was established from spontaneous cases. Fourteen LRMD dogs were followed-up and compared to the GRMD standard using several functional tests. The disease causing mutation was studied by several molecular techniques and identified using RNA-sequencing.

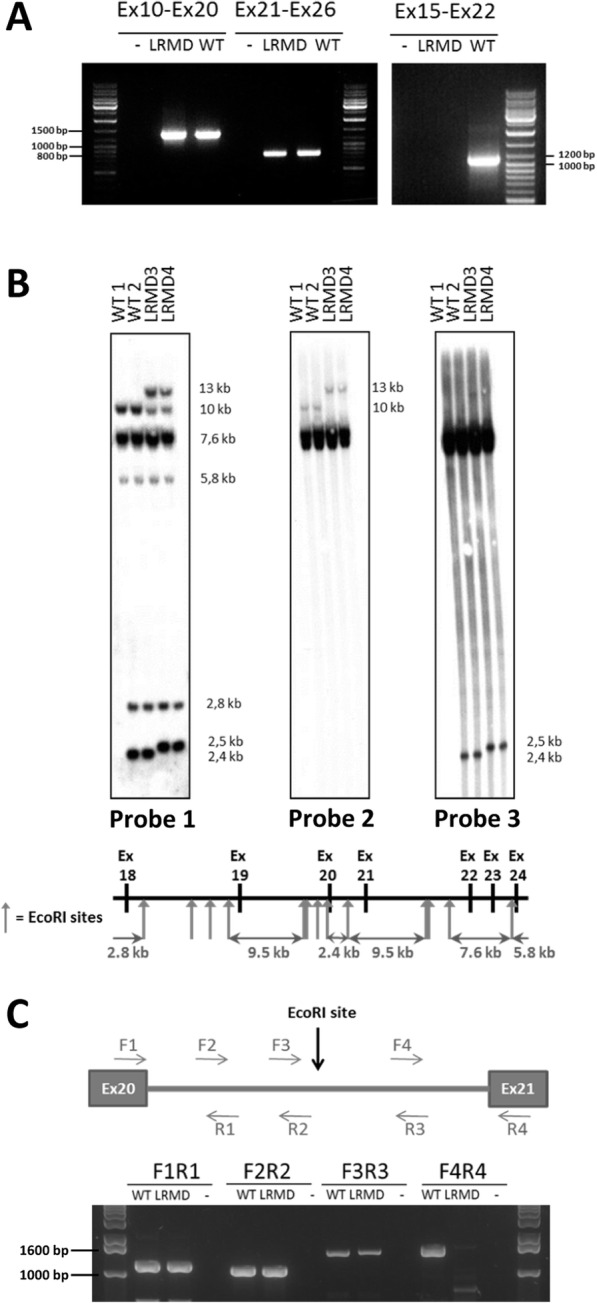
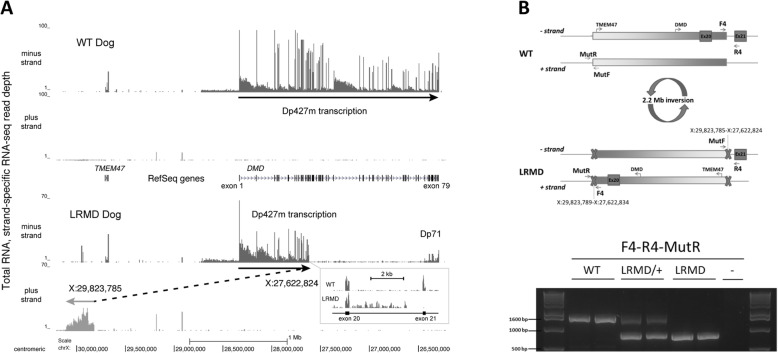
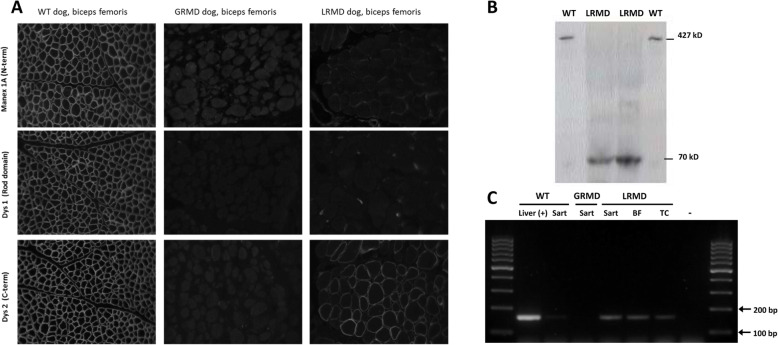
Results: The main clinical features of the GRMD disease were found in LRMD dogs; the functional tests provided data roughly overlapping with those measured in GRMD dogs, with similar inter-individual heterogeneity. The LRMD causal mutation was shown to be a 2.2-Mb inversion disrupting the DMD gene within intron 20 and involving the TMEM47 gene. In skeletal muscle, the Dp71 isoform was ectopically expressed, probably as a consequence of the mutation. We found no evidence of polymorphism in either of the two described modifier genes LTBP4 and Jagged1. No differences were found in Pitpna mRNA expression levels that would explain the inter-individual variability.

Conclusions: This study provides a full comparative description of a new spontaneous canine model of dystrophinopathy, found to be phenotypically equivalent to the GRMD model. We report a novel large DNA mutation within the DMD gene and provide evidence that LRMD is a relevant model to pinpoint additional DMD modifier genes.

Keywords: Animal model; Canine; DMD; Dog; Dp71; Dystrophin; Inversion; LRMD; Neuromuscular disorders.


Conflict of interest statement

The authors declare that they have no competing interests.

Figures

Fig. 1
Fig. 1
Findings it the first cases point out a potential dystrophinopathy. a Pictures of the two first affected brothers (LRMD1 and 2), at 4 months of age, at time of their presentation to the neurology consultation of the Alfort school of veterinary medicine. Note the markedly plantigrade and palmigrade posture and the pelvic verticalisation. b Electromyographic recordings showing complex repetitive discharges observed in both animals, especially in the proximal appendicular muscles. c H&E staining of a biceps femoris biopsy taken from LRMD2 at 4 months of age showing a dystrophic profile: necrosis, regeneration, endomysial fibrosis, hypercontracted fibres, inflammatory foci and calcifications. d Dystrophin (rod-domain) immunostaining in LRMD1 and 2 biceps femoris compared to an unaffected dog. The images clearly show absence of signal delineating the membrane of the muscle fibres in LRMD dogs and presence of this signal in the images corresponding to the control dog. e Multiplex Western-blot confirming the absence of dystrophin immunoreactivity in both affected dogs using two different anti-dystrophin antibodies (Dys2, anti-C-terminal part, and Dys1, anti-rod domain). γ-Sarcoglycan was present in both affected dogs but levels were lower than in the healthy dog, probably because of disruption of the dystrophin-associated protein complex. The levels of other studied proteins were unmodified except for the α-sarcoglycan, for which the human antibody showed no cross-reactivity in canine muscles
Fig. 2
Fig. 2
Survival of LRMD dogs. Kaplan-Meier survival curve comparing LRMD, GRMD and healthy dogs excluding the neonatal period (beginning of the follow-up at 2 months of age). Survival was markedly reduced in both models compared with healthy dogs. LRMD dogs had a slightly better survival rate and this trend was statistically significant in the log rank test (p = 0.01)
Fig. 3
Fig. 3
Clinical scoring and gait analysis in LRMD dogs. GRMD dogs are represented in grey, and LRMD dogs in black. a longitudinal evolution of the clinical score during disease progression. The clinical score was low at the age of two months in both colonies, thereafter it rapidly increased to roughly stabilise after the age of 8 months; this indicates that there is rapid disease progression during the first months of life. From 2 to 4 months, all animals showed rapid worsening of clinical signs, with a tendency towards more homogeneous evolution of LRMD dogs. From 4 months of age onwards, the clinical evolution of the animals became more heterogeneous, with two dogs presenting more severe phenotype, and one animal presenting milder phenotype. At later stages, the clinical scores of LRMD dogs were higher than those of GRMD dogs. This was confirmed by comparing adult dogs. b comparison of clinical scores in adult LRMD vs. GRMD dogs. The clinical scores obtained in adult, clinically stabilised LRMD dogs were significantly higher than those observed in GRMD dogs (p = 0.005), suggesting that adult LRMD dogs were globally more affected than GRMD dogs. c, d longitudinal follow-up of 3 LRMD dogs during the progressive phase of the disease. The white and grey areas, respectively, represent the mean ± 1 SD of healthy dogs and GRMD dogs; the black curves represent the individual evolution of each of the three LRMD dogs. c Evolution of total power from the age of 2 to the age of 9 months. Two among the three LRMD dogs had markedly decreased total power values, the levels observed were comparable to those observed in GRMD dogs. The third animal (LRMD14) exhibited rather preserved total power values, especially in the second part of the follow-up, from the age of 6.5 months onwards, where some values overlapped with those of healthy dogs. d Evolution of the relative medio-lateral power from the age of 2 to the age of 9 months. Two among the three LRMD dogs showed a dramatic increase of their medio-lateral relative power with age and disease progression, while the third dog (LRMD14) maintained normal values throughout the follow-up period. e Projection of 4 adult LRMD dogs as supplementary individuals on a PCA (principal component analysis) plane built with adult healthy and GRMD dogs as active individuals. Healthy and GRMD populations are well separated and LRMD dogs appear in the cloud of GRMD dogs. The straight lines represent the projection of variables. The dystrophic population was separated from the healthy population mainly by decreased total power, stride length and frequency, and increased medio-lateral power. MLP/TP medio-lateral power/total power, DVP/TP dorso-ventral power/total power, CCP/TP cranio-caudal power/total power, HW height at withers
Fig. 4
Fig. 4
Force and relaxation measurement in LRMD dogs at 4 and 6 months of age. Histograms represent mean value ± SD of healthy (white), GRMD (grey) or LRMD (black) populations. The black symbols represent the individual values of the two LRMD dogs studied (2 pelvic limbs measured for each animal). a Relative maximal tetanic force, at 4 and 6 months of age, obtained after normalisation by the leg length in order to account for differences in dog size. Muscle force was decreased in LRMD dogs compared to healthy dogs, and it was slightly reduced compared with GRMD dogs. b Post-tetanic residual contraction as a percentage of the tetanic force at 4 and 6 months of age, was measured by normalising the difference between pre- and post-tetanic baselines by the maximal tetanic force. An incomplete relaxation after a tetanic stimulation was observed in LRMD dogs as well as in GRMD dogs, with an increase of this relaxation defect with age
Fig. 5
Fig. 5
Respiratory function in LRMD dogs. Healthy dogs are represented by empty grey circles, GRMD dogs by grey dots, and LRMD dogs by black symbols. Dogs included in this assessment were adults (> 10 months). a, b Results of diaphragmatic kinematics on videofluoroscopic acquisitions. a The angle formed at the ventral edge of the diaphragmatic foramen of the caudal vena cava, between a line perpendicular to the vertebral axis and a line joining the caudal edge of the 11th thoracic vertebra is reduced in LRMD dogs attesting to the caudal retraction of the diaphragm at similar levels as GRMD dogs. b The diaphragm range of motion is decreased in LRMD dogs compared to healthy dogs, but to a lesser extent than in GRMD dogs. c, d Results from spirometric acquisitions. c The expiratory flow at 75% of the expired volume, expressed as a percentage of the peak expiratory flow, is decreased in LRMD dogs, in comparison to healthy dogs; values observed in LRMD dogs overlap with those obtained in GRMD dogs. d The ratio of the peak inspiratory flow on the peak expiratory flow is decreased in LRMD dogs, overlapping with the lowest values obtained in the GRMD population. Interestingly, for most of the respiratory indices assessed, LRMD14, the dog with a milder locomotor phenotype, had better values than the other LRMD dogs studied. T13 13th thoracic vertebra. EF75 expiratory flow at 75% of the expired volume, PEF peak expiratory flow, PIF peak inspiratory flow
Fig. 6
Fig. 6
Mapping of the LRMD mutation. a Nested RT-PCR on the DMD cDNA. Normal-sized amplicons were obtained from the cDNA isolated from LRMD dogs, including the amplicons obtained using primers for exons 10 and 20 (expected size 1373 bp) and exons 21 and 26 (expected size 807 bp). A RT-PCR using primers to amplify exons 15 to 22 yielded a normal-sized amplicon (1095 bp) in the WT dog, but no band in the LRMD dog. b Southern blot on the EcoRI digested gDNA from two WT Labrador dogs unrelated to the LRMD colony and two LRMD dogs. The EcoRI restriction map of this region is schematized below the southern blot. The digestion profile of samples obtained for two LRMD dogs revealed by Probe 1, covering exons 18-24, differed from the one obtained from healthy animals. In the LRMD restriction map, an extra-band, around 13 kb, and a 2.5 kb band replacing the 2.4 kb wild-type band were observed. The use of Probe 2 covering exon 21 showed an abnormal band at 13 kb that had shifted from its normal size at 10 kb. The use of Probe 3 covering exon 20 showed an abnormal band at 2.5 kb; this band had shifted from its normal size at 2.4 kb. These results suggest that a gross rearrangement in intron 20 had occurred. c Exploration of intron 20 (4.5 kb in WT dogs) in a LRMD and a WT littermate by PCR, using 4 overlapping reactions. Normal size bands were obtained using the first three pairs of primers. The last pair of primers, designed to explore a 1661 bp region including the junction between intron 20 and exon 21, downstream the EcoRI restriction site, failed to amplify any product in LRMD dogs, even when using long-range PCR conditions
Fig. 7
Fig. 7
RNA-seq-based identification of the LRMD mutation. a A 4 Mb region spanning canFam3 chrX:30,200,000–26,200,000 is shown with RNA-seq read depths observed in a biceps femoris biopsy experiment plotted with RefSeq gene annotations. The upper panel shows Dp427m minus-strand transcript levels (DMD exons 1 through 79) seen with an unaffected dog, while the lower panel shows the inversion inferred from minus-strand DMD transcription and plus-strand ectopic transcription seen with LRMD8. The boxed inset shows a detailed view of intron 20 transcription from these two animals. b Schematic representation of the LRMD mutation, and LRMD genetic diagnosis by PCR. Two pairs of primers were used: the first set (F4R4) amplifies a 1661 bp product in the WT dog but not in the LRMD dog (breakpoint between these two primers). A second pair of primers (MutFMutR) was designed to amplify the distant site across the breakpoint yielding a 1939 bp product in the WT sample but not in the LRMD (data not shown). The proposed diagnostic PCR test relies on the use of F4 as a forward primer, and the combination of R4 and MutR as reverse primers to amplify either the WT or the LRMD allele. Using this test, a unique PCR product around 1600 bp was observed in the samples obtained from the LRMD healthy littermates (amplicon including F4-R4); a unique PCR product around 900 bp was observed in the samples of the two affected LRMD dogs (amplicon including F4-MutR); and both amplicons were observed in samples obtained from carrier females
Fig. 8
Fig. 8
Expression of the Dp71 isoform in LRMD muscles. a Comparative immunohistochemistry analysis of biopsies from the biceps femoris of a healthy dog, a GRMD dog and a LRMD dog. Three antibodies were used: MANEX1A (N-terminal part), Dys1 (Rod domain, downstream of the mutation), Dys2 (C-terminal part). As expected, the staining was positive in the muscle of the healthy dog, and negative for the GRMD dogs regardless of the antibody used. The sample obtained from the LRMD dog was negative for MANEX1A and Dys1, and positive for Dys2, but the staining was found to be heterogeneous among fibres. b Western blotting using the Dys2 antibody (C-terminal part). Muscle protein extracts from two healthy animals were loaded in wells 1 and 4 (50 μg); a normal size band corresponding to the full-length dystrophin (427 kD) was seen in these samples. Muscle protein extracts from LRMD muscles (250 μg) were loaded in wells 2 (LRMD3, biceps femoris) and 3 (LRMD3, interosseus muscle); a band at around 70 kD was observed in these lanes indicating that the protein detected was truncated. c RT-PCR using a forward primer designed to bind at the junction between the specific first exon of the Dp71 and the exon 64, and a reverse primer at the junction between exons 65 and 66. cDNA from a canine liver was used as a positive control showing a band of the expected size (164 bp). A very faint band was observed using the cDNA from a muscle sample obtained from a healthy dog and no band was observed for the GRMD dog. Conversely, in the three samples obtained from LRMD muscles (LRMD8, sartorius cranialis, biceps femoris, tibialis cranialis) a band at the same size as the positive control, though less pronounced, was seen, indicating that the Dp71 transcript is present in LRMD muscle. Sart sartorius cranialis muscle, BF biceps femoris muscle, TC tibialis cranialis muscle

References

    1. Crisafulli S, Sultana J, Fontana A, Salvo F, Messina S, Trifiro G. Global epidemiology of Duchenne muscular dystrophy: an updated systematic review and meta-analysis. Orphanet.J.Rare.Dis. 2020;15:141. - PMC - PubMed
    1. Bushby K, Finkel R, Birnkrant DJ, Case LE, Clemens PR, Cripe L, et al. Diagnosis and management of Duchenne muscular dystrophy, part 1: diagnosis, and pharmacological and psychosocial management. Lancet Neurol. 2010;9:77–93. - PubMed
    1. Birnkrant DJ, Bushby K, Bann CM, Apkon SD, Blackwell A, Brumbaugh D, et al. Diagnosis and management of Duchenne muscular dystrophy, part 1: diagnosis, and neuromuscular, rehabilitation, endocrine, and gastrointestinal and nutritional management. Lancet Neurol. 2018;17:251–267. - PMC - PubMed
    1. Landfeldt E, Thompson R, Sejersen T, McMillan HJ, Kirschner J, Lochmuller H. Life expectancy at birth in Duchenne muscular dystrophy: a systematic review and meta-analysis. Eur.J.Epidemiol. 2020. - PMC - PubMed
    1. Valentine BA, Cooper BJ, de LA, O'Quinn R, Blue JT. Canine X-linked muscular dystrophy. An animal model of Duchenne muscular dystrophy: clinical studies. J.Neurol.Sci. 1988;88:69-81. - PubMed

Publication types

LinkOut - more resources