. 2020 Nov;159(5):1882-1897.e5.
doi: 10.1053/j.gastro.2020.07.046. Epub 2020 Aug 5.

Loss of HIF1A From Pancreatic Cancer Cells Increases Expression of PPP1R1B and Degradation of p53 to Promote Invasion and Metastasis

Affiliations

Loss of HIF1A From Pancreatic Cancer Cells Increases Expression of PPP1R1B and Degradation of p53 to Promote Invasion and Metastasis

Ashutosh Tiwari et al. Gastroenterology. 2020 Nov.

Abstract

Background & aims: Pancreatic ductal adenocarcinomas (PDACs) are hypovascular, resulting in the up-regulation of hypoxia inducible factor 1 alpha (HIF1A), which promotes the survival of cells under low-oxygen conditions. We studied the roles of HIF1A in the development of pancreatic tumors in mice.

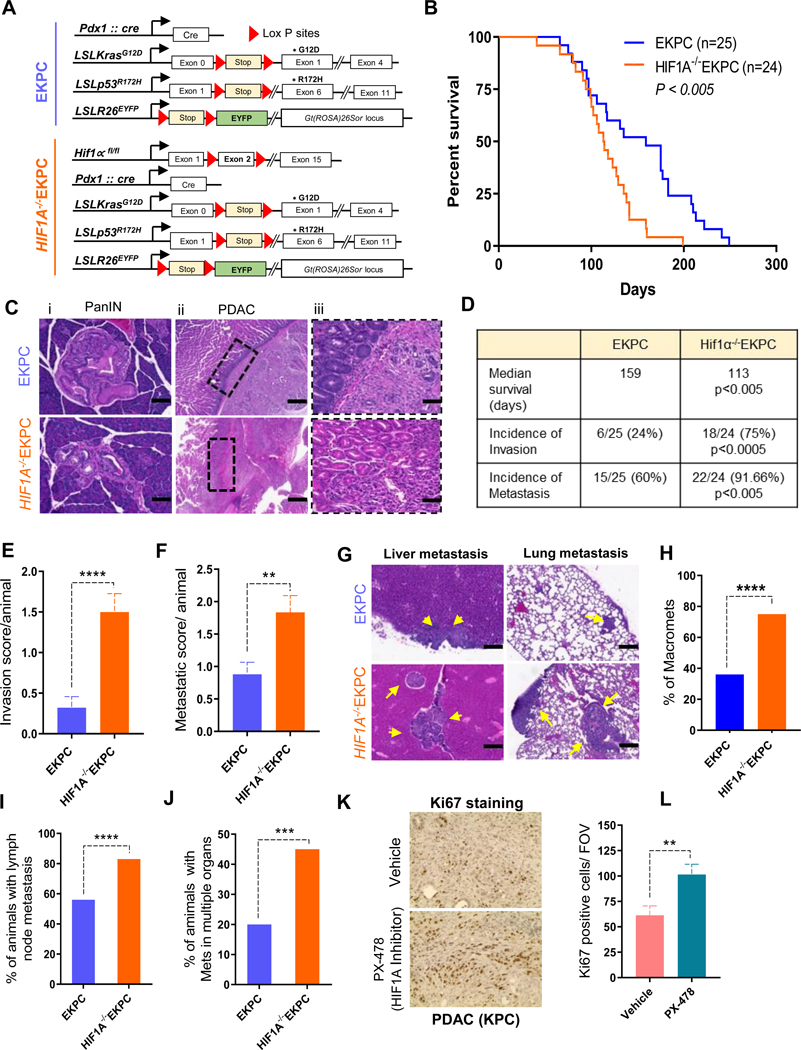
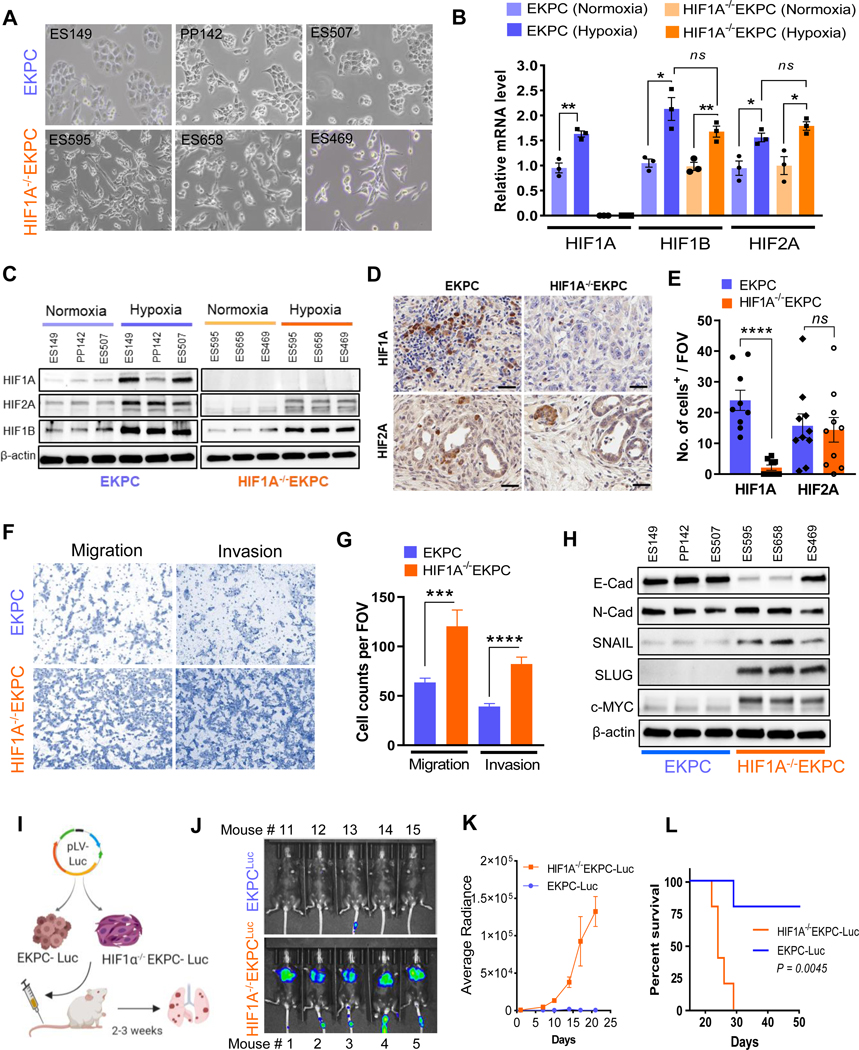
Methods: We performed studies with KrasLSL-G12D/+;Trp53LSL-R172H/+;Pdx1-Cre (KPC) mice, KPC mice with labeled pancreatic epithelial cells (EKPC), and EKPC mice with pancreas-specific depletion of HIF1A. Pancreatic and other tissues were collected and analyzed by histology and immunohistochemistry. Cancer cells were cultured from PDACs from mice and analyzed in cell migration and invasion assays and by immunoblots, real-time polymerase chain reaction, and liquid chromatography-mass spectrometry. We performed studies with the human pancreatic cancer cell lines PATU-8988T, BxPC-3, PANC-1, and MiaPACA-2, which have no or low metastatic activity, and PATU-8988S, AsPC-1, SUIT-2 and Capan-1, which have high metastatic activity. Expression of genes was knocked down in primary cancer cells and pancreatic cancer cell lines by using small hairpin RNAs; cells were injected intravenously into immune-competent and NOD/SCID mice, and lung metastases were quantified. We compared levels of messenger RNAs in pancreatic tumors and normal pancreas in The Cancer Genome Atlas.

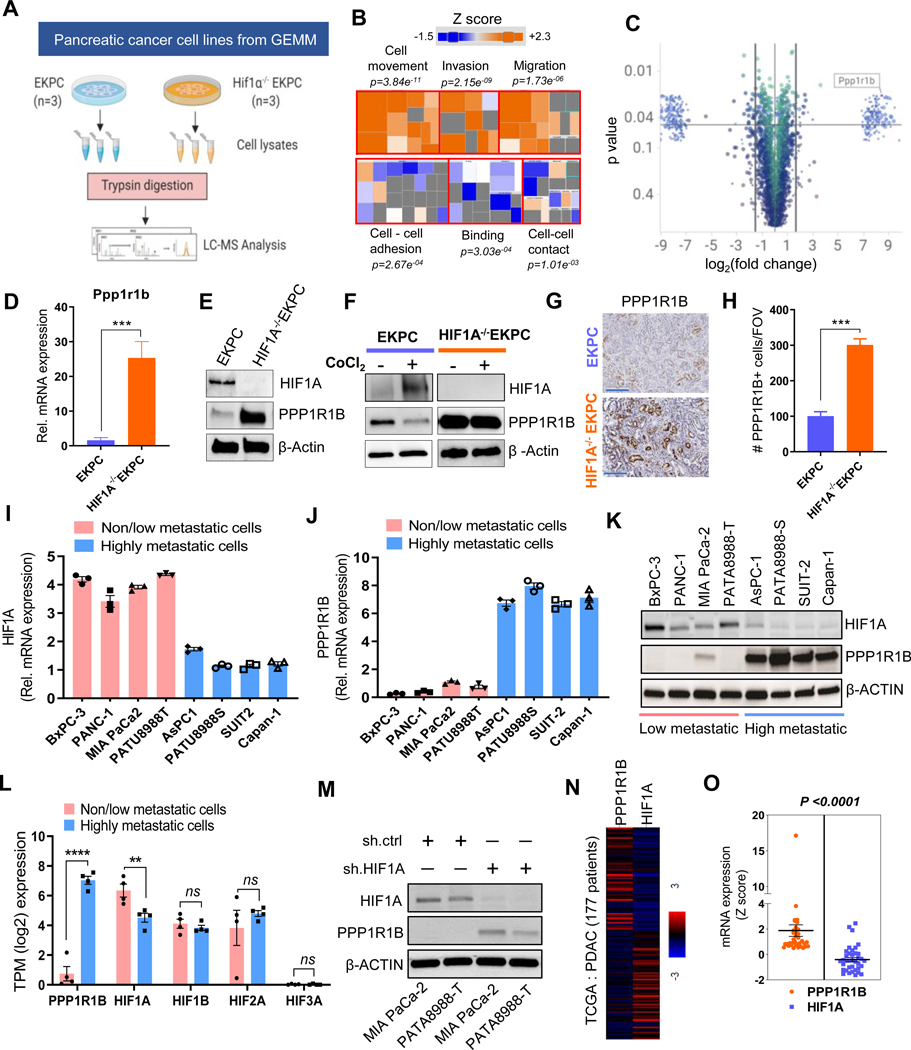
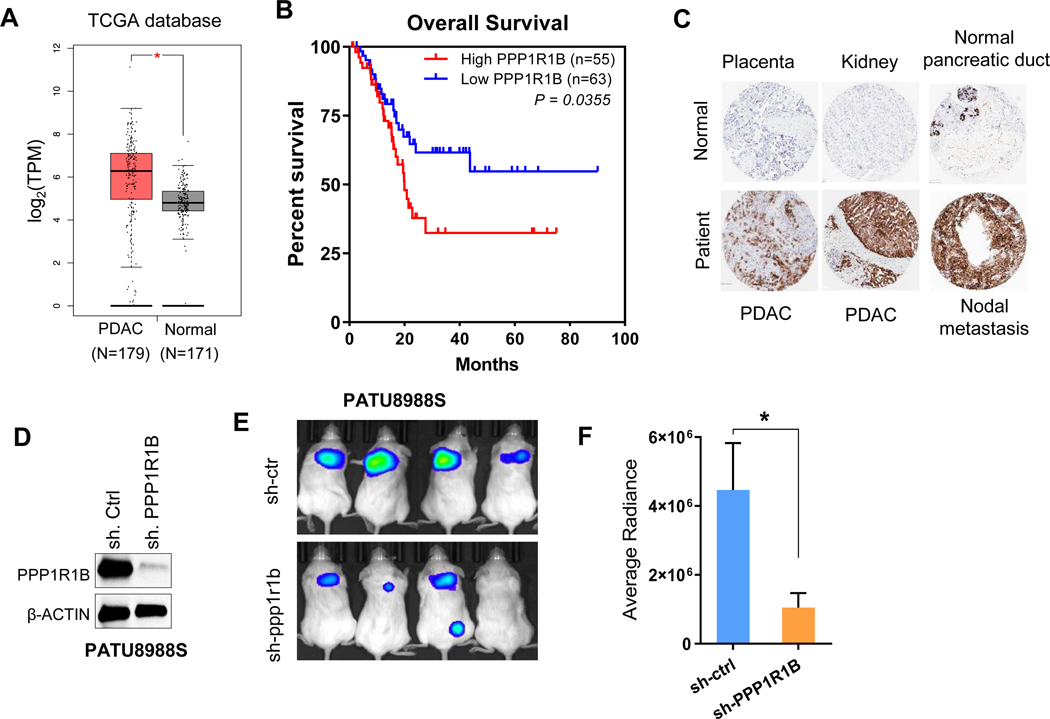
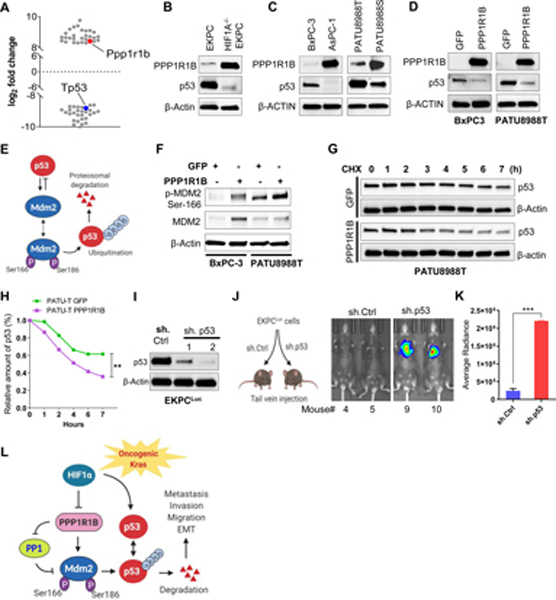
Results: EKPC mice with pancreas-specific deletion of HIF1A developed more advanced pancreatic neoplasias and PDACs with more invasion and metastasis, and had significantly shorter survival times, than EKPC mice. Pancreatic cancer cells from these tumors had higher invasive and metastatic activity in culture than cells from tumors of EKPC mice. HIF1A-knockout pancreatic cancer cells had increased expression of protein phosphatase 1 regulatory inhibitor subunit 1B (PPP1R1B). There was an inverse correlation between levels of HIF1A and PPP1R1B in human PDAC tumors; higher expression of PPP1R1B correlated with shorter survival times of patients. Metastatic human pancreatic cancer cell lines had increased levels of PPP1R1B and lower levels of HIF1A compared with nonmetastatic cancer cell lines; knockdown of PPP1R1B significantly reduced the ability of pancreatic cancer cells to form lung metastases in mice. PPP1R1B promoted degradation of p53 by stabilizing phosphorylation of MDM2 at Ser166.

Conclusions: HIF1A can act a tumor suppressor by preventing the expression of PPP1R1B and subsequent degradation of the p53 protein in pancreatic cancer cells. Loss of HIF1A from pancreatic cancer cells increases their invasive and metastatic activity.

Keywords: Carcinogenesis; Cell Motility; Signal Transduction; Tumor Progression.


Conflict of interest statement

Conflicts of interest: The authors disclose no conflicts.

Figures

Figure 1:
Figure 1:. Loss of HIF1A leads to adverse outcome in PDAC.
(A) Schematics of EKPC (Blue) mouse model of pancreatic cancer, which employs LSLKrasG12D/+ (K), LSLp53R172H/+ (P), Pdx1-Cre (C), and LSLRosa EYFP (E) alleles. Pancreas specific depletion of HIF1A was attained by crossing EKPC with HIF1Aflox/flox mouse strain and referred as HIF1A−/−EKPC (Orange). (B) Kaplan-Meier analysis comparing survival of EKPC (n = 25) and HIF1A−/−EKPC (n = 24) mice; **P<0.005 Mantel-Cox test. (C) Hematoxylin and eosin (H&E) staining of pancreata from EKPC and HIF1A−/−EKPC mice. Loss of HIF1A promotes more advanced PanINs and locally invasive and metastatic PDAC. Representative PanIN lesions in EKPC and HIF1A−/−EKPC mice (i). The duodenum-PDAC interface in EKPC and HIF1A−/−EKPC mice showing a distinct example of an intact boundary without local invasion in EKPC mice, whereas PDACs from HIF1A−/−EKPC mice frequently show local invasion into adjacent organs (ii & iii) (D) Table showing comparative median survival (P<0.005), and incidences of local invasion (P<0.0005) and metastasis (P<0.005) in EKPC and HIF1A−/−EKPC mice; by Fisher’s exact test. (E) Comparative Invasion score (total number of organs showing local invasion by primary tumor divided by total number of animals) in EKPC (n=25) and HIF1A−/−EKPC mice (n=24), ****P<0.0001 by unpaired t test (F) Metastatic score (total number of organs showing Mets divided by total number of animals) in EKPC (n=25) and HIF1A−/−EKPC mice (n=24), ** P<0.005 by unpaired t test (G) Representative H&E stained images of the liver and lung mets (marked by arrows) in EKPC and HIF1A−/−EKPC cohorts. (Scale bar:10μm C,F) (H) Percentage of Macro-mets in EKPC and HIF1A−/−EKPC, ****P<0.0001 by Fisher’s exact test (I) Percentage of EKPC and HIF1A−/−EKPC mice with lymph node involvement; ****P<0.0001 by Fisher’s exact test (J) Percentage of EKPC and HIF1A−/−EKPC mice with metastasis in more than one organ; ***P < 0.001 by Fisher’s exact test. (K) Representative Ki-67 staining for proliferating cells in PDAC from KPC mice treated with HIF1Ainhibitor (PX-478) and vehicle control (L) Quantification of Ki-67 staining as total number of cells per field of vision in tumor sections from control and treated KPC mice. 10 FOV from each treatment group were randomly chosen and Ki67 positive cells were calculated, **P<0.005 by unpaired t test.
Figure 2:
Figure 2:. Depletion of HIF1A enhances invasion and migration of Pancreatic Cancer cells.
(A) Bright field image of primary cell lines derived from EKPC (ES149, PP142 & ES507) and HIF1A−/− EKPC (ES595, ES658 & ES469) tumors. (B) Expression of HIF1A, HIF1B, and HIF2A mRNA under hypoxic/normoxic conditions in EKPC and HIF1A−/−EKPC cell lines. Relative gene expression level for HIF1A, HIF1B, and HIF2A in EKPC (blue) and HIF1A−/− EKPC (orange) cells were normalized with GAPDH expression; n=3 biologically independent experiments; *P<0.05 and **P<0.005 by unpaired t test. (C) Western blot analysis of HIF1A, HIF2A and HIF1B under hypoxic/normoxic conditions in EKPC and HIF1A−/−EKPC cell lines. Beta-actin was used as loading control. (D) Representative images of immunohistochemistry staining for HIF1A and HIF2A in EKPC and HIF1A−/−EKPC tumor sections. Scale bar, 50 μm (E) Quantification of HIF1A and HIF2A positive cells per field of vision in EKPC and HIF1A−/−EKPC tumor sections. The data are shown as the mean ± s.e.m. P values by unpaired t test. ns, not significant, ****P < 0.0001. (F&G) Representative images and quantitative analysis of transwell migration and matrigel invasion assay of EKPC and HIF1A−/−EKPC cells. Total number of cells per field were counted. n=3 biologically independent experiments ***P < 0.001, ****P < 0.0001 by t test. (H) Immunoblot analysis of EMT markers (E-cad, Snail and Slug) and c-Myc protein in EKPC and HIF1A−/−EKPC cells. (I) Schematics of in vivo lung colonization assay for metastatic burden. EKPC and HIF1A-/EKPC cells expressing Luciferase were injected into the lateral tail vein of immunocompetent C57BL/6 mice (n=5 for each group), and (J&K) Representative bioluminescence imaging and quantitative analysis of lung metastasis by BLI plot **p<0.001 by Mann Whitney test. (L) KaplanMeier analysis of mice injected with EKPC and HIF1A−/−EKPC cells. **p< 0.005 by Log-rank (Mantel–Cox) test.
Figure 3:
Figure 3:. HIF1A regulates PPP1R1B in pancreatic cancer.
(A) Schematic workflow of proteomics analysis of EKPC and HIF1A−/−EKPC cells (B) The Disease and Function heatmap generated by IPA of the proteomics data reflecting the significantly enhanced (orange) or decreased (blue) cellular functions in HIF1A−/−EKPC compared with the EKPC cells. The positive and negative z scores are indicated by orange and blue color respectively. The size of the boxes reflects the predicted direction of change for the function. p values are calculated by Fisher’s Exact Test (C) Scatter plot depicting the differentially expressed proteins (DEP) in HIF1A−/−EKPC cells compared with the EKPC cells. Proteins were organized by log2 fold change (x-axis) and p-value (y-axis). The cutoff lines (pvalue of 0.05 and log2 fold change ±1.5) are shown in black. PPP1R1B protein is marked exhibiting 8.426 log2fold change; p=0.016. (D) qPCR analysis showing Ppp1r1b mRNA levels in EKPC (blue) and HIF1A−/−EKPC (orange) cells. Gapdh was used as control. ***p < 0.001 by t test analysis. (E) Immunoblot analysis of HIF1A, Ppp1r1b in EKPC and HIF1A−/−EKPC cells. (F) Western blot analysis of HIF1A and PPP1R1B expression in untreated and CoCl2 treated (100 μM for 12 hr) EKPC and HIF1A−/−EKPC cells. (G,H) IHC staining and quantification for PPP1R1B+ cells in EKPC and HIF1A−/−EKPC tumors, Scale:200 μm, (n = 5 for each group, n = 3 field of vision). ***p < 0.001 by t test analysis. (I-J) q-PCR analysis of HIF1A and PPPP1R1B transcripts in non/low-metastatic (BxPC-3, PANC-1, Mia PACA-2 and PATU8988T) and high-metastatic (AsPC-1, PATU8988S, SUIT-2 and Capan-1) human pancreatic cancer cell lines. ****p < 0.0001 by ordinary one-way ANOVA (K) Immunoblot analysis of HIF1A and PPPP1R1B in non/low-metastatic and high-metastatic human pancreatic cancer cell lines (L) Comparative expression analysis of PPP1R1B, HIF1A, HIF1B, HIF2A and HIF3A between non/low-metastatic (BxPC-3, PANC-1, Mia PACA-2 and PATU8988T) and high-metastatic (AsPC-1, PATU8988S, SUIT-2 and Capan-1) human pancreatic cancer cell lines. ns, not significant **p < 0.005, ****p < 0.0001 by unpaired t test analysis. (M) Western blot analysis of PPP1R1B and HIF1A of MIA-PaCa-2 and PATU8988T cells transfected with sh.Ctrl and sh.HIF1A (N) Heat map of HIF1A and PPP1R1B expression in PDAC patients from TCGA. (O) Paired analysis of PPP1R1B and HIF1A expression in PDAC patients (n=36) ranked based on Z scores (≥0.5). ****p<0.0001 by paired t test. All experiments were carried out in triplicate. All bar graphs represent mean and error bars are s.e.m.
Figure 4:
Figure 4:. Increased expression of PPP1R1B correlates with poor survival and its knockdown inhibits malignant properties of PDAC cells
(A). Comparative expression analysis of PPP1R1B in 179 PDAC tissue samples with that of 171 normal pancreas using the TCGA database (GEPIA). *P<0.05 (B) Kaplan–Meier survival analysis of pancreatic cancer patients with high (n=55) and low (n=63) PPP1R1B expression (TCGA), *P<0.05 by Mantel-Cox test (C) IHC staining of PPP1R1B in human tissue array which includes normal kidney, placenta, benign pancreatic duct, PDACs and nodal metastasis. (D) Western blot analysis of PPP1R1B in PATU8988S cells transfected with sh.Ctrl or sh.PPP1R1B. (E&F) Lung colonization assay of PATU8988S+sh.PPP1R1B and PATU8988S+sh.Ctrl cells in NOD/SCID mice by bioluminescence, n=4 for each group. *p<0.05 by t test.
Figure 5:
Figure 5:. PPP1R1B promotes metastasis in pancreatic cancer by reducing p53
(A) Scatter plot depicting the most significantly up or down regulated proteins (> ± log28) in HIF1A−/−EKPC cells compared with the EKPC cells. Proteins were organized by log2 fold change (Y-axis). PPP1R1B and p53 are indicated by red and blue respectively. (B,C) Immunoblot analysis of PPP1R1B and p53 levels in mouse and human pancreatic cancer cell lines. β ACTIN was used as control. (D) Western blot analysis of ectopic expression of PPP1R1B and its effect on p53 level in BxPC-3 and PATU8988T cells. GFP was used as control. (E) Schematic model of MDM2 and p53 feedback regulatory loop (F) Western blot analysis of phospho-MDM2Ser186, total MDM2 and β ACTIN in BxPC-3 and PATU-8988T cells overexpressing PPP1R1B. GFP was used as control. (G & H) Cycloheximide chase assay and quantification for p53 in PATU8988T cells overexpressing PPP1R1B or GFP. β-ACTIN was used as a loading control. (I) Western blot analysis of p53 and β ACTIN levels in EKPCLuc cells stably transfected with sh.Ctrl and two independent sh.p53. (J & K) Lung colonization of EKPCLuc + sh.p53 or EKPCLuc + sh.Ctrl cells bioluminescence imaging. N=5 for each group. ***p<0.0005 by t test (L) Schematic of the mechanistic link between loss of HIF1A, increased expression of PPP1R1B and degradation of the p53 protein that promotes invasion and metastasis in PDAC.

References

    1. Siegel RL, Miller KD, Jemal A. Cancer statistics, 2019. CA Cancer J Clin 2019;69:7–34. - PubMed
    1. Bailey P, Chang DK, Nones K, et al. Genomic analyses identify molecular subtypes of pancreatic cancer. Nature 2016;531:47–52. - PubMed
    1. Cannon A, Thompson C, Hall BR, et al. Desmoplasia in pancreatic ductal adenocarcinoma: insight into pathological function and therapeutic potential. Genes Cancer 2018;9:78–86. - PMC - PubMed
    1. Craven KE, Gore J, Korc M. Overview of pre-clinical and clinical studies targeting angiogenesis in pancreatic ductal adenocarcinoma. Cancer Lett 2016;381:201–10. - PMC - PubMed
    1. Koong AC, Mehta VK, Le QT, et al. Pancreatic tumors show high levels of hypoxia. Int J Radiat Oncol Biol Phys 2000;48:919–22. - PubMed

Publication types

MeSH terms

Substances