. 2020 Nov;216(3):735-752.
doi: 10.1534/genetics.120.303533. Epub 2020 Aug 7.

Functional Divergence of Mammalian TFAP2a and TFAP2b Transcription Factors for Bidirectional Sleep Control

Affiliations

Functional Divergence of Mammalian TFAP2a and TFAP2b Transcription Factors for Bidirectional Sleep Control

Yang Hu et al. Genetics. 2020 Nov.

Abstract

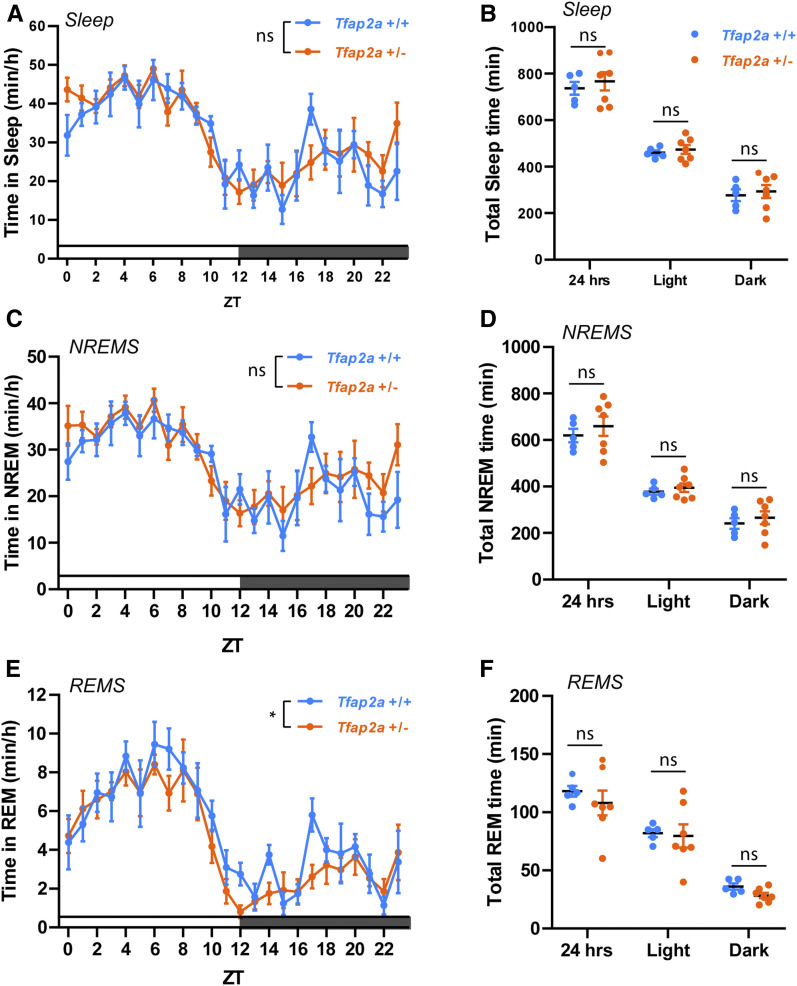
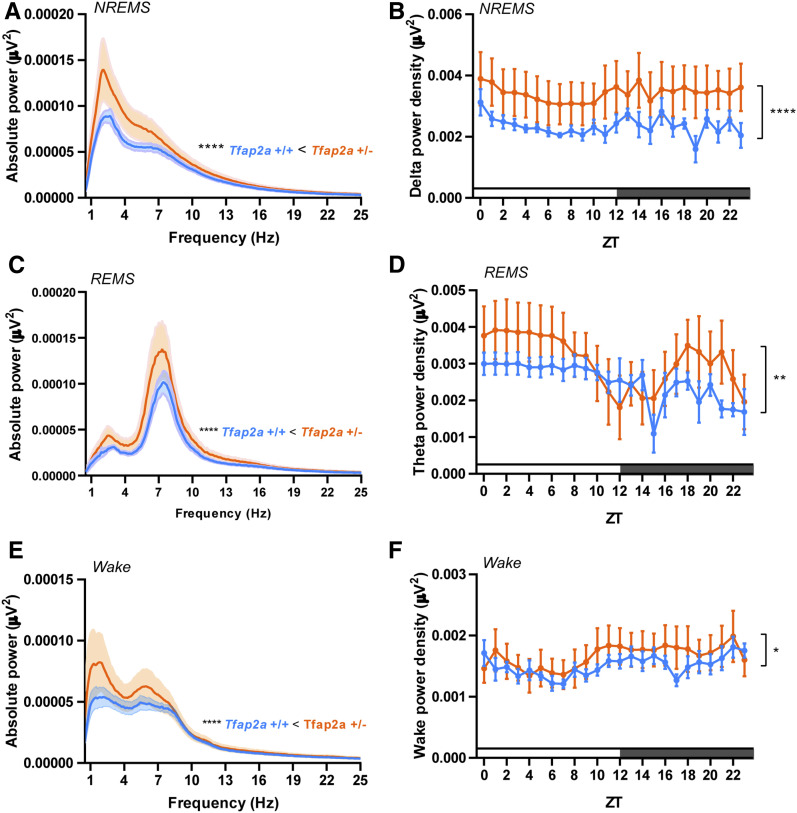
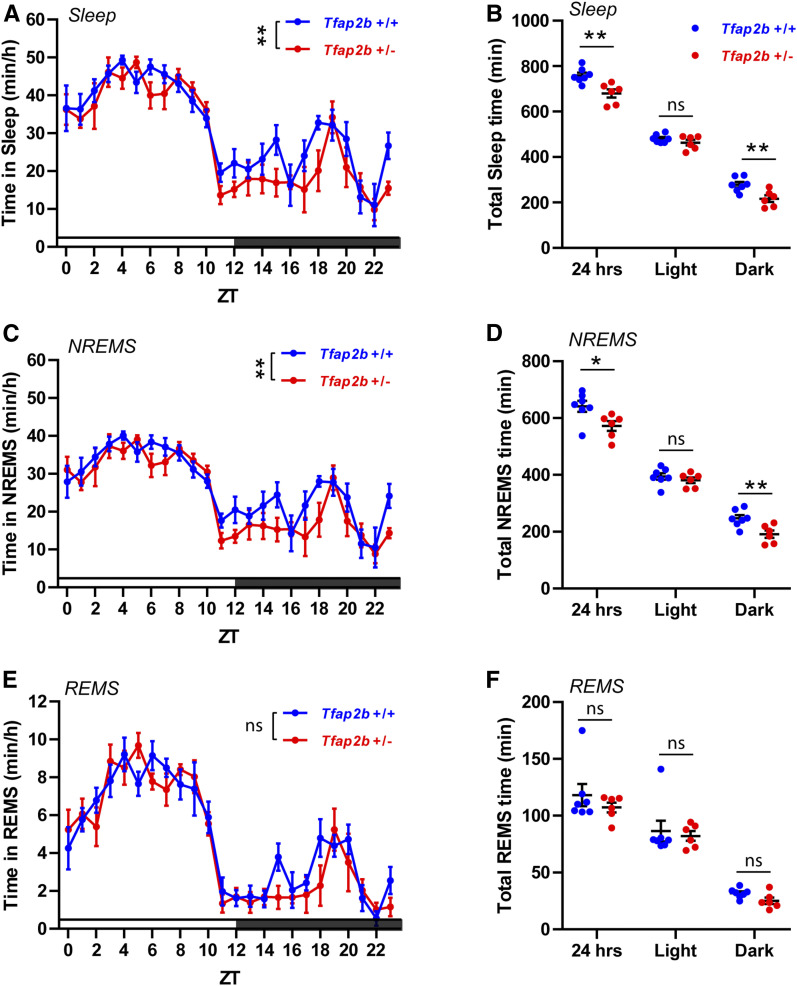
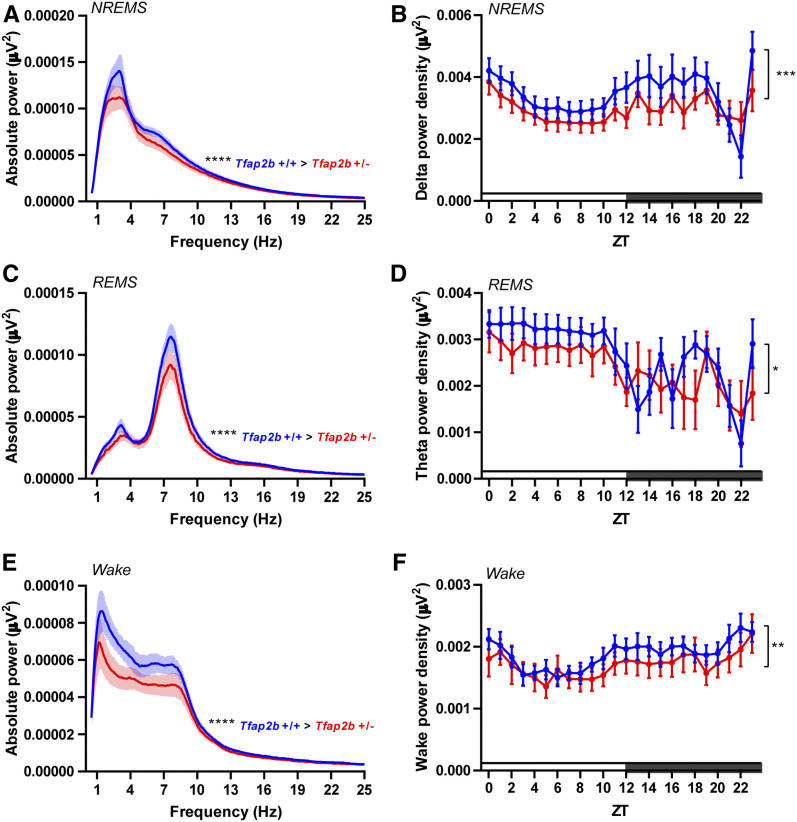
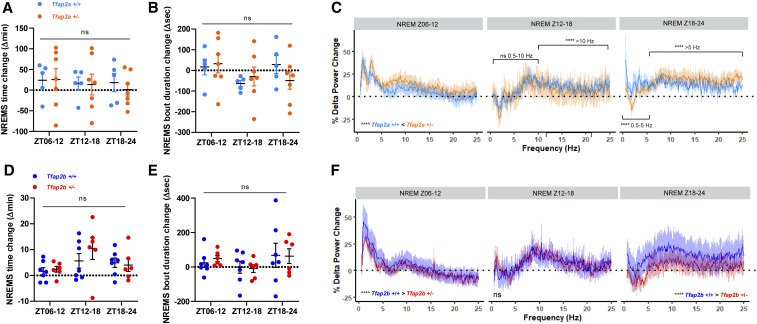
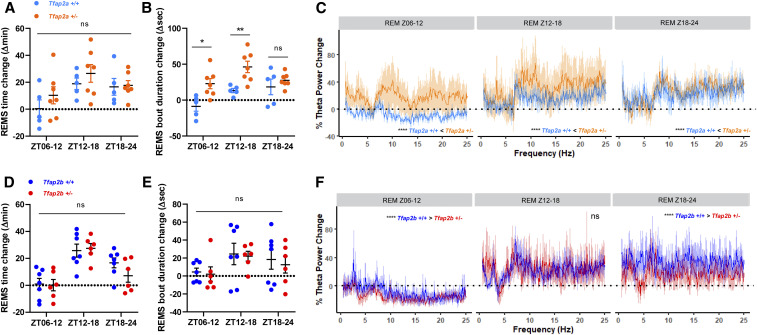
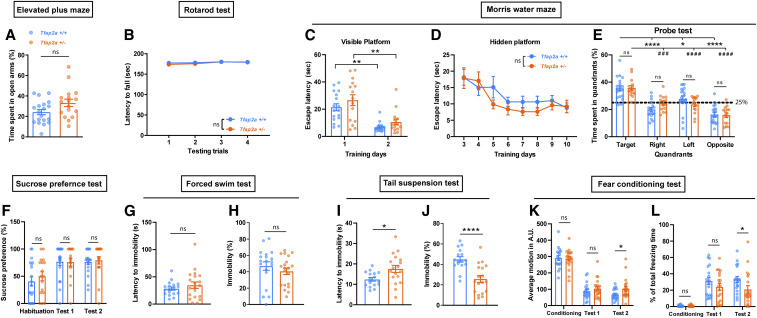
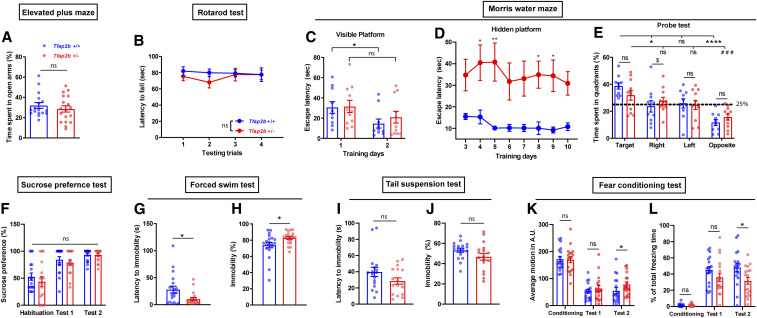
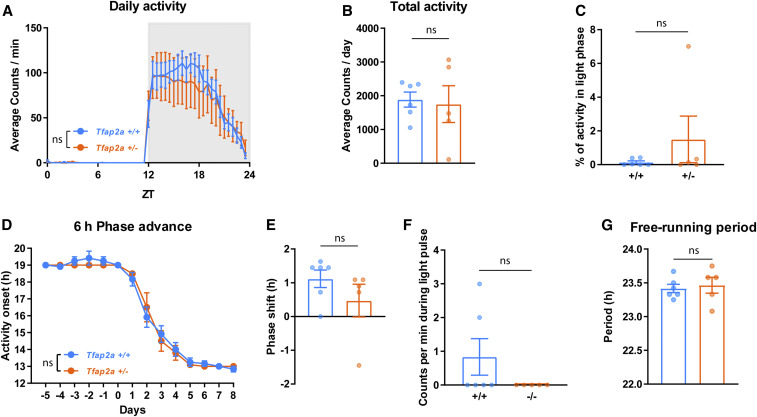
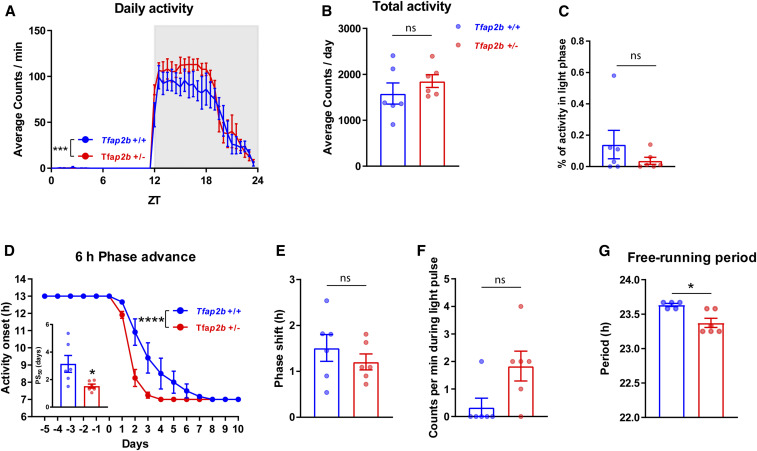
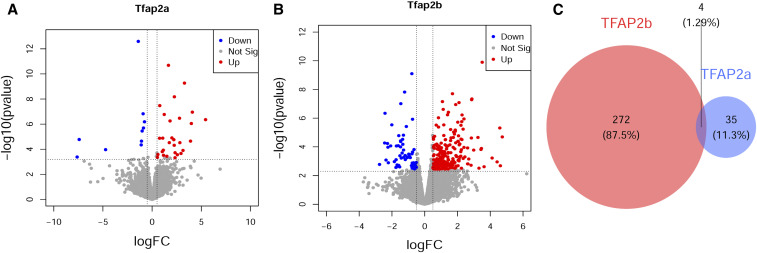
Sleep is a conserved behavioral state. Invertebrates typically show quiet sleep, whereas in mammals, sleep consists of periods of nonrapid-eye-movement sleep (NREMS) and REM sleep (REMS). We previously found that the transcription factor AP-2 promotes sleep in Caenorhabditiselegans and Drosophila In mammals, several paralogous AP-2 transcription factors exist. Sleep-controlling genes are often conserved. However, little is known about how sleep genes evolved from controlling simpler types of sleep to govern complex mammalian sleep. Here, we studied the roles of Tfap2a and Tfap2b in sleep control in mice. Consistent with our results from C. elegans and Drosophila, the AP-2 transcription factors Tfap2a and Tfap2b also control sleep in mice. Surprisingly, however, the two AP-2 paralogs play contrary roles in sleep control. Tfap2a reduction of function causes stronger delta and theta power in both baseline and homeostasis analysis, thus indicating increased sleep quality, but did not affect sleep quantity. By contrast, Tfap2b reduction of function decreased NREM sleep time specifically during the dark phase, reduced NREMS and REMS power, and caused a weaker response to sleep deprivation. Consistent with the observed signatures of decreased sleep quality, stress resistance and memory were impaired in Tfap2b mutant animals. Also, the circadian period was slightly shortened. Taken together, AP-2 transcription factors control sleep behavior also in mice, but the role of the AP-2 genes functionally diversified to allow for a bidirectional control of sleep quality. Divergence of AP-2 transcription factors might perhaps have supported the evolution of more complex types of sleep.

Keywords: EEG; Mus musculus; TFAP2; behavior; sleep.


Figures

Figure 1
Figure 1
Sleep amount is not significantly altered in Tfap2a+/− mice. (A) Total sleep quantification over Zeitgeber times (ZT), two-way ANOVA followed by Sidak’s multiple comparisons test, the main effect of genotype, F (1,240) = 0.941, P = 0.333. (B) Total sleep time quantification, P = 0.576; light, P = 0.574; dark, P = 0.687. (C) NREMS quantification over ZT, two-way ANOVA followed by Sidak’s multiple comparisons test, the main effect of genotype, F (1,10) = 0.526, P = 0.485. (D) NREMS time quantification, P = 0.446; light, P = 0.521; dark, P = 0.543. (E) REMS quantification over ZT, two-way ANOVA followed by Sidak’s multiple comparisons test, the main effect of genotype, F (1,239) = 0.492, *P = 0.0353. (F) REMS time quantification, P = 0.466; light, P = 0.852; dark, P = 0.053. n = 5 for Tfap2a+/+, n = 7 for Tfap2a+/−. Two-tailed unpaired t-tests were used for (B, D, and F). Averaged data are shown as the mean ± SEM.
Figure 2
Figure 2
EEG delta and theta power are increased in Tfap2a+/− mice. (A) EEG power spectra in NREMS. (B) NREMS delta power (1–4 Hz), two-way ANOVA followed by Sidak’s multiple comparisons test, the main effect of genotype, F (1,240) = 29.58, ****P < 0.0001. (C) EEG power spectra in REMS. (D) REMS theta power (6–10 Hz): two-way ANOVA followed by Sidak’s multiple comparisons test, the main effect of genotype, F (1,240) = 7.558, **P = 0.0064. (E) EEG power spectra during wakefulness. (F) Power analysis during wake (0.5–4 Hz), two-way ANOVA followed by Sidak’s multiple comparisons test, the main effect of genotype, F (1,240) = 4.028, *P = 0.0459. All data are shown as the mean ± SEM n = 5 for Tfap2a+/+, n = 7 for Tfap2a+/−. P values for 1–25 Hz were calculated using Wilcoxon two-sided signed-rank test, ****P < 0.0001. All data are shown as the mean ± SEM.
Figure 3
Figure 3
Sleep during the dark phase is reduced in Tfap2b+/− mice. (A) Total sleep time quantification over ZT, two-way ANOVA followed by Sidak’s multiple comparisons test, the main effect of genotype, F (1,264) = 10.01, **P = 0.002. (B) Total sleep time quantification, **P = 0.004; light, P = 0.222; dark, **P = 0.007. (C) NREMS quantification over ZT, two-way ANOVA followed by Sidak’s multiple comparisons test, the main effect of genotype, F (1,264) = 10.26, **P = 0.002. (D) NREMS total time quantification, *P = 0.024; light, P = 0.411; dark, **P = 0.008. (E) REMS quantification over ZT, two-way ANOVA followed by Sidak’s multiple comparisons test, the main effect of genotype, F (1,263) = 1.492, P = 0.223. (F) REMS total time quantification, P = 0.668; light, P = 1.000; dark, P = 0.055. n = 7 for Tfap2b+/+, n = 6 for Tfap2b+/−. Two-tailed unpaired t-tests were used for (B, D, and F). All data are shown as the mean ± SEM.
Figure 4
Figure 4
EEG delta and theta power are decreased in Tfap2b+/− mice. (A) EEG power spectra in NREMS. (B) NREMS delta power (1–4 Hz), two-way ANOVA followed by Sidak’s multiple comparisons test, the main effect of genotype, F (1,264) = 13.68, ***P = 0.0003. (C) EEG power spectra in REMS. (D) REMS theta power (6–10 Hz), two-way ANOVA followed by Sidak’s multiple comparisons test, the main effect of genotype, F (1,264) = 5.525, *P = 0.0195. (E) EEG power spectra during wakefulness. (F) Wake power analysis (0.5–4 Hz), two-way ANOVA followed by Sidak’s multiple comparisons test, the main effect of genotype, F (1,264) = 9.126, **P = 0.0028. All data are shown as the mean ± SEM, n = 7 for Tfap2b+/+, n = 6 for Tfap2b+/−. P values for 1–25 Hz were calculated using Wilcoxon two-sided signed-rank test, ****P < 0.0001. All data are shown as the mean ± SEM.
Figure 5
Figure 5
NREMS delta power following sleep deprivation is increased more strongly in Tfap2a+/− mice but less strongly in Tfap2b+/− mice. (A) NREMS time change in Tfap2a+/−, two-way ANOVA tests followed by Sidak’s pairwise comparison, the main effect of genotype: F(1, 30) = 0.103, P = 0.750; the main effect of time, F(2, 30) = 0.791, P = 0.791. (B) Average NREMS bout duration change in Tfap2a+/−, two-way ANOVA tests followed by Sidak’s pairwise comparison, the main effect of genotype: F(1, 30) = 0.072, P = 0.790; the main effect of time, F(2, 30) = 1.407, P = 0.261. (C) NREMS delta power changes (0.5–25 Hz) in Tfap2a+/− mice. Z06-12: 0.5–25 Hz, ****P < 0.0001. Z12-18: 0.5–10 Hz, P = 0.334; 10–25 Hz, ****P < 0.0001. Z18–24: 0.5–5 Hz, P = 0.334; 5–25 Hz, ****P < 0.0001. (D) NREMS time change in Tfap2b+/−, two-way ANOVA tests followed by Sidak’s pairwise comparison, the main effect of genotype: F(1, 33) = 0.595, P = 0.446; the main effect of time, F(2, 33) = 3.008, P = 0.063. (E) Average NREMS bout duration change in Tfap2b+/−, two-way ANOVA tests followed by Sidak’s pairwise comparison, the main effect of genotype: F(1, 33) = 0.014, P = 0.906; the main effect of time, F(2, 33) = 1.476, P = 0.243. (F) NREMS delta power changes (0.5–25 Hz) in Tfap2b+/− mice. Z06–12: 0.5–25Hz, ****P < 0.0001. Z12–18: 0.5–25 Hz, P = 0.715. Z18–24: 0.5–25 Hz, ****P < 0.0001. n = 5 for Tfap2a+/+, n = 7 for Tfap2a+/−, n = 7 for Tfap2b+/+, n = 6 for Tfap2b+/−. Wilcoxon two-sided signed-rank tests were used for power changes in (C and F). BSL, baseline sleep; R, recovery sleep. All data are shown as the mean ± SEM.
Figure 6
Figure 6
REMS theta power following sleep deprivation is increased more strongly in Tfap2a+/− mice but less strongly in Tfap2b+/− mice compared with wild-type controls. (A) REMS time change in Tfap2a+/−, two-way ANOVA tests followed by Sidak’s pairwise comparison, the main effect of genotype: F(1, 30) = 1.698, P = 0.202; the main effect of time, F(2, 30) = 4.585, P = 0.018. (B) Average REMS bout duration change in Tfap2a+/−, two-way ANOVA tests followed by Sidak’s pairwise comparison, the main effect of genotype: F(1, 30) = 17.95, P = 0.010; the main effect of time, F(2, 30) = 5.365, P = 0.0002. ZT06–12: *P = 0.011. Z12–18: **P = 0.0079. Z18–24: P = 0.749. (C) Rebound differences of REMS in theta power (0.5–25 Hz) in Tfap2a+/−. Z06–12: 0.5–25 Hz, ****P < 0.0001. Z12–18: 0.5–25 Hz, ****P < 0.0001. Z18–24: 0.5–25 Hz, ****P < 0.0001. (D) REMS time change in Tfap2b+/−, two-way ANOVA tests followed by Sidak’s pairwise comparison, the main effect of genotype: F(1, 33) = 0.673, P = 0.418; the main effect of time, F(2, 33) = 16.86, P < 0.0001. (E) Average REMS bout duration in Tfap2b+/−, two-way ANOVA tests followed by Sidak’s pairwise comparison, the main effect of genotype: F(1, 33) = 0.234, P = 0.632; the main effect of time, F(2, 33) = 2.521, P = 0.096. (F) Rebound differences of REMS in theta power (0.5–25 Hz) in Tfap2b+/−. Z06–12: 0.5–25 Hz, ****P < 0.0001. Z12–18: 0.5–25 Hz, P = 0.119. Z18–24: 0.5–25 Hz, ****P < 0.0001. n = 5 for Tfap2a+/+, n = 7 for Tfap2a+/−, n = 7 for Tfap2b+/+, n = 6 for Tfap2b+/−. Wilcoxon two-sided signed-rank tests were used for power changes in (C and F). BSL, baseline sleep; R, recovery sleep. All data are shown as the mean ± SEM.
Figure 7
Figure 7
Behavioral phenotyping of Tfap2a+/− mice reveals signs of mild hyperactivity. (A) Elevate plus maze, two-tailed unpaired t-test, P = 0.136. (B) Rotarod test, two-way ANOVA test, the main effect of genotype: F(1, 148) = 0.927, P = 0.337; the main effect of time, F(3, 148) = 2.512, P = 0.061. (C) Morris water maze (MWM), time spent searching for visible platform during two consecutive training days: to compare mutants and their controls, unpaired Student t-test was used for day 1, P = 0.274; Mann-Whitney U-test for day 2, P = 0.096. Wilcoxon two-sided signed-rank tests for two related samples were used for day 1 and day 2 within each genotype: Tfap2a+/+, **P = 0.001; Tfap2a+/−, **P = 0.004. (D) MWM, time spent searching for hidden platform during eight consecutive training days from day 3 to day 10. Two-way ANOVA tests followed by Sidak’s pairwise comparison, the main effect of genotype: F(1, 256) = 1.049, P = 0.307; the main effect of time, F(7, 256) = 8.652, P < 0.0001. (E) MWM, time spent in each quadrant during probe test: one-way ANOVA followed by Sidak’s pairwise comparison, F = 21.125, P < 0.0001. Tfap2a+/+ vs. Tfap2a+/−: target, P = 1.000; right, P = 0.819; left, P = 0.918; opposite, P = 1.000. Target vs. right/left/opposite quadrant in Tfap2a+/+: ****P < 0.0001, *P = 0.024, ****P < 0.0001. Target vs. right/left/opposite in Tfap2a+/−: ###P = 0.001, ####P < 0.0001, ####P < 0.0001. (F) Sucrose preference test: habituation, P = 0.379; test 1, P = 0.781; test 2, P = 0.415, Mann Whitney test. (G) Forced swim test (FST), latency to immobility, P = 0.830, Mann Whitney test. (H) FST, time spent immobile, P = 0.147, Mann Whitney test. (I) Tail suspension test (TST), latency to immobility, *P = 0.039, Mann Whitney test. (J) TST, time spent immobile, ****P < 0.0001, Mann Whitney test. (K) Fear conditioning test, average motion, training, P = 0.296; test 1, P = 0.428; test 2, *P = 0.028, Mann Whitney test. (L) Total freezing time, training, P = 0.771; test 1, P = 0.258; test 2, *P = 0.018, Mann Whitney test. Data are shown as the mean ± SEM n ≥ 16 for Tfap2a+/+, n ≥ 15 for Tfap2a+/−.
Figure 8
Figure 8
Behavioral phenotyping of Tfap2b+/− mice reveals signs of mild depressive-like symptoms. (A) Elevated plus maze, P = 0.463, Mann Whitney test. (B) Rotarod test, two-way ANOVA test, the main effect of genotype: F(1, 136) = 1.313, P = 0.254; the main effect of time, F(3, 136) = 0.249, P = 0.862. (C) Morris water maze (MWM), time spent searching for visible platform during two consecutive training days: to compare mutants and their controls, unpaired Student t-test was used for day 1, P = 0.908; Mann-Whitney U-test for day 2, P = 0.557. Wilcoxon two-sided signed-rank tests for two related samples were used for day 1 and day 2 within each genotype: Tfap2b+/+, *P = 0.028; Tfap2b+/−, P = 0.091. (D) MWM, time spent searching for hidden platform during eight consecutive training days, Two-way ANOVA tests, the main effect of genotype: F(1, 148) = 63.40, P < 0.0001; the main effect of time, F(7, 148) = 0.377, P = 0.915; Sidak’s pairwise comparison between genotype,*P < 0.05,**P < 0.01. (E) MWM, time spent in each quadrant during probe test, one-way ANOVA followed by Sidak’s pairwise comparison, F = 7.381, P < 0.0001. Tfap2b+/+ vs. Tfap2b+/−: target, P = 1.000; right, $P = 0.034; left, P = 0.141; opposite, P = 1.000. Target vs. right/left/opposite quadrant in Tfap2b+/+: *P = 0.034, P = 0.141, ****P < 0.0001. Target vs. right/left/opposite in Tfap2b+/−: P = 1.000, P = 0.950, ###P = 0.009. (F) Sucrose preference test, habituation, P = 0.465; test 1, P = 0.372; test 2, P = 0.961, Mann Whitney test. (G) Forced swim test (FST), latency to immobility, *P = 0.039, Mann-Whitney test. (H) FST, time spent immobile, *P = 0.020, Mann-Whitney test. (I) Tail suspension test, latency to immobility, P = 0.231, Mann-Whitney test. (J) Tail suspension test, time spent immobile, P = 0.087, Mann-Whitney test. (K) Fear conditioning test, average motion, training, P = 0.815; test 1, P = 0.673; test 2, *P = 0.047, Mann Whitney test. (L) Fear conditioning test, total freezing time, training, P = 0.696; test 1, P = 0.152; test 2, *P = 0.027. Mann Whitney test. All data are shown as the mean ± SEM n ≥ 10 for Tfap2b+/+, n ≥ 11 for Tfap2b+/−.
Figure 9
Figure 9
Circadian rhythms are comparable to wild-type controls in Tfap2a+/− mice. (A) Daily activity, two-way ANOVA tests followed by Sidak’s pairwise comparison, the main effect of genotype: F(1, 432) = 1.133, P = 0.288; the main effect of time, F(47, 432) = 21.64, P < 0.0001. (B) Total activity, P = 0.931, Mann-Whitney test. (C) Activity in light phase, P = 0.784, Mann-Whitney test. (D) Six hours phase advance, Two-way ANOVA tests followed by Sidak’s pairwise comparison, the main effect of genotype: F(1, 126) = 0.169, P = 0.682; the main effect of time, F(13, 126) = 156.8, P < 0.0001. (E) Phase shift, P = 0.197, Mann-Whitney test. (F) Locomotor activity during light pulse, P = 0.455, Mann-Whitney test. (G) Free-running period during constant darkness, P = 0.626, Mann-Whitney test. All data are shown as the mean ± SEM n = 6 for Tfap2a+/+, n = 5 for Tfap2a+/−.
Figure 10
Figure 10
Circadian period is shortened and jetlag re-entrainment is accelerated in Tfap2b+/− mice. (A) Daily activity, two-way ANOVA test followed by Sidak’s pairwise comparison, the main effect of genotype: F(1, 480) = 13.12, ***P = 0.0003; the main effect of time, F(47, 480) = 65.66, P < 0.0001. (B) Total activity, P = 0.310, Mann-Whitney test. (C) Activity in light phase, P = 0.558, Mann-Whitney test. (D) Six hours phase advance two-way ANOVA test followed by Sidak’s pairwise comparison, the main effect of genotype, F(1, 160) = 24.82, ****P < 0.0001; the main effect of time, F(15, 160) = 161.1, P < 0.0001; 50% phase shift (PS50): two-tailed unpaired t-test, *P = 0.0273. (E) Phase shift, P = 0.452, Mann-Whitney test. (F) Locomotor activity during light pulse, P = 0.558, Mann-Whitney test. (G) Free-running period during constant darkness, *P = 0.022, Mann-Whitney test. All data are shown as the mean ± SEM n = 6 for Tfap2b+/+, n = 6 for Tfap2b+/−.
Figure 11
Figure 11
Divergent gene expression changes in Tfap2a+/− and Tfap2b+/−. (A) Volcano plot of genes that are differentially expressed in Tfap2a+/− mice. (B) Volcano plot of genes that are differentially expressed in Tfap2b+/− mice. (C) Venn diagram showing distinct and overlapping genes that are differentially expressed [false discovery rate (FDR) < 0.20] in Tfap2a+/− and Tfap2b+/−. The overlapping P value was calculated using Fischer’s Exact tests, P = 0.005. n = 3 for B6N, n = 3 for Tfap2a+/−, n = 3 for Tfap2b+/−. Genes that are differentially expressed at FDR < 0.20 and logFC > 0.5 are highlighted and labeled in the volcano plot.

References

    1. Alkhlaif Y., Bagdas D., Jackson A., Park A. J., and Damaj I. M., 2017. Assessment of nicotine withdrawal-induced changes in sucrose preference in mice. Pharmacol. Biochem. Behav. 161: 47–52. 10.1016/j.pbb.2017.08.013 - DOI - PMC - PubMed
    1. Bernard K., Logsdon N. J., Ravi S., Xie N., Persons B. P. et al. , 2015. Metabolic reprogramming is required for myofibroblast contractility and differentiation. J. Biol. Chem. 290: 25427–25438. 10.1074/jbc.M115.646984 - DOI - PMC - PubMed
    1. Bezdicek O., Nikolai T., Nepozitek J., Perinova P., Kemlink D. et al. , 2018. Prospective memory impairment in idiopathic REM sleep behavior disorder. Clin. Neuropsychol. 32: 1019–1037. 10.1080/13854046.2017.1394493 - DOI - PubMed
    1. Bozdagi O., Rich E., Tronel S., Sadahiro M., Patterson K. et al. , 2008. The neurotrophin-inducible gene Vgf regulates hippocampal function and behavior through a brain-derived neurotrophic factor-dependent mechanism. J. Neurosci. 28: 9857–9869. 10.1523/JNEUROSCI.3145-08.2008 - DOI - PMC - PubMed
    1. Brewer S., Feng W., Huang J., Sullivan S., and Williams T., 2004. Wnt1-Cre-mediated deletion of AP-2alpha causes multiple neural crest-related defects. Dev. Biol. 267: 135–152. 10.1016/j.ydbio.2003.10.039 - DOI - PubMed

Publication types