Longitudinal Assessment of the Dynamics of Escherichia coli, Total Coliforms, Enterococcus spp., and Aeromonas spp. in Alternative Irrigation Water Sources: a CONSERVE Study
- PMID: 32769196
- PMCID: PMC7531960
- DOI: 10.1128/AEM.00342-20
Longitudinal Assessment of the Dynamics of Escherichia coli, Total Coliforms, Enterococcus spp., and Aeromonas spp. in Alternative Irrigation Water Sources: a CONSERVE Study
Abstract
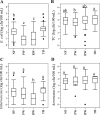
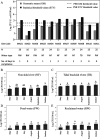
As climate change continues to stress freshwater resources, we have a pressing need to identify alternative (nontraditional) sources of microbially safe water for irrigation of fresh produce. This study is part of the center CONSERVE, which aims to facilitate the adoption of adequate agricultural water sources. A 26-month longitudinal study was conducted at 11 sites to assess the prevalence of bacteria indicating water quality, fecal contamination, and crop contamination risk (Escherichia coli, total coliforms [TC], Enterococcus, and Aeromonas). Sites included nontidal freshwater rivers/creeks (NF), a tidal brackish river (TB), irrigation ponds (PW), and reclaimed water sites (RW). Water samples were filtered for bacterial quantification. E. coli, TC, enterococci (∼86%, 98%, and 90% positive, respectively; n = 333), and Aeromonas (∼98% positive; n = 133) were widespread in water samples tested. Highest E. coli counts were in rivers, TC counts in TB, and enterococci in rivers and ponds (P < 0.001 in all cases) compared to other water types. Aeromonas counts were consistent across sites. Seasonal dynamics were detected in NF and PW samples only. E. coli counts were higher in the vegetable crop-growing (May-October) than nongrowing (November-April) season in all water types (P < 0.05). Only one RW and both PW sites met the U.S. Food Safety Modernization Act water standards. However, implementation of recommended mitigation measures of allowing time for microbial die-off between irrigation and harvest would bring all other sites into compliance within 2 days. This study provides comprehensive microbial data on alternative irrigation water and serves as an important resource for food safety planning and policy setting.IMPORTANCE Increasing demands for fresh fruit and vegetables, a variable climate affecting agricultural water availability, and microbial food safety goals are pressing the need to identify new, safe, alternative sources of irrigation water. Our study generated microbial data collected over a 2-year period from potential sources of irrigation (rivers, ponds, and reclaimed water sites). Pond water was found to comply with Food Safety Modernization Act (FSMA) microbial standards for irrigation of fruit and vegetables. Bacterial counts in reclaimed water, a resource that is not universally allowed on fresh produce in the United States, generally met microbial standards or needed minimal mitigation. We detected the most seasonality and the highest microbial loads in river water, which emerged as the water type that would require the most mitigation to be compliant with established FSMA standards. This data set represents one of the most comprehensive, longitudinal analyses of alternative irrigation water sources in the United States.
Keywords: Aeromonas; Food Safety Modernization Act; fecal indicators; food safety; irrigation water; irrigation water physicochemical parameters.
Copyright © 2020 American Society for Microbiology.
Figures


References
-
- UNESCO-WWAP. 2012. Facts and figures from the United Nations world water development report 4: managing water under uncertainty and risk. SC.2013/WS/13. United Nations Educational, Scientific and Cultural Organization (UNESCO), World Water Assessment Programme (WWAP), New York, NY: https://unesdoc.unesco.org/ark:/48223/pf0000215492.
-
- Dieter CA, Maupin MA, Caldwell RR, Harris MA, Ivahnenko TI, Lovelace JK, Barber NL, Linsey KS. 2018. Estimated use of water in the United States in 2015. USGS Circ 1441:65. doi: 10.3133/cir1441. - DOI
-
- Walthall CL, Hatfield J, Backlund P, Lengnick L, Marshall E, Walsh M, Adkins S, Aillery M, Ainsworth EA, Ammann C, Anderson CJ, Bartomeus I, Baumgard LH, Booker F, Bradley B, Blumenthal DM, Bunce J, Burkey K, Dabney SM, Delgado JA, Dukes J, Funk A, Garrett K, Glenn M, Grantz DA, Goodrich D, Hu S, Izaurralde RC, Jones RAC, Kim S-H, Leaky ADB, Lewers K, Mader TL, McClung A, Morgan J, Muth DJ, Nearing M, Oosterhuis DM, Ort D, Parmesan C, Pettigrew WT, Polley W, Rader R, Rice C, Rivington M, Rosskopf E, Salas WA, Sollenberger LE, Srygley R, Stöckle C, Takle ES, Timlin D, White JW, Winfree R, Wright-Morton L, Ziska LH. 2012. Climate change and agriculture in the United States: effects and adaptation. USDA technical bulletin 1935 USDA, Washington, DC.
-
- Ebi KL, Bowen K. 2016. Extreme events as sources of health vulnerability: drought as an example. Weather Climate Extremes 11:95–102. doi: 10.1016/j.wace.2015.10.001. - DOI
Publication types
MeSH terms
LinkOut - more resources
Full Text Sources
Research Materials
Miscellaneous

