. 2020 Aug 7;11(1):3953.
doi: 10.1038/s41467-020-17740-1.

Single-cell analysis uncovers fibroblast heterogeneity and criteria for fibroblast and mural cell identification and discrimination

Affiliations

Single-cell analysis uncovers fibroblast heterogeneity and criteria for fibroblast and mural cell identification and discrimination

Lars Muhl et al. Nat Commun. .

Erratum in

Abstract

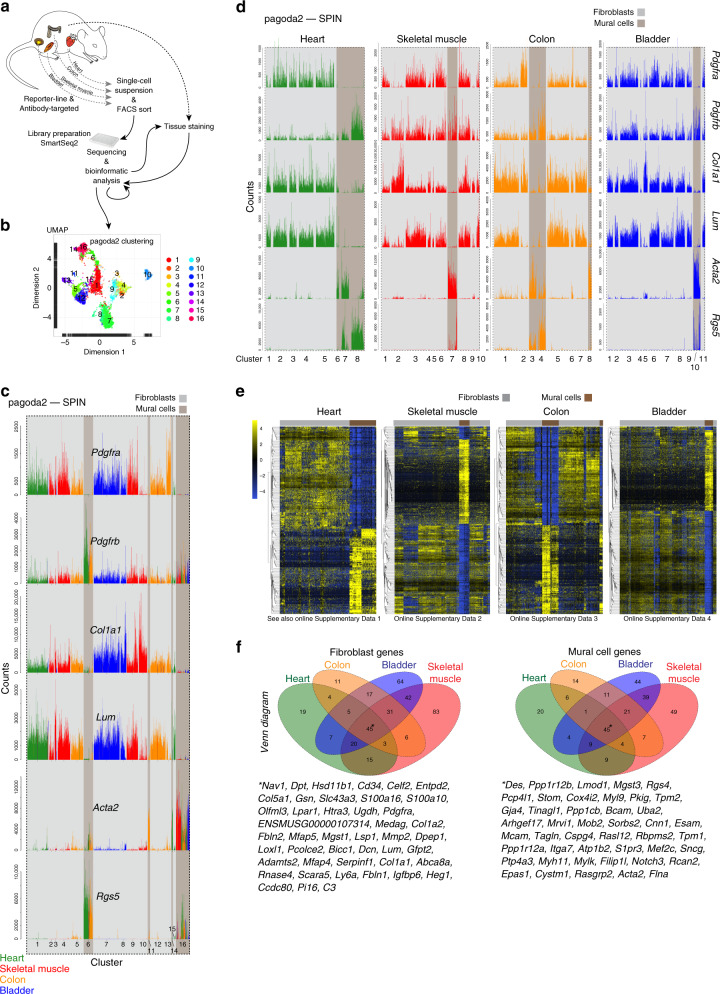
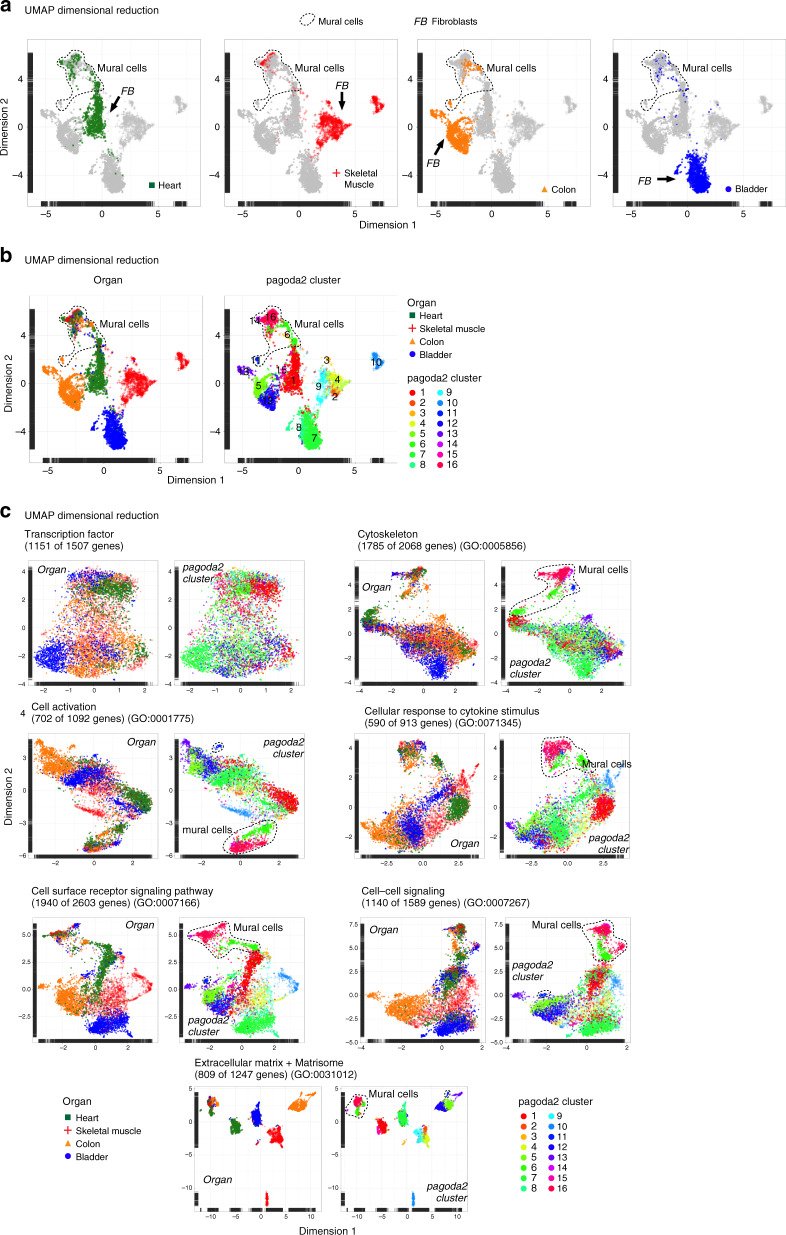
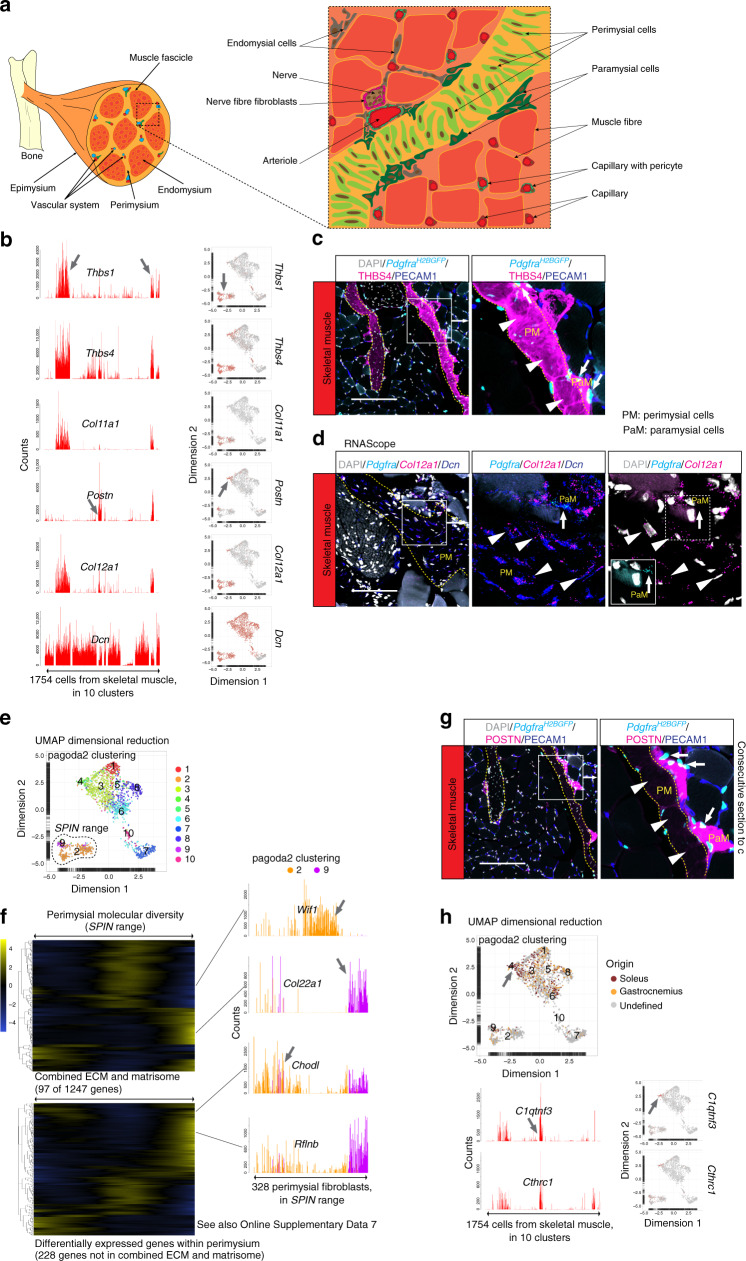
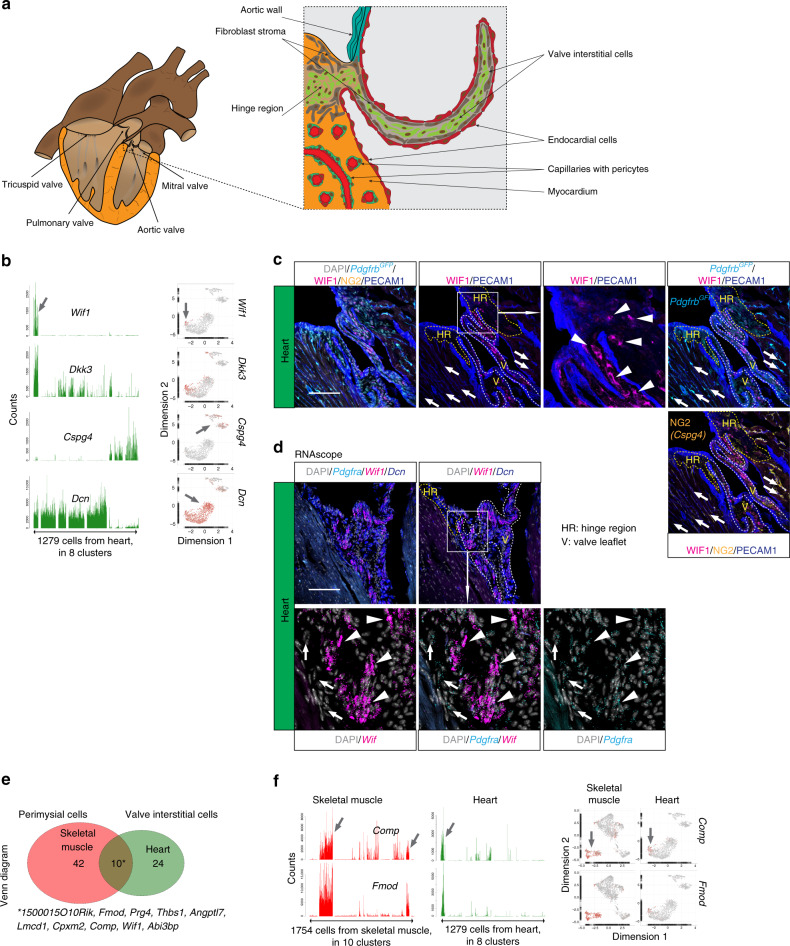
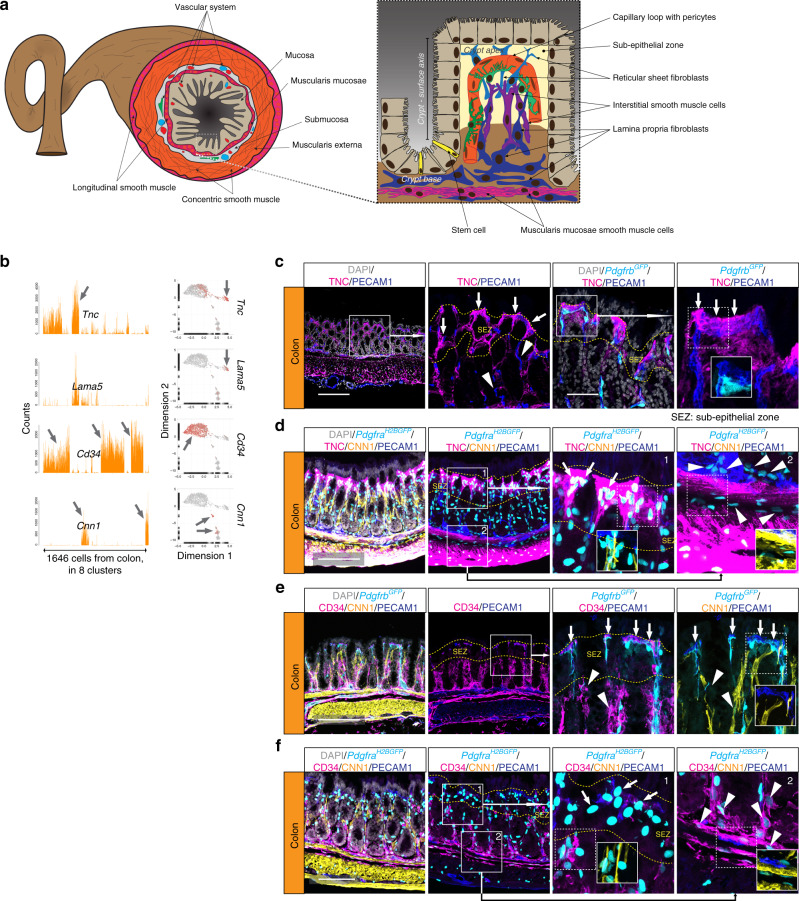
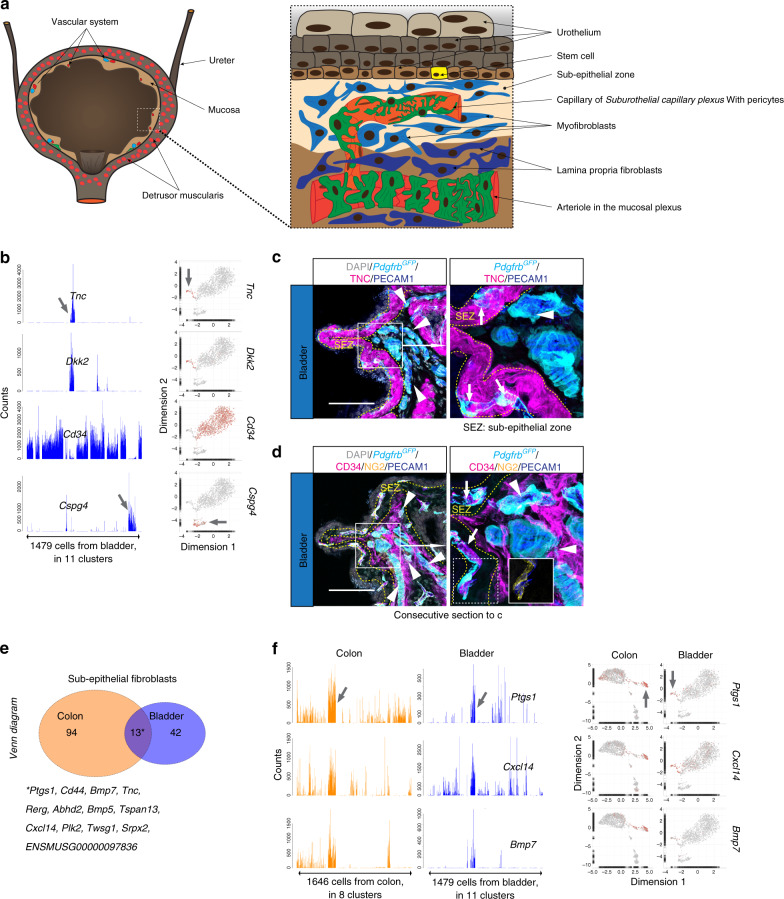
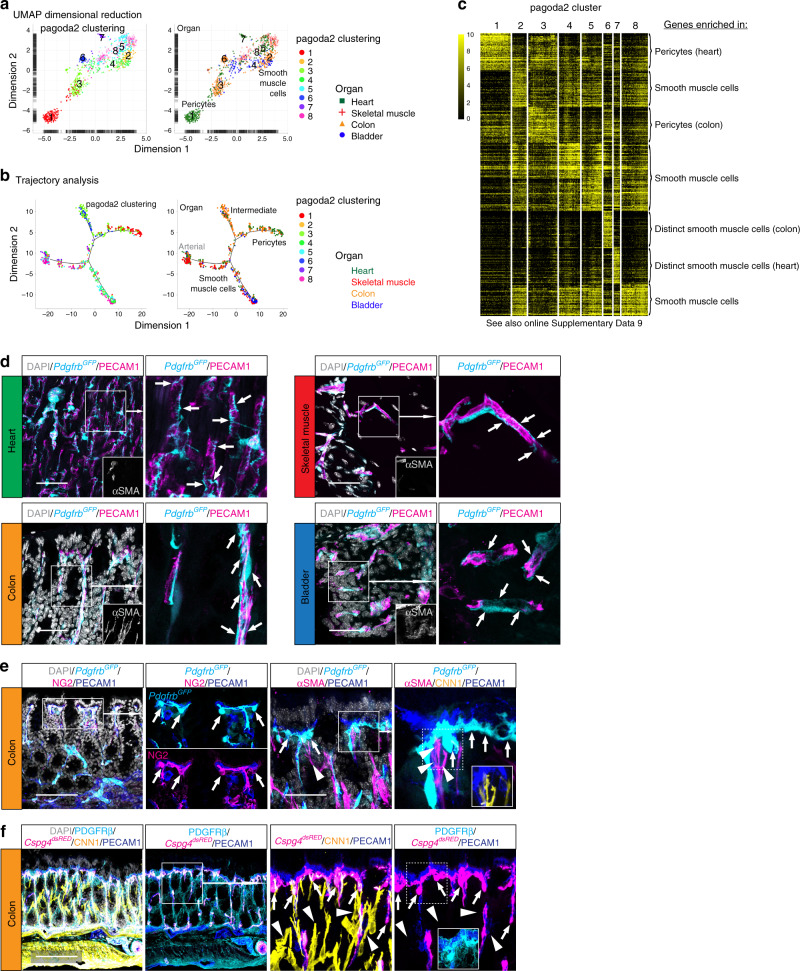
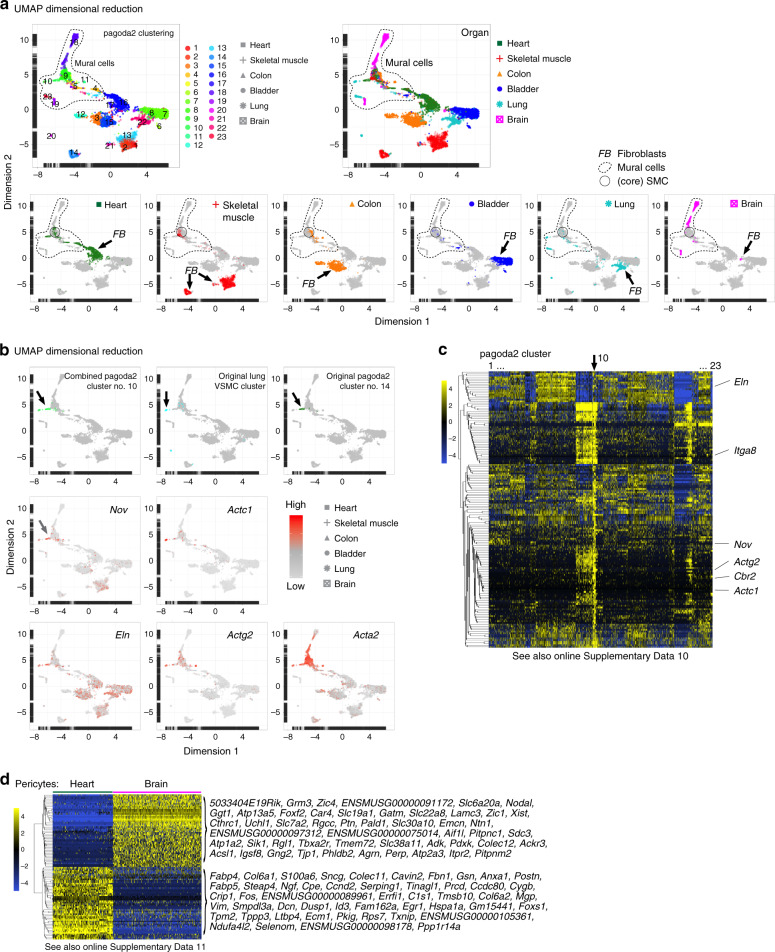
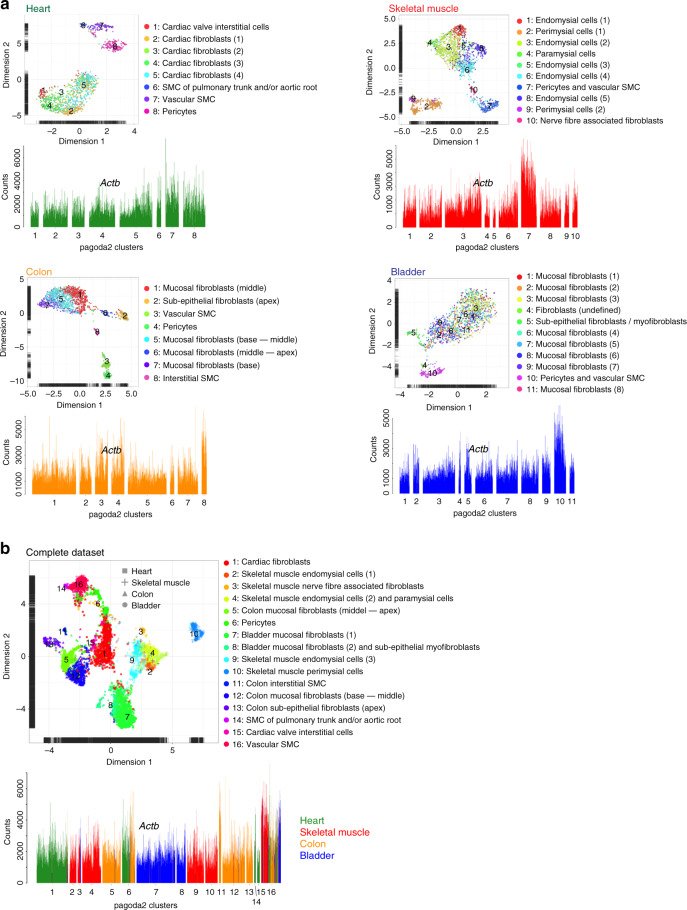
Many important cell types in adult vertebrates have a mesenchymal origin, including fibroblasts and vascular mural cells. Although their biological importance is undisputed, the level of mesenchymal cell heterogeneity within and between organs, while appreciated, has not been analyzed in detail. Here, we compare single-cell transcriptional profiles of fibroblasts and vascular mural cells across four murine muscular organs: heart, skeletal muscle, intestine and bladder. We reveal gene expression signatures that demarcate fibroblasts from mural cells and provide molecular signatures for cell subtype identification. We observe striking inter- and intra-organ heterogeneity amongst the fibroblasts, primarily reflecting differences in the expression of extracellular matrix components. Fibroblast subtypes localize to discrete anatomical positions offering novel predictions about physiological function(s) and regulatory signaling circuits. Our data shed new light on the diversity of poorly defined classes of cells and provide a foundation for improved understanding of their roles in physiological and pathological processes.


Conflict of interest statement

X.-R.P. is an employee of AstraZeneca, C.B. is a consultant for AstraZeneca. The remaining authors declare no competing interests.

Figures

Fig. 1
Fig. 1. Outline and cell archetype identification.
a Study outline. b Pagoda2 clustering of the complete dataset (16 clusters) superimposed onto a UMAP dimensional reduction visualization. c Bar plots showing the expression of canonical fibroblast and mural cell markers in individual cells (bars) of the 16 pagoda2 clusters, the cell order in each cluster determined by SPIN. d Same data as in c but with pagoda2 clusters assigned and cells SPIN-ranged in each organ separately (see Supplementary Fig. 2a for corresponding UMAPs). e Expression heat maps (blue, low; yellow, high) showing the most differentially expressed genes between fibroblasts and mural cells in each respective organ dataset (for zoomable images, see Online Supplementary Datas 1–4). f Venn diagrams of differential expressed genes within the respective organ. Middle/asterisk: list of markers common for the four organs (see also Supplementary Table 1).
Fig. 2
Fig. 2. Cell dispersion criteria.
a UMAP visualization of the complete dataset, color coded for th respective organ of origin, separately. Cell clouds containing mural cells or fibroblasts are indicated. b UMAP visualization color coded for the organ of origin or pagoda2 clustering result. c UMAP visualization using restricted gene-sets color coded for the organ of origin combined, or pagoda2 clustering result. Cell clouds containing mural cells are indicated (see also Supplementary Data 2).
Fig. 3
Fig. 3. Fibroblast subtypes of the skeletal muscle.
a Schematic depiction of skeletal muscle anatomy. b Bar plots and UMAP visualization (gray, low; red, high expression) showing examples of genes with cell subtype-specific expression (arrow). c Immunofluorescence staining of skeletal muscle from PdgfraH2BGFP reporter line for THBS4 and PECAM1. d RNAscope staining for Pdgfra, Col12a1, and Dcn. e UMAP visualization with pagoda2 clusters annotated and indication of cells specifically analyzed with SPIN. f Expression heat map (loess smoothed (locally weighted scatterplot smoothing) values; blue, low; yellow high) of 97 genes in the ECM + matrisome gene-set (upper) and 228 additional genes (lower) of the perimysial cells SPIN range (see also Online Supplementary Data 7). Bar plots showing examples of perimysial differentially expressed genes (arrows; Wif1, Col22a1, Chodl, and Rflnb) color coded based on pagoda2 clustering (# 2, 9). g Immunofluorescence staining of skeletal muscle from PdgfraH2BGFP reporter line for POSTN and PECAM1 (consecutive section to c). Arrowheads: perimysial cells (PM); arrows: paramysial cells (PaM). h UMAP visualization, color coded for cellular origin according to muscle subtype (M. soleus, M. gastrocnemius or undefined), and pagoda2 clusters annotated. Arrow indicates pagoda2 cluster 4, which is enriched in cells specifically captured from soleus muscle (upper panel). Bar plots and UMAP showing examples of cluster four enriched genes (arrows; C1qtnf3 and Cthrc1). Scale bar: c, g 200 µm, d 100 µm.
Fig. 4
Fig. 4. Fibroblast subtypes of the heart.
a Schematic depiction of heart anatomy. b Bar plots and UMAP visualization (gray, low; red, high expression) showing examples of cell subtype-specific expression (arrow). c Immunofluorescence staining of heart from the PdgfrbGFP reporter line for WIF1, NG2, and PECAM1, focused on the cardiac valve and hinge region. d RNAscope staining for Pdgfra, Wif1, and Dcn, focused on the cardiac valve region. Arrowheads: valve interstitial cells; arrows: pericytes; HR: hinge region, V: valve leaflet. Scale bar: 100 µm. e Venn diagram showing skeletal muscle perimysial- and heart valve interstitial cell co-enriched genes. f Examples of co-enriched genes presented as bar plots and UMAP (gray, low; red, high expression). Asterisk: gene list of commonly enriched genes (see also Supplementary Table 2).
Fig. 5
Fig. 5. Fibroblast subtypes in the colon.
a Schematic depiction of colon anatomy. b Bar plots and UMAP visualization (gray, low; red, high expression) showing examples of genes with cell subtype-specific expression (arrow). cf Immunofluorescence staining of colon samples from reporter lines PdgfrbGFP (c, e) and PdgfraH2bGFP (d, f) for indicated markers; c, d TNC+ cells close to the crypt apex surface (arrows); e, f CD34+ cells at the crypt base (arrowheads); d, fPdgfra+ cells close to the crypt apex surface, negative for CD34 or CNN1 (arrows). Arrowheads: Pdgfra+ CD34+ cells at crypt base and muscularis mucosae, negative for CNN1. Scale bar: c, e 200 µm, d, f 100 µm.
Fig. 6
Fig. 6. Fibroblast subtypes in the bladder.
a Schematic depiction of bladder anatomy. b Bar plots and UMAP visualization (gray, low; red, high expression) showing examples of genes with cell subtype-specific expression (arrows). c, d Immunofluorescence staining of bladder samples from PdgfrbGFP reporter line for c TNC, or d CD34, NG2, and PECAM1. Arrows: capillaries of the subepithelial zone, surrounded by TNC+ fibroblasts, arrowheads: large perpendicular vessels in deeper mucosa, surrounded by CD34+ fibroblasts. Scale bar: 100 µm. Consecutive sections were used for c and d. e Venn diagram of Tnc+Cd34 (subepithelial fibroblasts) enriched genes from colon and bladder. f Examples of commonly subepithelial fibroblast enriched genes presented as bar plots and UMAP (gray, low; red, high expression). Asterisk: gene list of commonly enriched genes (see also Supplementary Table 3).
Fig. 7
Fig. 7. Mural cell organotypicity.
a UMAP visualization of the mural cell dataset, color coded and annotated for pagoda2 clustering (left) or color coded for organ of origin and annotated for pagoda2 clustering (right). b Trajectory analysis plots of the mural dataset color coded for pagoda2 clusters (left) or organ of origin (right). c Expression heat map (black, low; yellow, high) of cluster enriched genes (see also Online Supplementary Data 9). d Samples from all four organs from the PdgfrbGFP reporter line, stained with immunofluorescence for αSMA and PECAM1. Arrows highlight pericytes and their morphological distribution at the organ-specific capillaries. Scale bars: 50 µm. e Immunofluorescence staining of colon samples from PdgfrbGFP reporter line for NG2 (Cspg4) and PECAM1 (left panel), or αSMA, CNN1 and PECAM1 (right panel). f Immunofluorescence staining of colon samples from Cspg4dsRED reporter line for PDGFRβ, CNN1 and PECAM1. Arrows highlight colon pericytes located at the subepithelial capillary loop, arrowheads indicate αSMA+ CNN1+, but Cspg4 (NG2) interstitial SMC. Scale bars: e 100 µm (left panel f), 50 µm (e right panel).
Fig. 8
Fig. 8. Heterogeneity analysis in additional organs.
a UMAP visualization of the combined analysis of the heart, skeletal muscle, colon, and bladder together with the mesenchymal cells of the brain and lung datasets, color coded for pagoda2 clusters (upper left) or the organ of origin (upper right). Cell clouds containing mural cells and core SMC are indicated (lower panel). b UMAP visualization highlighting cells of pagoda2 cluster 10 (upper left), cells of the lung VSMC cluster (upper middle), cells of the original complete dataset cluster 14 (upper right), or expression levels of cluster 10 of the combined analysis enriched genes (Nov, Actc1, Eln, and Actg2) as well as Acta2 (gray, low; red, high). c Expression heat map (blue, low; yellow, high) of enriched genes in cluster 10 of the combined analysis (see also Online Supplementary Data 10). d Expression heat map (blue, low; yellow, high) of each 50 most differentially expressed genes in heart vs. brain pericytes (see also Online Supplementary Data 11).
Fig. 9
Fig. 9. Cell annotation summary.
a UMAP visualization with pagoda2 cluster annotation and bar plots showing Actb expression of organ specific datasets. b UMAP visualization with pagoda2 cluster annotation and bar plot showing Actb expression with organ of origin color coded in the complete dataset.

References

    1. Virchow, R. Die Cellularpathologie in Ihrer Begruendung auf Physiologische und Pathologische Gewebelehre (August Hirschwald, Berlin, 1858).
    1. Duvall, M. Atlas d’Embryologie (Masson, France, 1879).
    1. Kalluri R. The biology and function of fibroblasts in cancer. Nat. Rev. Cancer. 2016;16:582–598. - PubMed
    1. Lynch MD, Watt FM. Fibroblast heterogeneity: implications for human disease. J. Clin. Investig. 2018;128:26–35. - PMC - PubMed
    1. Hinz B. Myofibroblasts. Exp. Eye Res. 2016;142:56–70. - PubMed

Publication types

MeSH terms