. 2020 Aug 7;11(1):3944.
doi: 10.1038/s41467-020-17585-8.

Triacylglycerols sequester monotopic membrane proteins to lipid droplets

Affiliations

Triacylglycerols sequester monotopic membrane proteins to lipid droplets

Lucie Caillon et al. Nat Commun. .

Abstract

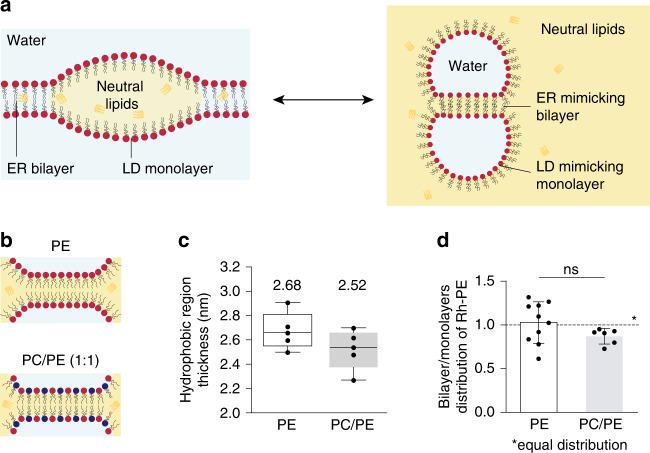
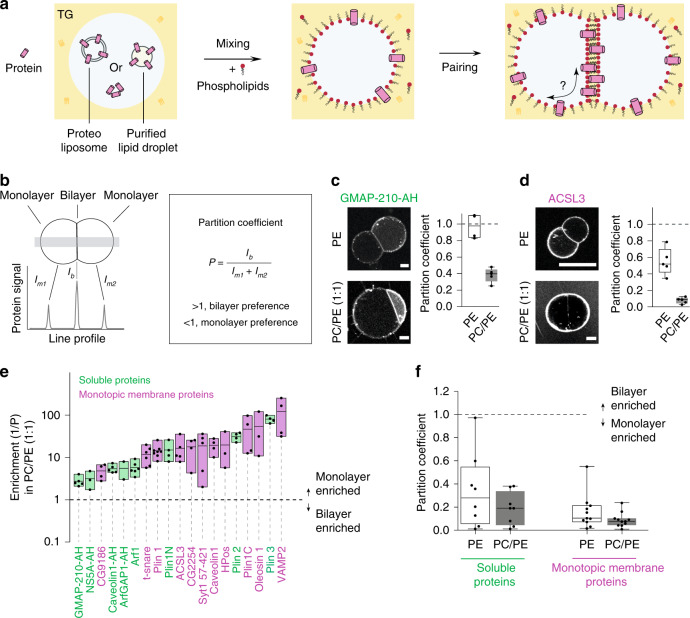
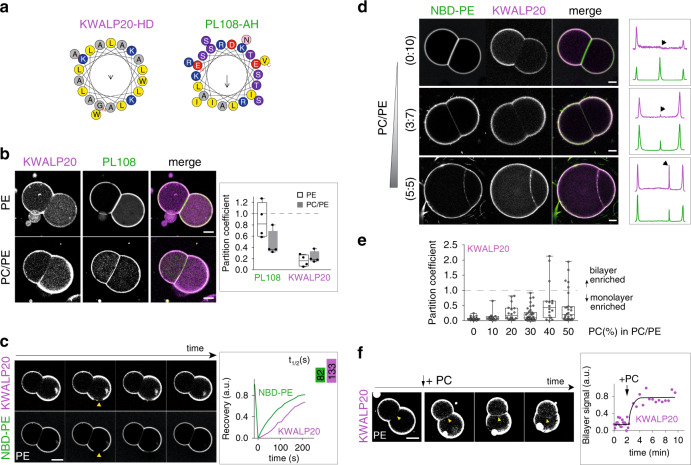
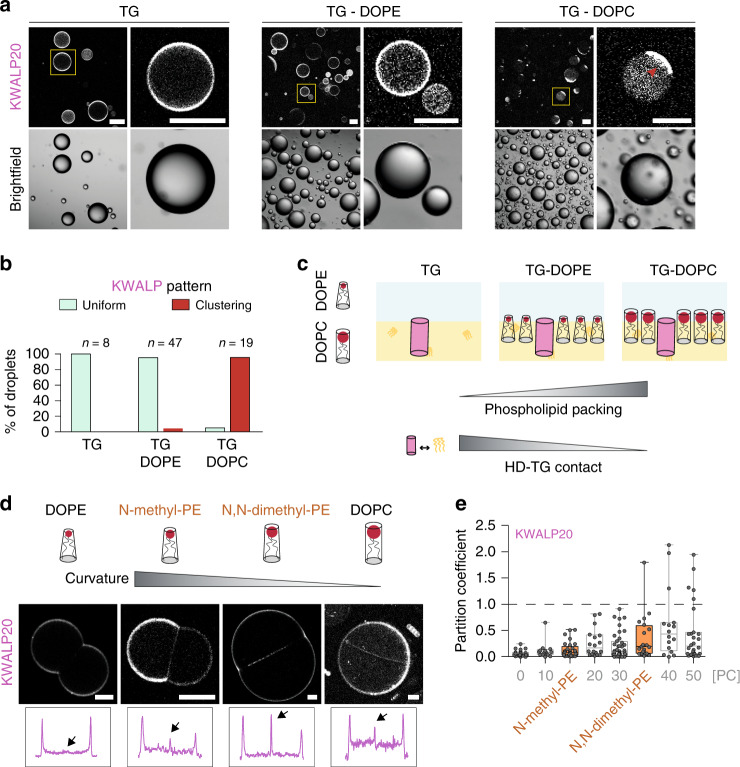
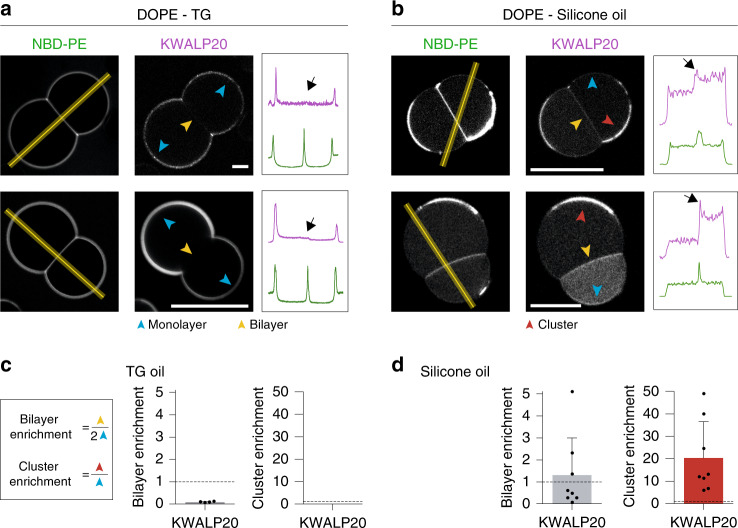
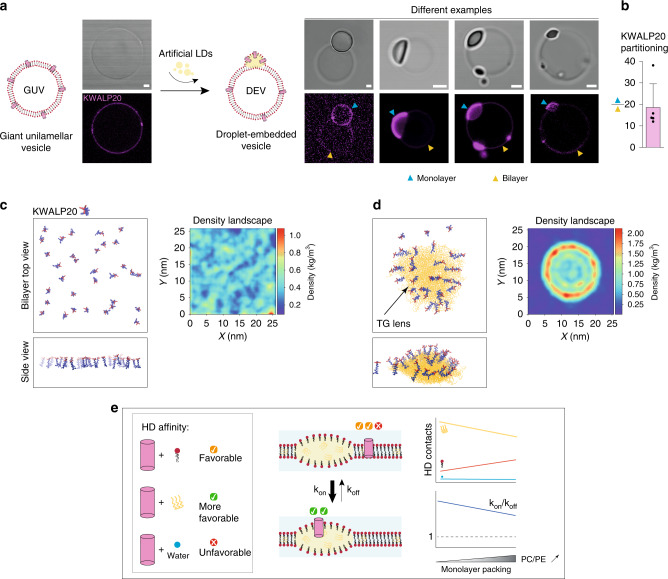
Triacylglycerols (TG) are synthesized at the endoplasmic reticulum (ER) bilayer and packaged into organelles called lipid droplets (LDs). LDs are covered by a single phospholipid monolayer contiguous with the ER bilayer. This connection is used by several monotopic integral membrane proteins, with hydrophobic membrane association domains (HDs), to diffuse between the organelles. However, how proteins partition between ER and LDs is not understood. Here, we employed synthetic model systems and found that HD-containing proteins strongly prefer monolayers and returning to the bilayer is unfavorable. This preference for monolayers is due to a higher affinity of HDs for TG over membrane phospholipids. Protein distribution is regulated by PC/PE ratio via alterations in monolayer packing and HD-TG interaction. Thus, HD-containing proteins appear to non-specifically accumulate to the LD surface. In cells, protein editing mechanisms at the ER membrane would be necessary to prevent unspecific relocation of HD-containing proteins to LDs.


Conflict of interest statement

The authors declare no competing interests.

Figures

Fig. 1
Fig. 1. Characterization of droplet interface bilayers.
a Schematic representation of the ER phospholipid bilayer contiguous with the monolayer of a nascent LD (left side); the corresponding DIB system reproducing contiguous bilayer and monolayers is shown on the right side. The water phase is represented in light blue and the oil phase in yellow (neutral lipid, e.g. triglycerides (TG)). b Drawings of a DIB bilayer of DOPE (top) and DOPC/DOPE (1:1) (bottom). c The thickness of the hydrophobic region of the DIB bilayer in DOPE (white) and DOPC/DOPE (1:1) (gray) is determined by capacitance measurement. Results are shown as box-plots (box limits, upper and lower quartiles; middle line, median; whiskers, minimum and maximum value; the mean is indicated) from n = 5 independent experiments. Each point is represented as a black dot. d Distribution of Rh-PE between the bilayer and the monolayers in DOPE (white) and DOPC/DOPE (1:1) (gray) DIBs. The results are the mean ± SD of respectively n = 10 and n = 5 independent measurements. Each point is represented as a black dot. Significance was determined by Welch’s t-test (unpaired parametric test, two-tailed p-value) and is indicated by ns (not significant): p > 0.05. Source data are provided as a Source Data file.
Fig. 2
Fig. 2. Partitioning of hydrophobic and amphipathic helix-containing proteins to droplet interface bilayers.
a Formation of protein-containing DIBs: soluble protein, proteoliposome, or purified LDs are added to the buffer droplet (left). Mixing the droplet in a TG-containing phospholipids solution allows the relocalization of proteins to the buffer droplet interface (middle). When two drops come close together, their monolayers zip to form a bilayer. The proteins are thus offered to relocalize to the bilayer (right). b Protein distribution between the bilayer and the monolayer is determined by the partition coefficient P, which is the protein signal at the bilayer divided by sum of its signals at the monolayers. When a protein partitions preferentially to the bilayer, p > 1; if preference is for the monolayer then p < 1. c, d Distribution of GMAP-210-AH (soluble protein) and ACSL3 (monotopic membrane protein) respectively, in DOPE or DOPC/DOPE (1:1) DIBs. Scale bar: 20 µm. The partition coefficient is represented for each condition as box-plots from n = 5 independent measurements (excepted for GMAP-210-AH in PE, n = 4). e Enrichment parameter in DOPC/DOPE (1:1) membranes for AH- (green) and HD- (pink) containing proteins, shown as floating bars (bar limits, min to max values; central line, mean), 2 ≤ n ≤ 8 independent measurements were done for each protein. HD-containing proteins coming from LDs are Plin 1, Plin 1C, ACSL3, CG2254, CG9186, Oleosin 1, Caveolin 1, HPos; those coming from proteoliposomes are Syt1 57-421, t-snare, Vamp2; AH-containing proteins coming from LDs are Plin3, Plin2, Plin1N; the other AHs are added soluble. f Average partition coefficient of the groups of soluble or monotopic membrane proteins in DOPE or DOPC/DOPE (1:1). Results presented in (Supplementary Fig. S2e) were used to generate (f). Box-plots are defined as follow: box limits, upper and lower quartiles; middle line, median; whiskers, minimum and maximum value. In c, d, e, f each point is represented as a black dot. Source data are provided as a Source Data file.
Fig. 3
Fig. 3. PC/PE ratio modulates the partitioning of model AH and HD peptides.
a Helical wheel representation of KWALP20 and PL108-AH, generated from HeliQuest. b Distribution of KWALP20 and PL108 in DOPE or DOPC/DOPE (1:1) DIBs. KWALP20 is labeled with and PL108 with NBD. Scale bar: 50 µm. The partition coefficient is plotted for both peptides as box-plots (box limits, upper and lower quartiles; middle line, median; whiskers, minimum and maximum value), from n = 4 independent measurements for each condition. Individual data are shown as black dots. c FRAP experiment shows that KWALP20 (purple) and lipid (green) signals are mobile at the monolayer. NBD-PE reports for phospholipids. Yellow arrows indicate the area bleached. Scale bar: 50 µm. Recovery half-time was obtained using one-phase association fitting in GraphPad software and is shown in the upper right box. d KWALP20 distribution in DIBs of different PC/PE ratio. Line profiles (not displayed) are drawn perpendicular to the bilayer and monolayers (as described in Fig. 2b); the thickness of the line is 30-40% of the bilayer size. The corresponding signals are shown in the box (right); black arrows depict the bilayer signal. Scale bar: 20 µm. e Partition coefficient of KWALP20 in DIBs of different DOPC/DOPE ratios represented as box-plots (box limits, upper and lower quartiles; middle line, median; whiskers, minimum and maximum value). Sample size was n = 31 for 0% PC, n = 14 for 10% PC, n = 18 for 20% PC, n = 41 for 30% PC, n = 16 for 40% PC and n = 28 for 50% PC. Each data point is plotted. f Relocalization of KWALP20 from the monolayer to the bilayer after addition of DOPC to DOPE DIBs. The bilayer signal is plotted over time. Image brightness is enhanced to improve bilayer viewing. Scale bar: 50 µm. Source data are provided as a Source Data file.
Fig. 4
Fig. 4. The partitioning of KWALP is altered by phospholipid shape.
a KWALP20 surface distribution in bare TG-buffer droplets or in TG-buffer droplets covered by DOPE or DOPC. Red arrow highlights peptide clustering (in DOPC condition). The yellow square regions are enlarged on the right side of each image. Scale bar: 100 µm. b Quantification of KWALP pattern, i.e., uniform (light green) or clustering (red) signal, in TG (n = 8), TG + DOPE (n = 47) and TG + DOPC (n = 19), from n independent measurements. c Schematic representation of the difference in phospholipid packing, and thus in HD-TG contact, when DOPE (cone shape) or DOPC (cylinder shape) are present. Increasing DOPC concentration in a DOPC/DOPE monolayer increases the lipid packing and decreases the contact between HDs and TG. d Distribution of KWALP20 in DOPE, N-methyl-PE, N,N-dimethyl-PE, and DOPC DIBs. These phospholipids have incremental curvature between that of DOPE and DOPC. KWALP20 is labeled with Rh-B. Line profiles (not displayed) are drawn perpendicular to the bilayer and monolayers (as described in Fig. 2b); the thickness of the line is 30–40% of the bilayer size. Arrows indicate the bilayer signal. Scale bar: 20 µm. e Partition coefficient of KWALP20 in DIBs of different compositions is represented as box-plots (box limits, upper and lower quartiles; middle line, median; whiskers, minimum and maximum value). Sample size is n = 29 and 20 for KWALP20 in N-methyl-PE and N,N-dimethyl-PE respectively. Previous results of varying PC/PE ratios (Fig. 3e) are reported in light gray. Individual data points are indicated. Source data are provided as a Source Data file.
Fig. 5
Fig. 5. The distribution of KWALP HD depends on the oil chemistry.
a, b Distribution of KWALP20 in DOPE DIBs. KWALP20 is labeled with Rh-B. Oil phase is TG (a) or silicone oil (b). Blue arrows indicate the monolayers, yellow ones indicate the bilayer, and red ones indicate cluster areas. Plot profiles are determined using the yellow lines. The bilayer signal is indicated by a black arrow. Scale bar: 20 µm. c, d Partition coefficient is reported in gray in TG (c) and silicone oil (d), as mean ± sd (n = 2 and 8 independent measurements respectively). A cluster enrichment coefficient (red) is determined for the experiment in silicone oil, and is shown as mean ± SD (n = 8 independent measurements). Each data point is shown as a black dot. Source data are provided as a Source Data file.
Fig. 6
Fig. 6. Nascent LDs are attractive to monotopic proteins.
a Formation of DEVs-containing KWALP20 labeled with Rh-B: (left) KWALP20 is inserted in GUVs, during GUV electroformation or by mixing GUVs with the peptide; an example of the resulting KWALP20-interted GUV is shown. (right) KWALP20-containing GUVs are mixed with a TG-in-buffer droplet to generate droplet-embedded vesicles; several examples of the resulting DEVs are displayed: The peptide is labeled with Rh-B. The KWALP signals on the monolayer and the bilayer are respectively depicted by blue and yellow arrows. Strong accumulation happens at the monolayer. Image brightness is enhanced to improve monolayer viewing. Scale bar: 2 µm. b The ratio between monolayer and bilayer signals is plotted as mean ± SD (n = 5 independent measurements). Individual points are indicated. Source data are provided as a Source Data file. c, d Left: snapshot of molecular dynamics simulations of a bilayer with 32 KWALP20 peptides in parallel orientation, in the absence (c) and the presence (d) of a TG lens. Hydrophobic amino-acids are represented in blue and charged ones (lysines) in red. On the right of each simulation is displayed the average protein density profiles in the bilayer plane, averaged over the entire MD simulation (20 μs), in the absence (d) and in the presence (e) of the TG lens. e Basic model of how the different interactions of an HD favor its LD monolayer accumulation. HD interacts with TG, phospholipids or water; the monolayer packing regulates the contact between these species and tunes the reaction constant kon/koff.

References

    1. Olzmann JA, Carvalho P. Dynamics and functions of lipid droplets. Nat. Rev. Mol. Cell Biol. 2019;20:137–155. - PMC - PubMed
    1. Santinho A, et al. Membrane Curvature Catalyzes Lipid Droplet Assembly. Curr. Biol. 2020;30:2481–2494.e6. - PubMed
    1. Choudhary V, Ojha N, Golden A, Prinz WA. A conserved family of proteins facilitates nascent lipid droplet budding from the ER. J. Cell Biol. 2015;211:261–271. - PMC - PubMed
    1. Pol A, Gross SP, Parton RG. Review: biogenesis of the multifunctional lipid droplet: lipids, proteins, and sites. J. Cell Biol. 2014;204:635–646. - PMC - PubMed
    1. Bersuker K, Olzmann JA. Establishing the lipid droplet proteome: Mechanisms of lipid droplet protein targeting and degradation. Biochim. Biophys. Acta Mol. Cell Biol. Lipids. 2017;1862:1166–1177. - PMC - PubMed

Publication types

MeSH terms