. 2020 Aug 7;11(1):3940.
doi: 10.1038/s41467-020-17858-2.

Topoisomerase 1 prevents replication stress at R-loop-enriched transcription termination sites

Affiliations

Topoisomerase 1 prevents replication stress at R-loop-enriched transcription termination sites

Alexy Promonet et al. Nat Commun. .

Abstract

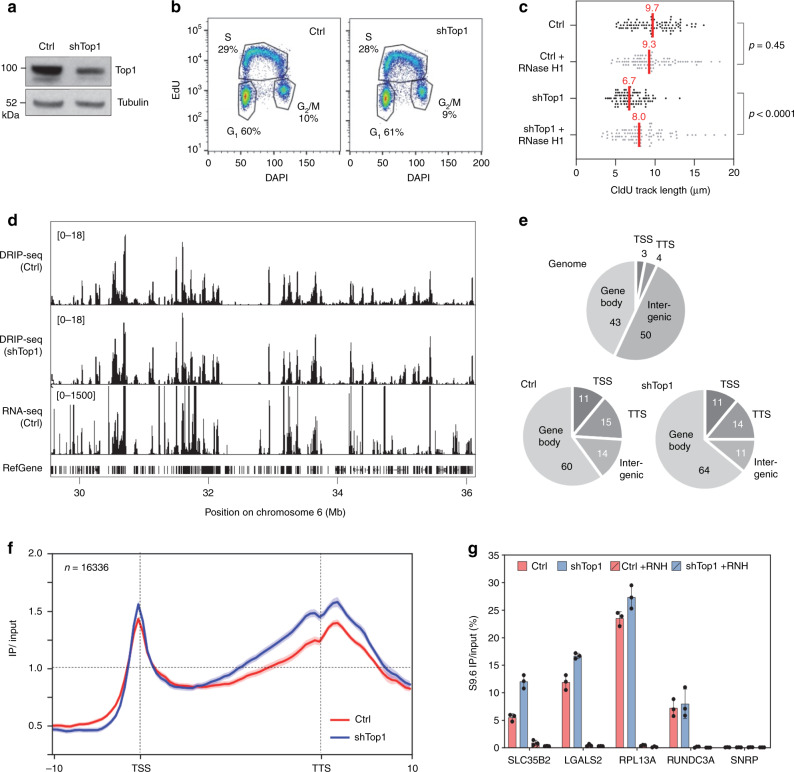
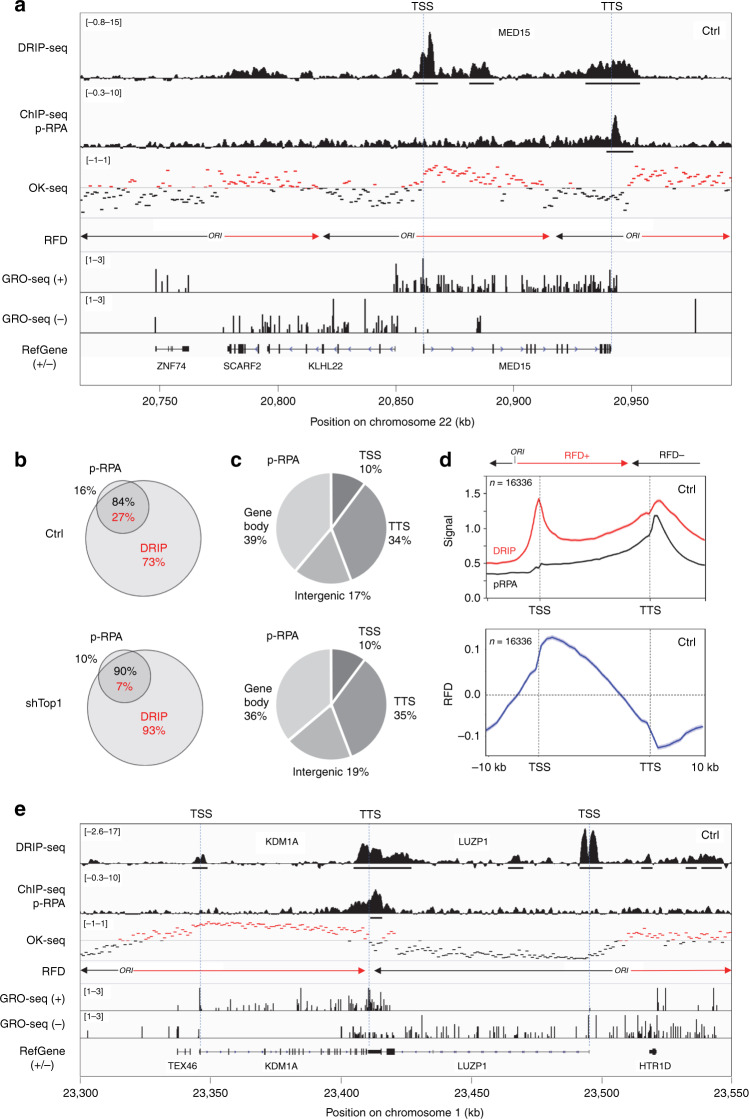
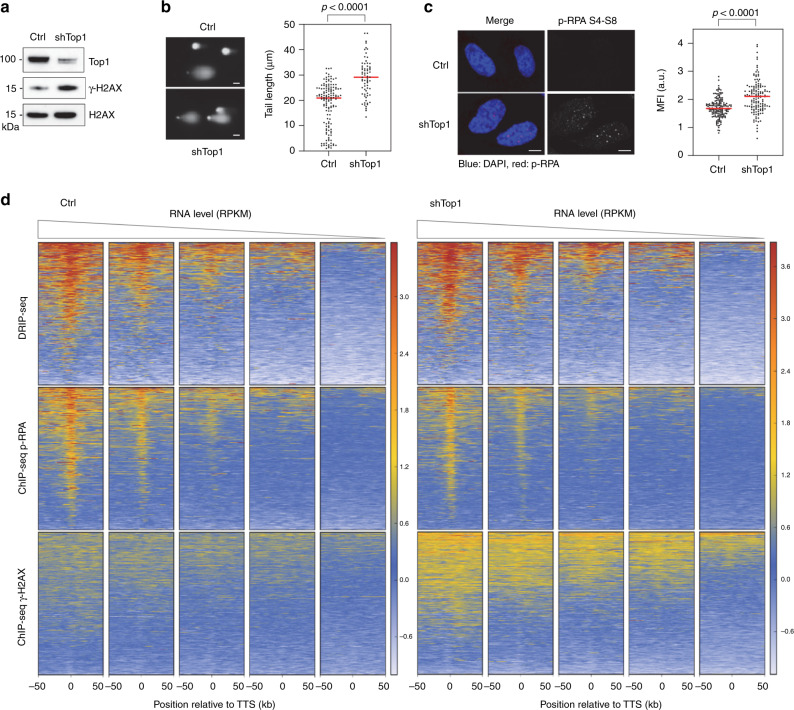
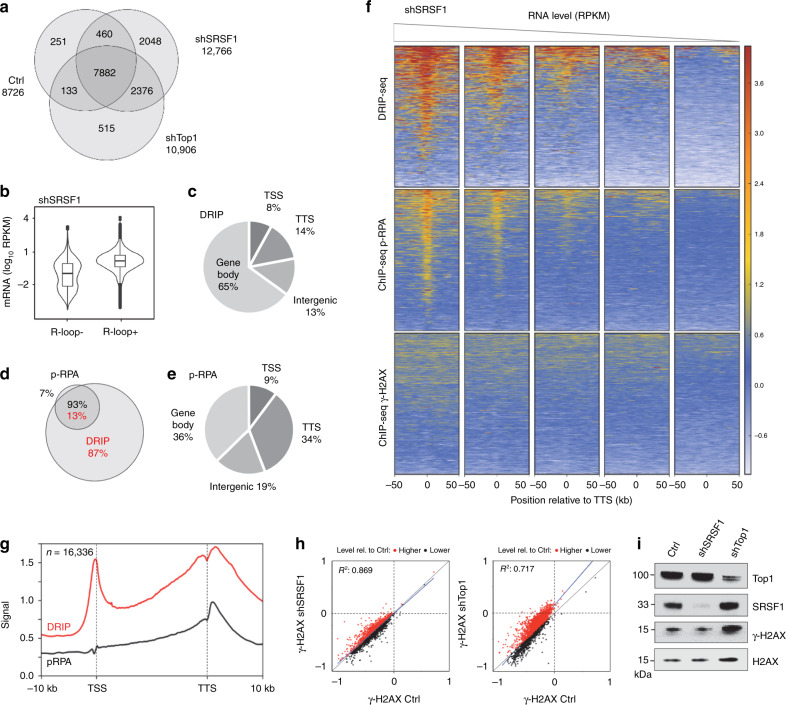
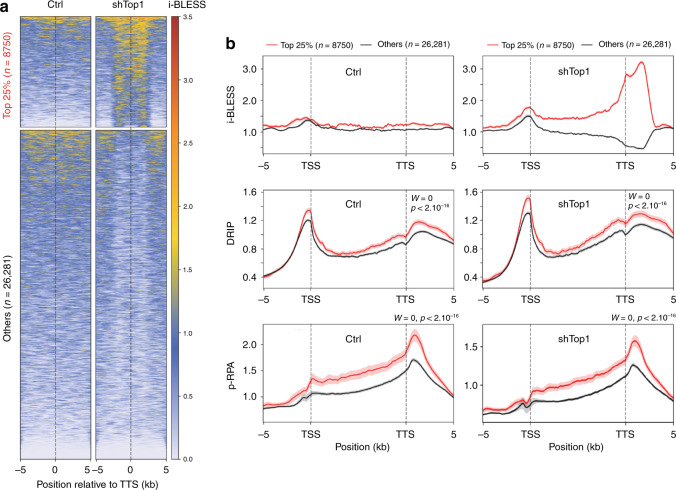
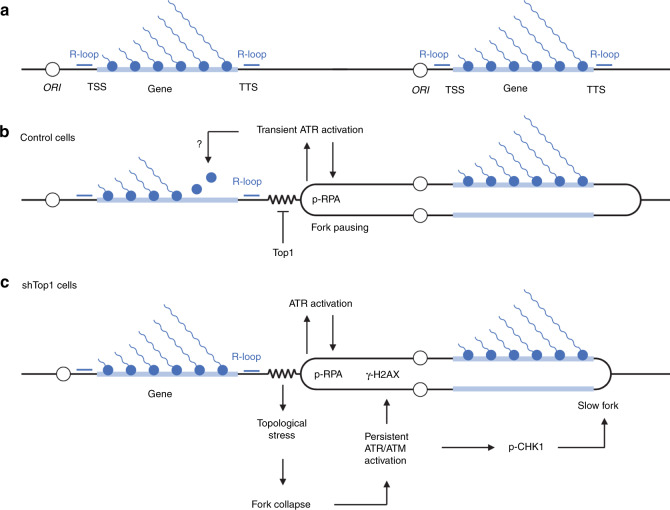
R-loops have both positive and negative impacts on chromosome functions. To identify toxic R-loops in the human genome, here, we map RNA:DNA hybrids, replication stress markers and DNA double-strand breaks (DSBs) in cells depleted for Topoisomerase I (Top1), an enzyme that relaxes DNA supercoiling and prevents R-loop formation. RNA:DNA hybrids are found at both promoters (TSS) and terminators (TTS) of highly expressed genes. In contrast, the phosphorylation of RPA by ATR is only detected at TTS, which are preferentially replicated in a head-on orientation relative to the direction of transcription. In Top1-depleted cells, DSBs also accumulate at TTS, leading to persistent checkpoint activation, spreading of γ-H2AX on chromatin and global replication fork slowdown. These data indicate that fork pausing at the TTS of highly expressed genes containing R-loops prevents head-on conflicts between replication and transcription and maintains genome integrity in a Top1-dependent manner.


Conflict of interest statement

The authors declare no competing interests.

Figures

Fig. 1
Fig. 1. Depletion of Top1 increases R-loop formation and slows down fork progression.
a Western blot analysis of Top1 levels in HeLa cells expressing shRNA targeting Top1 (shTop1) under the control of a doxycycline-inducible promoter at 72 h post-induction (n = 9). b Cell-cycle distribution of control and shTop1 cells determined by flow cytometry after labeling of S-phase cells with EdU. The fraction of cells in the different cell-cycle phases is indicated. See Supplementary Fig. 7 for gating strategy. c Doxycycline-treated control and shTop1 HeLa cells were transfected for 48 h with a mock vector (EGFP-N1) or human RNase H1-EGFP (+RNase H1) and were sequentially labeled with IdU and CldU for 20 min. Replication fork progression was measured using DNA fiber spreading as described in “Methods” section. The median length of CldU tracks is indicated in red. At least 150 fibers of each sample were measured (n = 3). P-values were calculated with the two-sided Mann–Whitney rank-sum test. d DRIP-seq analysis of the distribution of RNA:DNA hybrids expressed in RPKM (Read Per Kilobase per Million reads) in control and shTop1 HeLa cells. A representative region on chromosome 6 is shown. RNA-seq data (RPKM) for HeLa cells and gene positions (hg19) are also indicated. e Distribution of R-loop peaks relative to gene annotations in control and shTop1 HeLa cells. Peaks were obtained with MACS2 and were analyzed with CEAS (Cis-Regulatory Element Annotation System). The expected distribution in case peaks were randomly positioned in the genome is shown for comparison. The percentage of DRIP-seq signals present in each annotation class is indicated. TSS: Transcription Start Site (5′-UTR and 3 kb upstream). TTS: Transcription Termination Site (3′-UTR and 3 kb downstream). f Metaplot of the distribution of S9.6 signals (IP/input) along 16,336 active human genes (RPKM > 0) and flanking regions (±10 kb) in control (red) and shTop1 (blue) HeLa cells. Error bars correspond to SEM. g DRIP-qPCR analysis of the relative enrichment of RNA:DNA hybrids at the TTS of four genes and a negative control regions (SNPRN) in control and shTop1 HeLa cells after RNase H1 treatment (+RNH). Error bars correspond to three independent experiments.
Fig. 2
Fig. 2. Phospho-RPA accumulates at TTS in control and shTop1 cells.
a Distribution of RNA:DNA hybrids (DRIP-seq), p-RPA32 S33 (ChIP-seq), Okazaki fragments (OK-seq), and nascent transcription (GRO-seq) signals at a representative region on chromosome 22 in control HeLa cells. Replication fork direction (RFD) is derived from OK-seq data. The positions of TSS and TTS are indicated for the MED15 gene. The positions of DRIP and p-RPA peaks identified with MACS2 are also indicated. b Venn diagram of the percentage of genes overlapping with R-loop (red) and p-RPA peaks (black) peaks (MACS2) in control and shTop1 cells. c The distribution of p-RPA peaks was analyzed with CEAS as in Fig. 1e. The percentage of p-RPA peaks present in each region is indicated. d Metaplots of RNA:DNA hybrids (DRIP, red), p-RPA (black), and replication fork direction (RFD, blue) at 16,336 active genes in HeLa cells. Error bars indicate SEM. e Distribution of RNA:DNA hybrids (DRIP-seq), p-RPA32 S33 (ChIP-seq), Okazaki fragments (OK-seq), and nascent transcription (GRO-seq) signals at two converging genes on chromosome 1 in control HeLa cells. The positions of DRIP and p-RPA peaks identified with MACS2 are indicated.
Fig. 3
Fig. 3. Top1 prevents the accumulation of γ-H2AX at highly expressed genes.
a Western blot analysis of γ-H2AX levels in control and shTop1 cells (n = 3). b Analysis of DNA breaks in control and shTop1 cells. Representative images and the distribution of comet tail lengths are shown. Median of tail length is indicated in red. At least 50 cells of each sample were measured (n = 2). Bar is 10 µm. P-values were calculated with the two-sided Mann–Whitney rank-sum test. c Immunodetection of phospho-RPA32 S4/S8 in control and shTop1 cells. Mean fluorescence intensity (MFI) of the p-RPA32 S4/S8 signals is indicated in red. At least 400 cells of each sample were quantified (n = 3). P-values were calculated with the two-sided Mann–Whitney rank-sum test. Bar is 5 μm. d Heat map of the intensity of RNA:DNA hybrids (DRIP), p-RPA and γ-H2AX at TTS in control and shTop1 HeLa cells for five groups of genes with decreasing expression levels (RNA-seq). In each group, genes were sorted relative to the intensity of DRIP signal.
Fig. 4
Fig. 4. Depletion of SRSF1 increases R-loop and p-RPA at TTS, but not γ-H2AX.
a Venn diagram of the number of genes enriched in R-loops in control, shSRSF1, and shTop1 cells. R-loop-positive genes correspond to genes overlapping with R-loop peaks identified with MACS2. b mRNA level (RPKM) of genes overlapping (R-loop+) or not (R-loop−) with S9.6 peaks in shSRSF1 cells. Box: 25th and 75th percentiles; central line: median. c Distribution of R-loop peaks in shSRSF1 cells relative to gene annotations. Peaks were obtained with MACS2 and were analyzed with CEAS (Cis-Regulatory Element Annotation System). d Venn diagram of the percentage of genes overlapping with R-loop (red) and p-RPA peaks (black) peaks (MACS2) in shSRSF1 cells. e Distribution of p-RPA (S33) peaks in shSRSF1 cells relative to gene annotations. f Heat map of the intensity of RNA:DNA hybrids (DRIP), p-RPA, and γ-H2AX at TTS in shSRSF1 cells for five groups of genes with decreasing mRNA levels (RPKM). Within each group, genes were sorted relative to the intensity of DRIP signal. g Metaplot of RNA:DNA hybrids (DRIP, red) and p-RPA (black) at 16,336 active genes in shSRSF1 cells. Error bars correspond to SEM. h Scatter plot of the intensity of γ-H2AX signal at all active genes in control, shSRSF1, and shTop1 cells. i Western blot analysis of γ-H2AX levels on chromatin in control, shSRSF1, and shTop1 cells. H2AX was used as a loading control (n = 3).
Fig. 5
Fig. 5. DSBs form at TTS of genes enriched in R-loops and p-RPA in shTop1 cells.
a Heat map of the intensity of i-BLESS signal at TTS in control and shTop1 cells for two groups of genes determined according to the intensity of i-BLESS signal at the TTS (±2 kb) in shTop1 cells (Top 25%). b Metaplots of i-BLESS, RNA:DNA hybrids and p-RPA32 S33 signal for the Top 25% (red) and other (black) genes in control and shTop1 HeLa cells. Error bars indicate SEM. Differences in signal intensity at TTS ±2 kb were calculated with the Wilcoxon rank-sum test with continuity correction.
Fig. 6
Fig. 6. Model of the regulation of TRCs in the human genome.
a Highly expressed genes form co-transcriptional R-loops at TSS, TTS and to a lesser extent in gene bodies. Replication origins are frequently located upstream of TSS. b Initiation from upstream origins ensures that R-loops at TSS and gene bodies are preferentially replicated codirectionally, which would limit HO conflicts. Forks progressing in the opposite direction pause when they encounter the TTS of highly expressed genes, presumably because of the accumulation of positive supercoiling. Transient fork pausing activates ATR and leads to the phosphorylation of RPA32 on S33. ATR may also promote the displacement of RNA polymerases ahead of the paused fork. c In the absence of Top1, the accumulation of torsional stress may lead to fork collapse and to the sustained activation of ATR/ATM. This would in turn slowdown fork progression throughout the genome.

References

    1. Zeman MK, Cimprich KA. Causes and consequences of replication stress. Nat. Cell Biol. 2014;16:2–9. - PMC - PubMed
    1. Macheret M, Halazonetis TD. DNA replication stress as a hallmark of cancer. Annu. Rev. Pathol. 2015;10:425–448. - PubMed
    1. Fragkos M, Ganier O, Coulombe P, Mechali M. DNA replication origin activation in space and time. Nat. Rev. Mol. Cell Biol. 2015;16:360–374. - PubMed
    1. Zou L, Elledge SJ. Sensing DNA damage through ATRIP recognition of RPA-ssDNA complexes. Science. 2003;300:1542–1548. - PubMed
    1. Pasero P, Vindigni A. Nucleases acting at stalled forks: how to reboot the replication program with a few shortcuts. Annu. Rev. Genet. 2017;51:477–499. - PubMed

Publication types

Substances