. 2020 Aug 7;11(1):3951.
doi: 10.1038/s41467-020-17449-1.

DONSON and FANCM associate with different replisomes distinguished by replication timing and chromatin domain

Affiliations

DONSON and FANCM associate with different replisomes distinguished by replication timing and chromatin domain

Jing Zhang et al. Nat Commun. .

Abstract

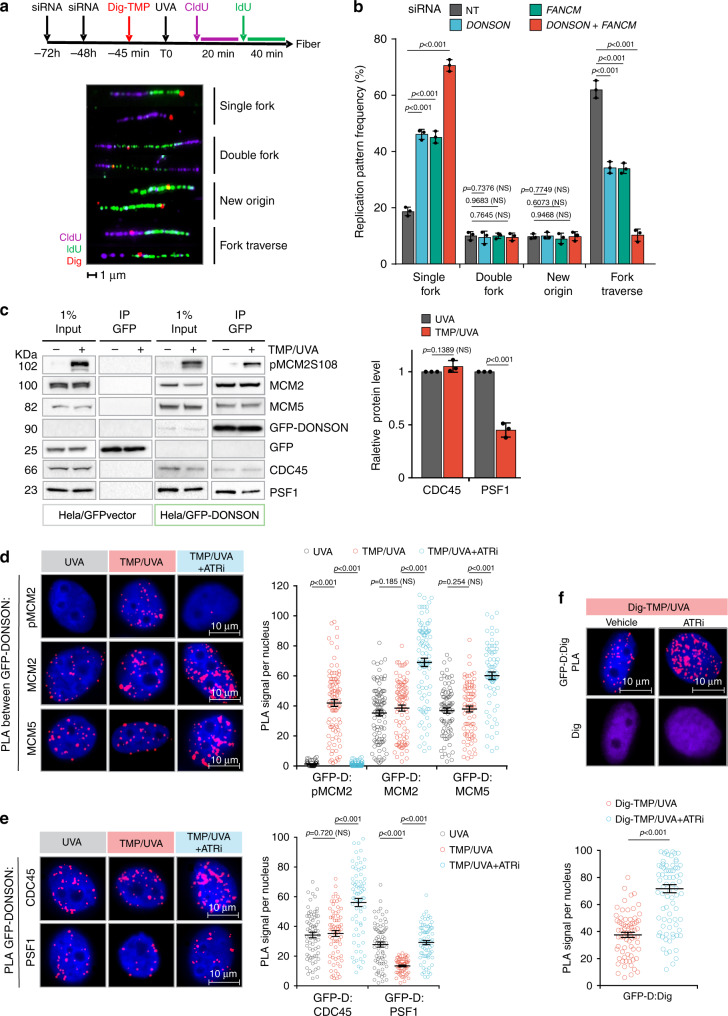
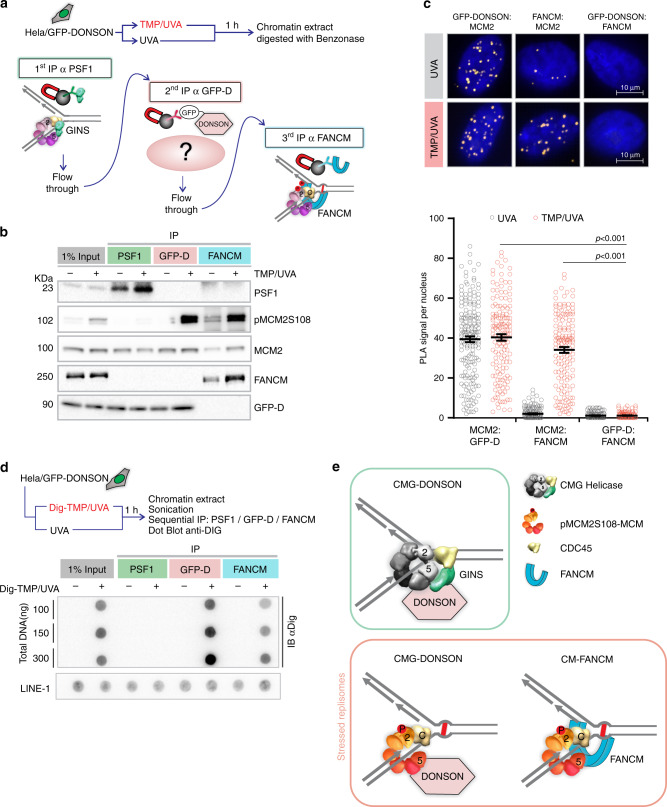
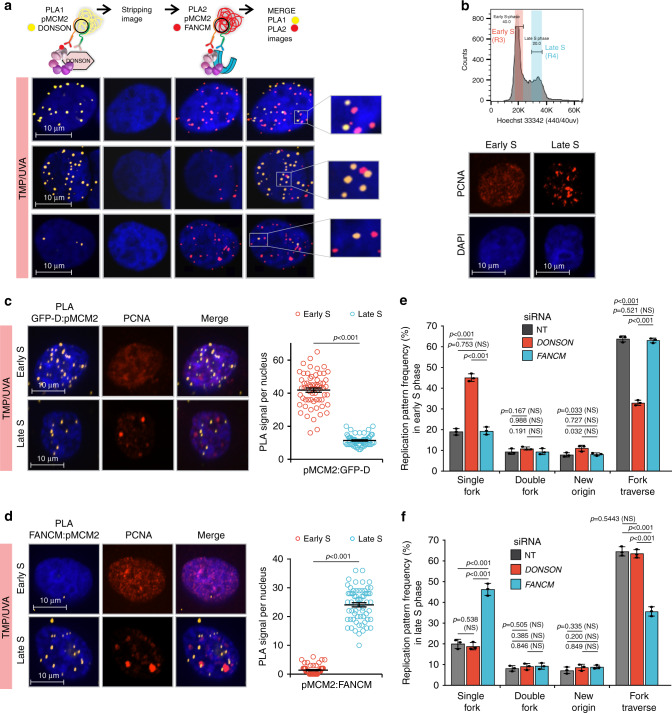
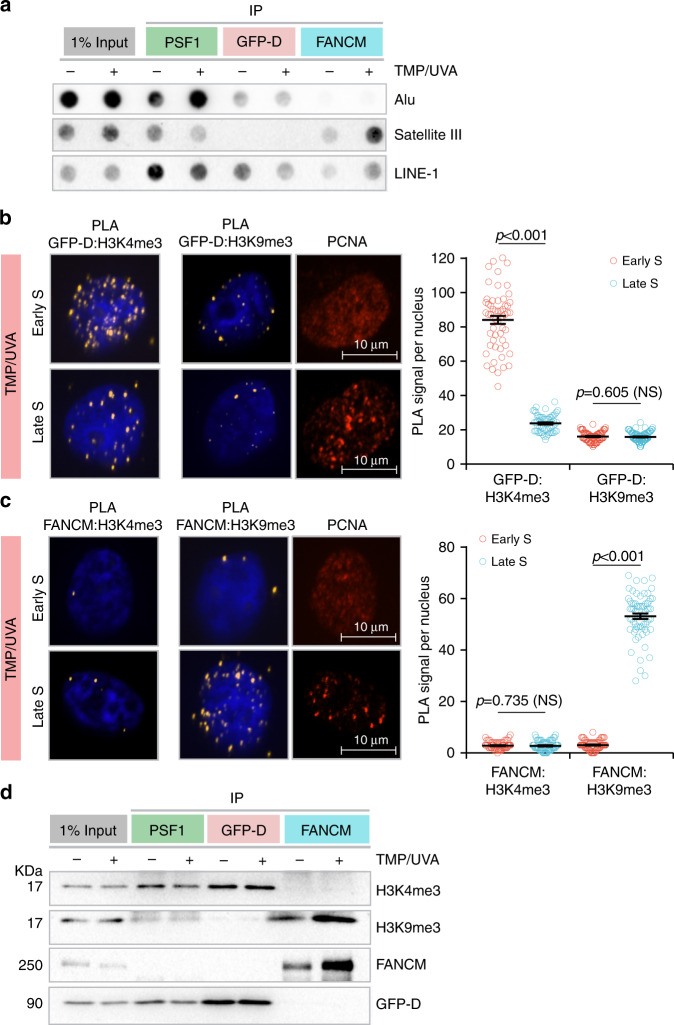
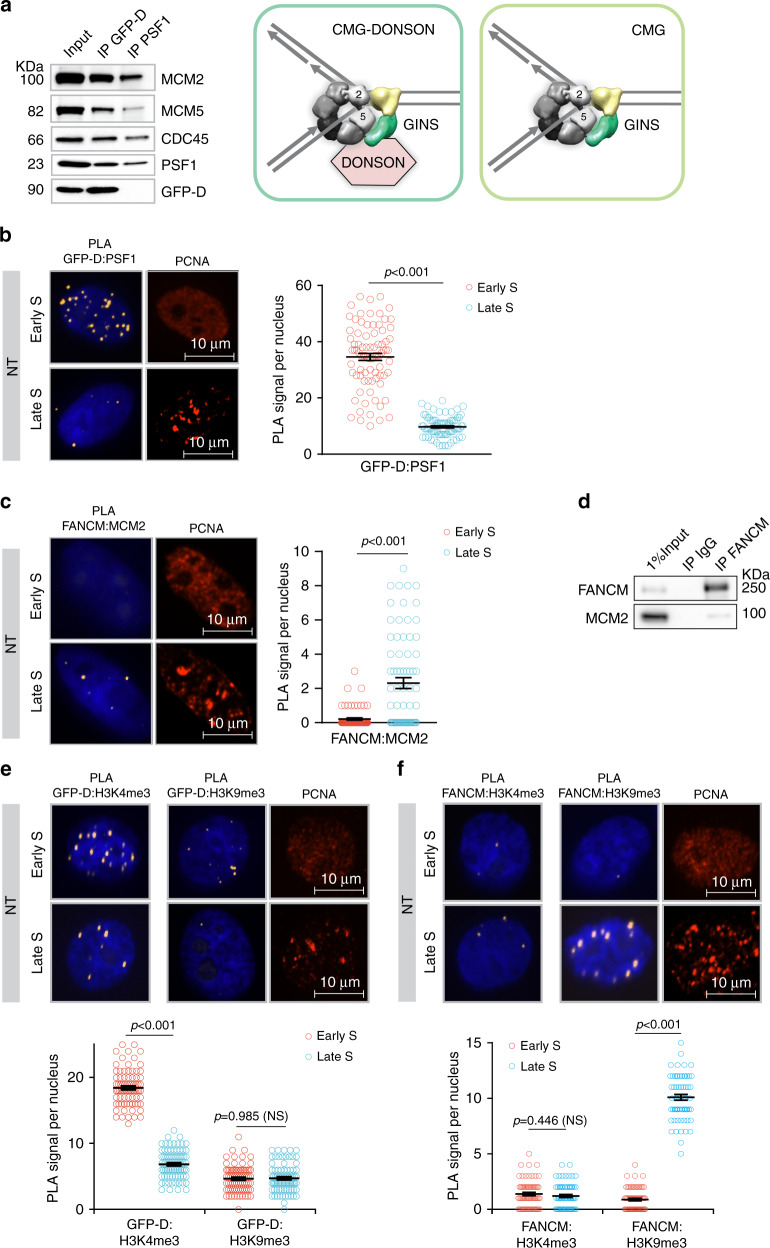
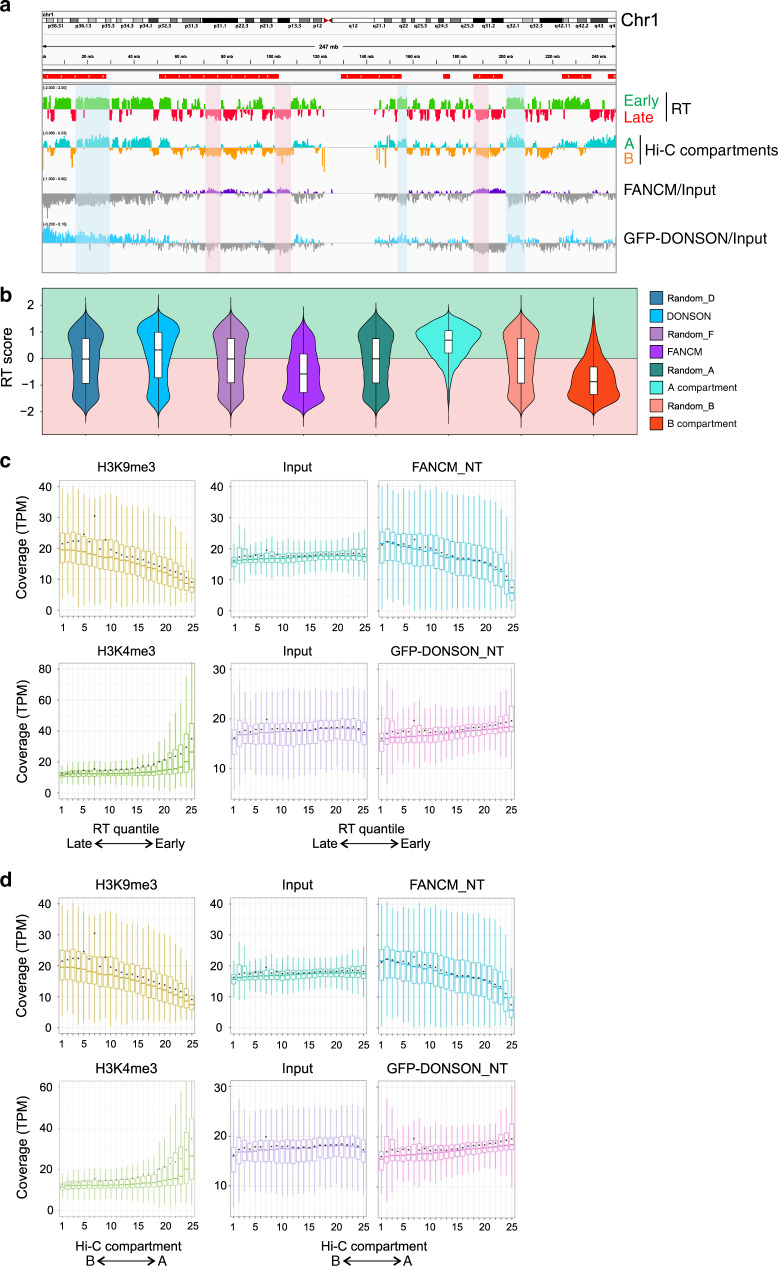
Duplication of mammalian genomes requires replisomes to overcome numerous impediments during passage through open (eu) and condensed (hetero) chromatin. Typically, studies of replication stress characterize mixed populations of challenged and unchallenged replication forks, averaged across S phase, and model a single species of "stressed" replisome. Here, in cells containing potent obstacles to replication, we find two different lesion proximal replisomes. One is bound by the DONSON protein and is more frequent in early S phase, in regions marked by euchromatin. The other interacts with the FANCM DNA translocase, is more prominent in late S phase, and favors heterochromatin. The two forms can also be detected in unstressed cells. ChIP-seq of DNA associated with DONSON or FANCM confirms the bias of the former towards regions that replicate early and the skew of the latter towards regions that replicate late.


Conflict of interest statement

The authors declare no competing interests.

Figures

Fig. 1
Fig. 1. DONSON and FANCM operate in separate pathways to promote replication traverse.
a HeLa cells were treated with siRNA against DONSON or FANCM or both. They were exposed to Dig-TMP/UVA and incubated with CldU, then IdU. Fibers were prepared and patterns displayed by immunofluorescence against the analogues and immunoquantum detection (Q dot 655, in red) for Dig-tagged ICLs. Representative patterns are shown. b Quantitation of pattern distribution. Fibers with ICL encounters: NT = 417; siDONSON = 432; siFANCM = 417; siDONSON + siFANCM = 385, from three independent replicates. Data are mean ± s.d. c IP immunoblot of chromatin proteins from cells expressing GFP (panels 1, 2) or GFP-DONSON (panels 3, 4) exposed to UVA (−) or TMP/UVA (+). The identity of the proteins is indicated. The amounts of PSF1 and CDC45 in the two samples were quantitated. Representative blot (n = 3). Data are mean ± s.d. d PLA test of the influence of ATR inhibition on GFP-DONSON interactions with pMCM2S108, MCM2, and MCM5. Number of nuclei: PLA between GFP-DONSON and pMCM2 in cells treated with UVA = 58, TMP/UVA = 94, TMP/UVA + ATRi = 55; PLA between GFP-DONSON and MCM2 in UVA = 95, TMP/UVA = 89, TMP/UVA + ATRi = 93; PLA between GFP-DONSON and MCM5 in UVA = 88, TMP/UVA = 79, TMP/UVA+ATRi = 73; from three biological replicates. Data are mean ± s.e.m. e PLA assessing the influence of ATR inhibition on GFP-DONSON interactions with CDC45 and PSF1. Scored nuclei of PLA between GFP-DONSON and CDC45 in UVA = 70, TMP/UVA = 71, TMP/UVA + ATRi = 73; scored nuclei of PLA between GFP-DONSON and PSF1 in UVA = 71, TMP/UVA = 64, TMP/UVA + ATRi = 77; from three biological replicates. Data are mean ± s.e.m. f Influence of ATR inhibition on the PLA between GFP-DONSON and Dig-tagged ICLs. Scored nuclei: Vehicle = 72, ATRi = 87, three biological replicates. Data are mean ± s.e.m. For replication pattern frequency experiments and Western blotting image analysis (a, c), a two-sided unpaired t test was used to calculate P-values. For PLA experiments (df), a two-sided Mann–Whitney rank-sum test was used to determine if differences were significant. NS: not significant: P > 0.05. Source data are provided as a Source Data file.
Fig. 2
Fig. 2. DONSON and FANCM are on different replisomes.
a Scheme of sequential IP against DONSON and FANCM-associated replisomes. HeLa cells expressing GFP-DONSON were exposed to UVA only or TMP/UVA. Chromatin was prepared and digested with benzonase. This was followed by IP against PSF1 (to remove unstressed replisomes), then IP of the supernatant against GFP (to remove remaining DONSON-associated proteins), and finally IP of the residual supernatant to capture FANCM-bound proteins. b Western blot analysis of sequential IP. Representative blot (n = 3). c PLA in cells exposed to UVA only or TMP/UVA shows interactions between GFP-DONSON and MCM2; and FANCM and MCM2; but not between GFP-DONSON and FANCM. Scored nuclei: PLA between GFP-D: MCM2, UVA treatment = 174; TMP/UVA = 148; PLA between FANCM: MCM2, UVA = 142; TMP/UVA = 145; PLA between GFP-D: FANCM, UVA = 135; TMP/UVA = 133 from three biological replicates. Data are mean ± s.e.m. A two-sided Mann–Whitney rank-sum test was used to determine if differences were significant. NS: not significant: P > 0.05. d Association of replisomes with Dig-tagged ICLs. Chromatin was prepared from cells exposed to UVA or Dig-TMP/UVA, and the DNA reduced to fragments of <500 bp by sonication. Sequential IP was performed, and the DNA isolated from each fraction, dotted onto the nitrocellulose, and probed with an antibody to the Dig tag. LINE-1 repeat element served as a loading control. Representative blot (n = 2). e Model summarizing the results of the sequential IP experiment. Source data are provided as a Source Data file.
Fig. 3
Fig. 3. DONSON and FANCM replisomes are active in different stages of the S phase.
a Analysis by sequential PLA of GFP-DONSON: pMCM2S108 complexes and then FANCM: pMCM2S108, in GFP-DONSON expressing cells exposed to TMP/UVA. After the first PLA, the cells were photographed (first column of images) and the antibodies and PLA product stripped (second column). The second PLA was performed, and the cells re-imaged (third column). The fourth column shows a merge of both images after image registration in the xyz planes using the DAPI signal. Examples are shown of cells with strong signals from both first and second PLA, or strong signals from the first but infrequent from the second, or weak from the first and strong from the second. The signals from the two PLA do not colocalize. b Early and late S phase fractions were isolated from sorted cells. The PCNA staining pattern from each fraction. c GFP-D: pMCM2S108 PLA in sorted early and late S phase cells. Scored nuclei: GFP-D: pMCM2S108 of early S phase = 62, late S phase = 60, from three biological replicates. Data are mean ± s.e.m. d FANCM: pMCM2S108 PLA in sorted early and late S phase cells. Scored nuclei: FANCM: pMCM2S108 of early S phase = 63, late S phase = 64, from three biological replicates. Data are mean ± s.e.m. e, f Influence of DONSON and FANCM on patterns of replication encounters with ICLs in early and late S phase cells. Cells were treated with siRNA against DONSON or FANCM, exposed to Dig-TMP/UVA and pulsed with nucleoside analogues as in Fig. 1a. Cells were sorted, and fiber patterns from early and late S phase analyzed. Data are mean ± s.d.. For PLA experiments (c, d), a two-sided Mann–Whitney rank-sum test was used, for replication pattern experiments (e, f) a two-sided unpaired t test was used, to determine if differences were statistically significant. NS: not significant: P > 0.05. Source data are provided as a Source Data file.
Fig. 4
Fig. 4. Relationship of DONSON and FANCM to replication timing and chromatin domain.
Cells were treated with either UVA or TMP/UVA. a Sequential IP demonstrates association of early-replicating Alu sequences with DONSON and late-replicating Satellite 3 sequences with FANCM. LINE-1 elements replicate throughout the S phase and are found in all fractions. Representative blot (n = 3). b DONSON interaction with the H3K4me3 euchromatin mark is more frequent in early S phase cells than in late S phase, while there is little interaction with the H3K9me3 heterochromatin mark in either stage. Sorted early and late S phase cells were examined by PLA. Scored nuclei: PLA between GFP-D: H3K4me3 of early S phase = 67, late S phase = 64, PLA between GFP-D: H3K9me3 of early S phase = 70, late S phase = 85, from three biological replicates. Data are mean ± s.e.m. c FANCM interaction with H3K9me3 heterochromatin mark is biased toward late S phase, while there is low interaction frequency with H3K4me3 in either stage. Scored nuclei: PLA between FANCM: H3K4me3 of early S phase = 64, late S phase = 66, PLA between FANCM: H3K9me3 of early S phase = 67, late S phase = 77, from three biological replicates. Data are mean ± s.e.m. d Sequential IP demonstrates greater association of DONSON with H3K4me3 than H3K9me3 and greater association of FANCM with H3K9me3 than H3K4me3. Representative blot (n = 3). For PLA experiments in b, c, a two-sided Mann–Whitney rank-sum test was used to determine if differences were statistically significant. NS: not significant: P > 0.05. Source data are provided as a Source Data file.
Fig. 5
Fig. 5. Interactions of DONSON and FANCM with replisomes and chromatin in nontreated cells.
a DONSON associates with some, but not all, replisomes in untreated cells. Chromatin was prepared from untreated GFP-DONSON-HeLa cells and sequential IP performed, first against GFP-DONSON, and then against the GINS protein PSF1 from the residual supernatant. Representative blot (n = 3). b PLA of GFP-DONSON and PSF1 demonstrates DONSON-associated replisomes are more frequent in early S phase than in late S phase in NT cells. Scored nuclei: PLA between GFP-D: PSF1 early S phase = 82, late S phase = 81, from three biological replicates. Data are mean ± s.e.m. c PLA between FANCM and MCM2 demonstrates low level of FANCM-associated replisomes in late S phase in nontreated cells. Scored nuclei: PLA between FANCM: MCM2 of early S phase = 73, late S phase = 75, from three biological replicates. Data are mean ± s.e.m. d IP of FANCM demonstrates low-level interaction with replisome protein MCM2. e PLA between GFP-DONSON and H3K4me3 or H3K9me3. Scored nuclei of GFP-DONSON and H3K4me3 in early S phase = 79, late S phase = 78. Scored nuclei of GFP-DONSON and H3K9me3 in early S phase = 77, late S phase = 82, from three biological replicates. Data are mean ± s.e.m. f PLA between FANCM and H3K4me3 or H3K9me3. Scored nuclei of FANCM and H3K4me3 in early S phase = 64, late S phase = 65. Scored nuclei of FANCM and H3K9me3 in early S phase = 68, late S phase =  65, from three biological replicates. Data are mean ± s.e.m. For PLA experiments in b, c, e, f, a two-sided Mann–Whitney rank-sum test was used to determine if differences were statistically significant. NS: not significant: P > 0.05. Source data are provided as a Source Data file.
Fig. 6
Fig. 6. ChIP-Seq analysis of genome-wide distribution of FANCM and GFP-DONSON.
a Representative profile from chromosome 1, comparing RT (RT = log2(Early/Late)) in HeLa cells, A/B compartments as defined by the eigenvector calculated from Hi-C data from HeLa cells, and FANCM and GFP-DONSON distribution (enrichment = log2(ChIP/input)) in HeLa cells stably expressing GFP-DONSON. Some examples are shadowed in red of late-replicating regions aligning with FANCM enriched genomic regions. Some early-replicating regions are highlighted in blue showing correspondence with GFP-DONSON-enriched regions. In the RT profile, positive and negative values correspond to early and late replication, respectively. In the eigenvector profile, they correspond to the A and B compartments. Regions containing fragile sites are marked by red bars above the profiles. b Violin plot displaying the distribution of replication timing of 50-Kb genomic windows enriched in FANCM or GFP-DONSON ChIP (log2[ChIP/Input] > 0) and the A and B Hi-C compartments (eigenvector >0, <0, respectively), each compared with a matching number of randomly selected genomic windows of the same size. The box plot inside the violin plot shows the median (center line), the upper (Q3) and lower (Q1) quartiles (box bounds) and the highest and lowest values excluding outliers (extreme lines). c Coverage of H3K9me3, H3K4me3, FANCM, and GFP-DONSON of 50-Kb genomic windows within 25 replication-timing quantiles, going from late- to early-replicating regions, in HeLa cells expressing GFP-DONSON. d Coverage of H3K9me3, H3K4me3, FANCM, and GFP-DONSON of 50-kb genomic windows within 25 eigenvector quantiles, going from B to A Hi-C compartments in HeLa cells expressing GFP-DONSON. In the box plots in c, d, the center line represents the median, the box bounds represent the upper (Q3) and lower (Q1) quartiles, the extreme lines represent the highest and lowest value excluding outliers, and the black dot represents the mean.

References

    1. Tye BK. MCM proteins in DNA replication. Annu. Rev. Biochem. 1999;68:649–686. - PubMed
    1. Bochman ML, Schwacha A. The Mcm2-7 complex has in vitro helicase activity. Mol. Cell. 2008;31:287–293. - PubMed
    1. Bai L, et al. Architecture of the Saccharomyces cerevisiae replisome. Adv. Exp. Med. Biol. 2017;1042:207–228. - PMC - PubMed
    1. Mayle R, et al. Mcm10 has potent strand-annealing activity and limits translocase-mediated fork regression. Proc. Natl Acad. Sci. USA. 2019;116:798–803. - PMC - PubMed
    1. Yeeles JTP, Janska A, Early A, Diffley JFX. How the eukaryotic replisome achieves rapid and efficient DNA replication. Mol. Cell. 2017;65:105–116. - PMC - PubMed

Publication types