. 2020 Aug 7;10(1):13341.
doi: 10.1038/s41598-020-69853-8.

Effect of allosteric inhibition of non-muscle myosin 2 on its intracellular diffusion

Affiliations

Effect of allosteric inhibition of non-muscle myosin 2 on its intracellular diffusion

Ádám I Horváth et al. Sci Rep. .

Abstract

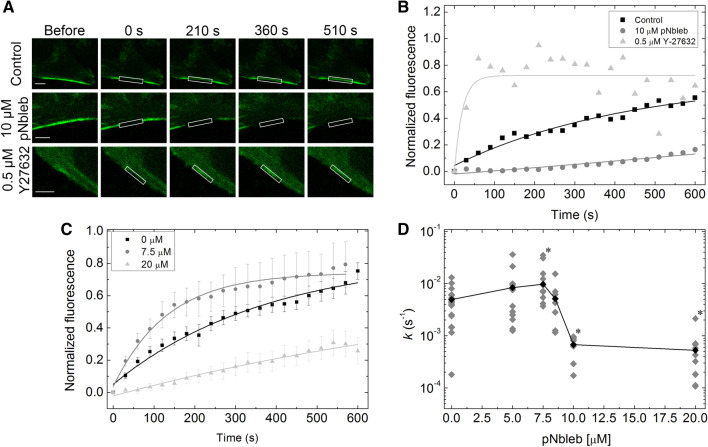
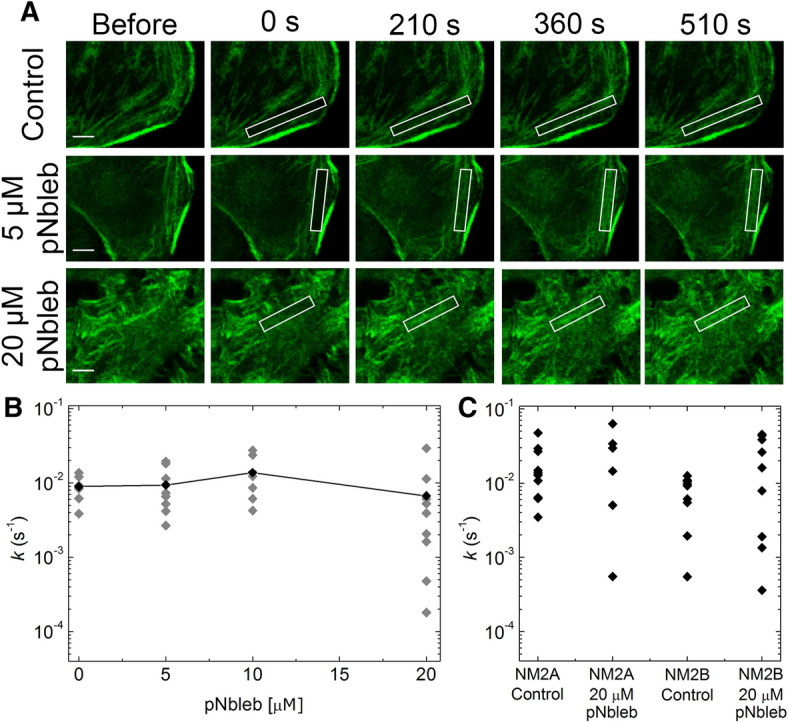
Subcellular dynamics of non-muscle myosin 2 (NM2) is crucial for a broad-array of cellular functions. To unveil mechanisms of NM2 pharmacological control, we determined how the dynamics of NM2 diffusion is affected by NM2's allosteric inhibitors, i.e. blebbistatin derivatives, as compared to Y-27632 inhibiting ROCK, NM2's upstream regulator. We found that NM2 diffusion is markedly faster in central fibers than in peripheral stress fibers. Y-27632 accelerated NM2 diffusion in both peripheral and central fibers, whereas in peripheral fibers blebbistatin derivatives slightly accelerated NM2 diffusion at low, but markedly slowed it at high inhibitor concentrations. In contrast, rapid NM2 diffusion in central fibers was unaffected by direct NM2 inhibition. Using our optopharmacological tool, Molecular Tattoo, sub-effective concentrations of a photo-crosslinkable blebbistatin derivative were increased to effective levels in a small, irradiated area of peripheral fibers. These findings suggest that direct allosteric inhibition affects the diffusion profile of NM2 in a markedly different manner compared to the disruption of the upstream control of NM2. The pharmacological action of myosin inhibitors is channeled through autonomous molecular processes and might be affected by the load acting on the NM2 proteins.


Conflict of interest statement

The authors declare no competing interests.

Figures

Figure 1
Figure 1
Destabilization of peripheral stress fibers by AmBleb and Y-27632. (A) GFP-labeled MLC (GFP-MLC) expressing HeLa Kyoto cells were imaged in two-photon microscope in the absence (n = 10) and presence of 40 μM AmBleb (n = 10) or 2 μM Y-27632 (n = 10). Control cells showed that high-intensity peripheral stress fibers remained intact after 30 min in the absence of inhibitors. (B) Normalized pixel intensity distribution histograms (n = pixel frequency; I = intensity), revealing changes resulting from inhibitor treatment (see text).
Figure 2
Figure 2
Peripheral stress fiber dynamics is an order of magnitude slower than that of central fibers in the absence of inhibitors (see also Supplementary Video 1 and 2). (A) Rate constants of fluorescence recovery, plotted as a function of distance from the peripheral stress fiber (means ± SEM, n = 3). The recovery rates of the peripheral stress fibers were an order of magnitude slower than those of central fibers. (B) Sample images at different time points from a FRAP experiment in a GFP-MLC expressing HeLa Kyoto cell, where a 4 × 14 μm region (red box), including both peripheral and central stress fibers, was photobleached in the absence of NM2 inhibitors. Fluorescence recovery was analyzed in the regions indicated by white arrows and white boxes, corresponding to the abscissa of panel A.
Figure 3
Figure 3
FRAP recovery rates show marked difference between Y-27632 and pNbleb inhibition in peripheral stress fibers (see also Supplementary Video 3). (A) Representative FRAP images of peripheral stress fibers in GFP-MLC expressing HeLa Kyoto cells at different time points in the absence and presence of 10 μM pNbleb or 0.5 μM Y-27632. White boxes indicate the photobleached areas. Scale bar: 5 μm. (B) Fluorescence levels normalized to the pre-photobleaching level are plotted as a function of time after photobleaching. Fluorescence recovery rate constants determined from single exponential fits showed significant differences in peripheral stress fiber dynamics in the presence of the different inhibitors (mean values: kcontr = 2.3 × 10−3 ± 7.4 × 10−4 s−1 (black), kpNbleb = 2.9 × 10−4 ± 2.8 × 10−3 s−1(gray), kY27632 = 5.3 × 10−2 s−1 ± 1.8 × 10−4 s−1 (light gray)). (C) Averaged fluorescence recovery of peripheral stress fibers recorded in the presence of 0 μM, 7.5 μM and 10 μM pNbleb (means ± SEM, sample sizes as specified for panel D). Single exponential fits are shown as light grey, grey and black lines, respectively. (D) Plot of the fluoresce recovery rate constants as a function of pNbleb concentration (n0 μM = 18, n5 μM = 11, n7.5 μM = 12, n8.5 μM = 7, n10 μM = 8, n20 μM = 10)). The graph shows all acquired data points. The datasets marked with black asterisks are significantly different from the control recovery rates (0 μM), according to parametric ANOVA tests (see “Materials and methods”). Fitted parameters of individual FRAP tests and their averages are shown as gray and black diamonds, respectively.
Figure 4
Figure 4
FRAP experiments on stress fibers locally inhibited by Molecular Tattoo. (A) Schematic of the combination of Molecular Tattoo with FRAP technique (FRAP-Tattoo). In FRAP-Tattoo, azidoblebbistatin (N3bleb) is photocrosslinked to its target protein, NM2, in a subcellular region, while simultaneously bleaching GFP attached to the myosin light chain (MLC) in the same subcellular area. Crosslinking and photobleaching are achieved using multiple irradiation cycles with a two-photon microscope at 860-nm excitation. Red arrow indicates the movement of the scanning laser (red triangle). N3bleb is added in sub-effective concentrations (1, 2 and 5 μM) to avert systemic NM2 inhibitory effect. Several irradiation cycles saturate the covalently crosslinked NM2 inhibitor population. Simultaneously, the GFP tag on the MLC is photobleached. (B) Fluorescence recovery rate constants in FRAP-Tattoo experiments as a function of N3bleb concentration (black diamonds) (n0 μM = 7, n1 μM = 9, n2 μM = 4, n5 μM = 5). Gray diamonds represent the rate constants obtained from Fig. 3D. Black and gray lines connect averages of rate constant values. The graph shows all acquired data points. Datasets marked with black asterisks are significantly different from control recovery rates (0 μM), according to parametric ANOVA tests (see “Materials and methods”).
Figure 5
Figure 5
NM2 diffusion in central stress fibers is insensitive to pNbleb treatment and is NM2 isoform-independent. (A) Representative FRAP images of central fibers of GFP-MLC expressing HeLa Kyoto cells at different time points in the absence (upper row) and presence of 5 μM pNbleb (middle row) and 20 μM pNbleb (lower row). White boxes indicate photobleached areas. Scale bar: 5 μm. (B) Plot of FRAP rate constants (grey diamonds) as a function of pNbleb concentration. Averages of FRAP rate constants are shown as black diamonds connected with a black line (n0 μM = 7, n5 μM = 8, n10 μM = 6, n20 μM = 9). At 20 μM pNbleb concentration, the average of the rate constants is not significantly different from those at lower inhibitor concentrations, while the variation of the rate constants is higher (σ20μM = 1.1 × 10−5; σ210μM = 9.3 × 10−5 and σ220μM = 8.4 × 10−5), which may originate from the occasional strained state of the central fibers tested in these experiments. (C) FRAP rate constants of central fibers in GFP-NM2A or GFP-NM2A expressing cell lines in the absence and in the presence of 20 μM pNbleb (nNM2A 0 μM = 12, nNM2A 20 μM = 6, nNM2B 0 μM = 11, nNM2B 20 μM = 10). Rate constants did not differ significantly from those obtained for the GFP-MLC construct, and the increased variation of rate constants at 20 μM pNbleb was also observed for GFP-NM2 heavy chain isoforms.

References

    1. Tojkander S, Gateva G, Lappalainen P. Actin stress fibers–assembly, dynamics and biological roles. J. Cell Sci. 2012;125:1855–1864. doi: 10.1242/jcs.098087. - DOI - PubMed
    1. Burridge K, Wittchen ES. The tension mounts: stress fibers as force-generating mechanotransducers. J. Cell Biol. 2013;200:9–19. doi: 10.1083/jcb.201210090. - DOI - PMC - PubMed
    1. Burridge K, Guilluy C. Focal adhesions, stress fibers and mechanical tension. Exp. Cell Res. 2016;343:14–20. doi: 10.1016/j.yexcr.2015.10.029. - DOI - PMC - PubMed
    1. Hodges JL, Newell-Litwa K, Asmussen H, Vicente-Manzanares M, Horwitz AR. Myosin IIb activity and phosphorylation status determines dendritic spine and post-synaptic density morphology. PLoS ONE. 2011;6:e24149. doi: 10.1371/journal.pone.0024149. - DOI - PMC - PubMed
    1. Sanger JM, Mittal B, Pochapin MB, Sanger JW. Stress fiber and cleavage furrow formation in living cells microinjected with fluorescently labeled alpha-actinin. Cell Motil. Cytoskelet. 1987;7:209–220. doi: 10.1002/cm.970070304. - DOI - PubMed

Publication types