. 2020 Aug 7;11(1):3978.
doi: 10.1038/s41467-020-17818-w.

HNF4α regulates sulfur amino acid metabolism and confers sensitivity to methionine restriction in liver cancer

Affiliations

HNF4α regulates sulfur amino acid metabolism and confers sensitivity to methionine restriction in liver cancer

Qing Xu et al. Nat Commun. .

Abstract

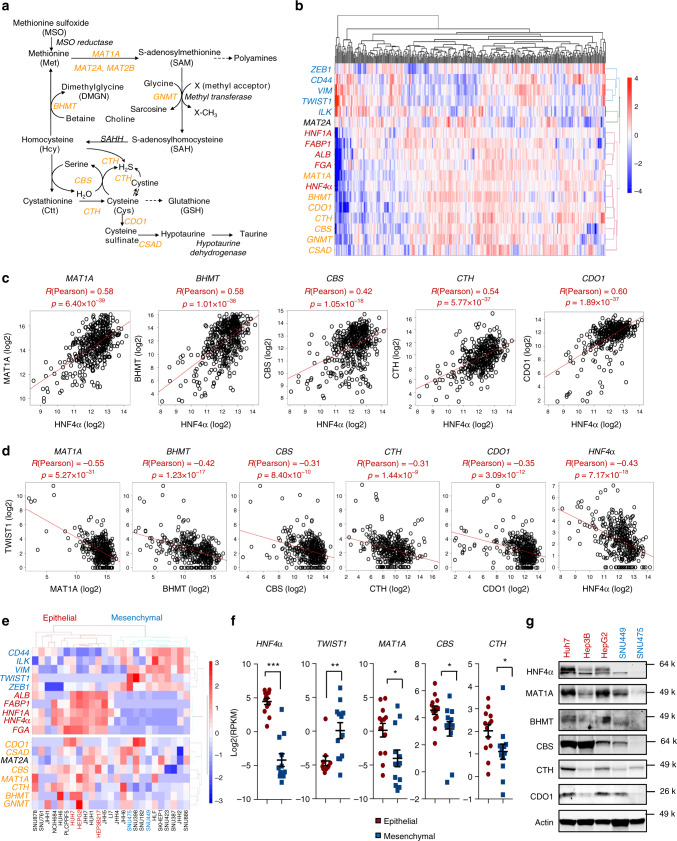
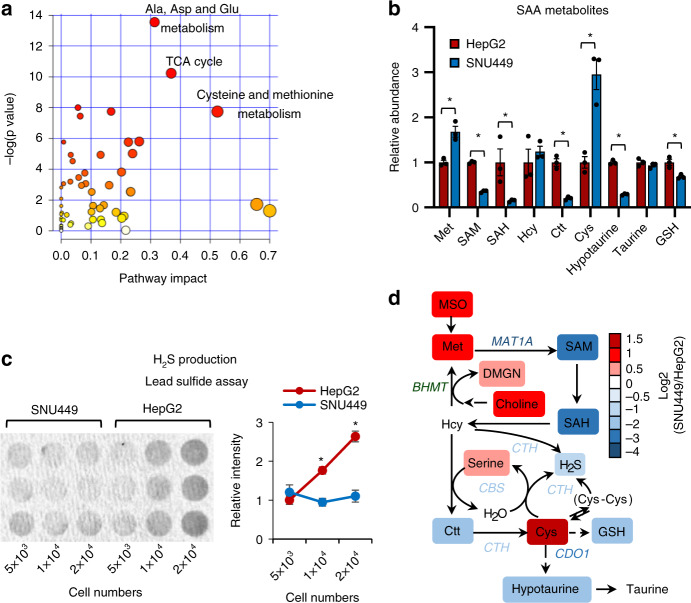
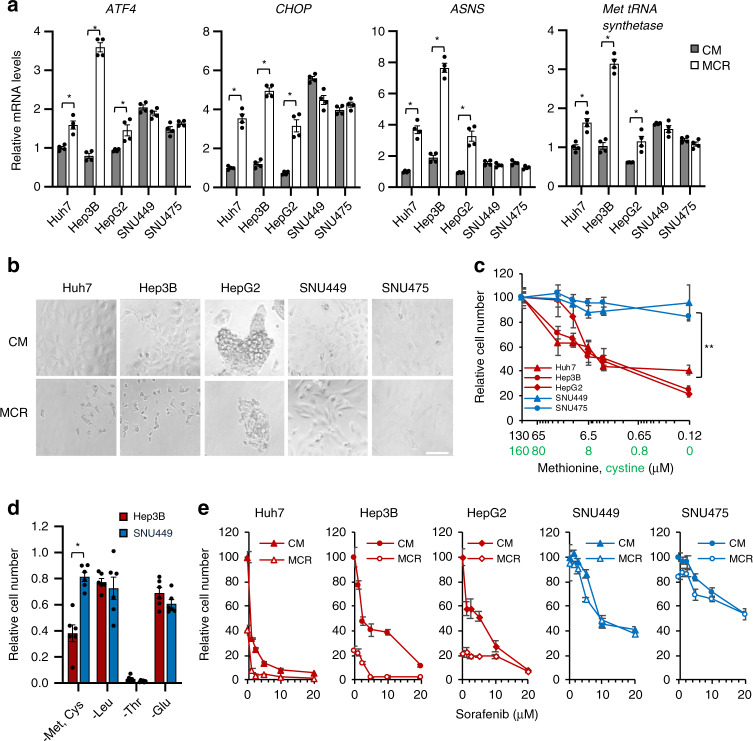
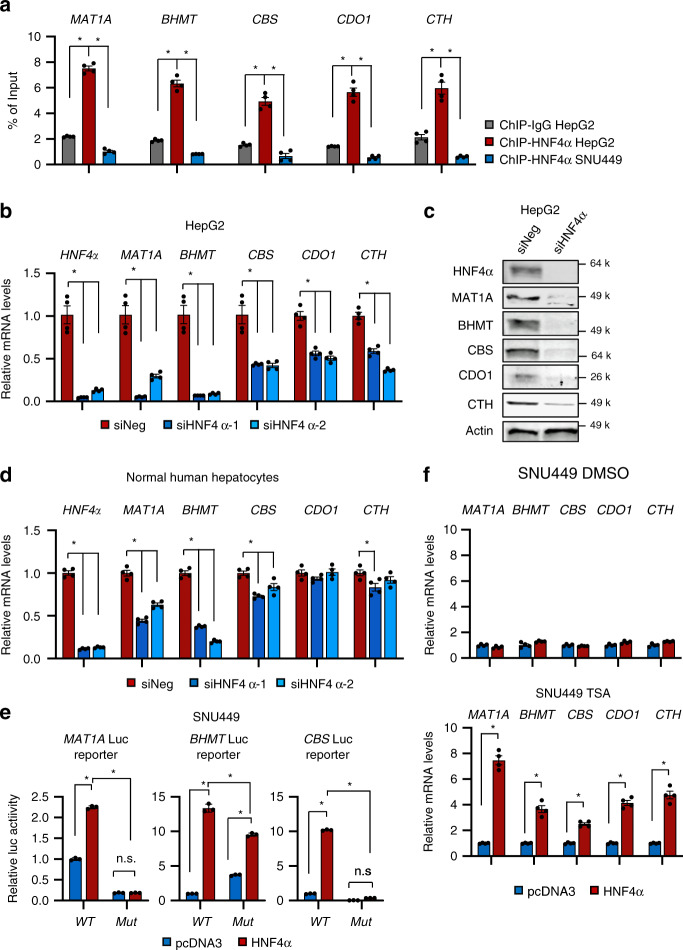
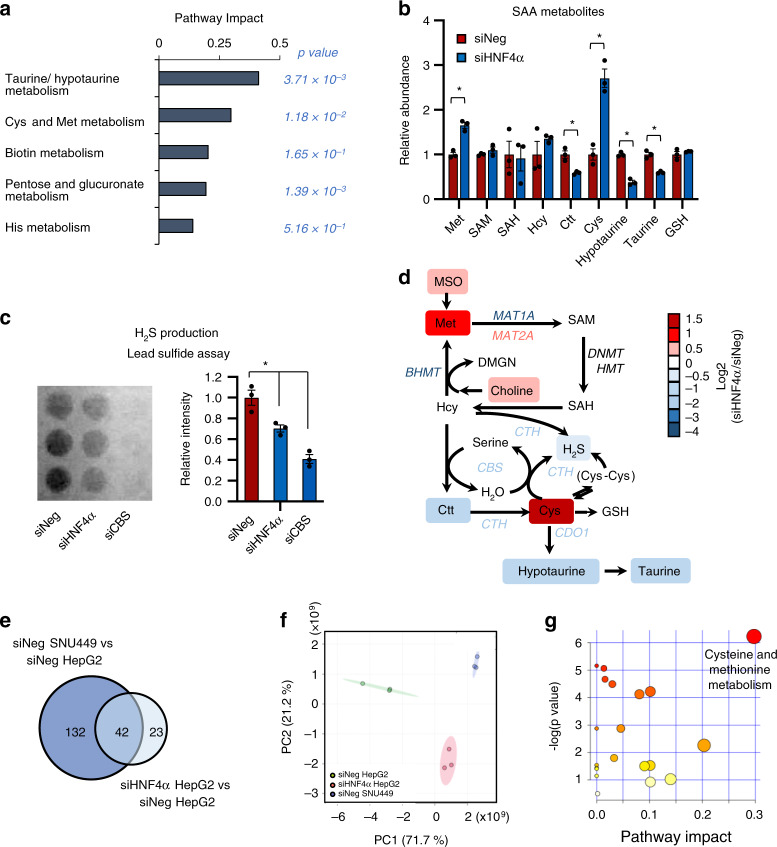
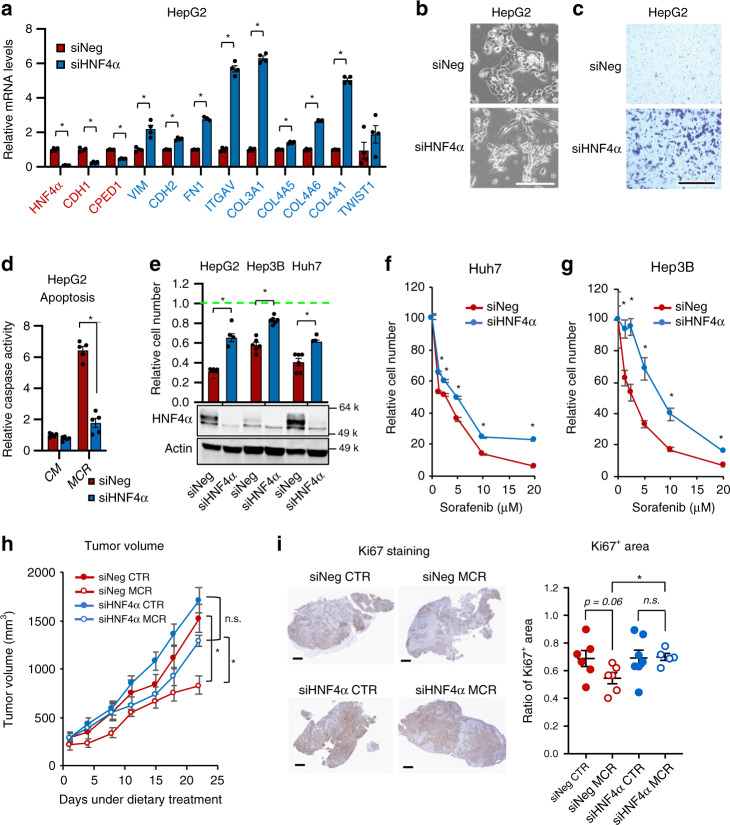
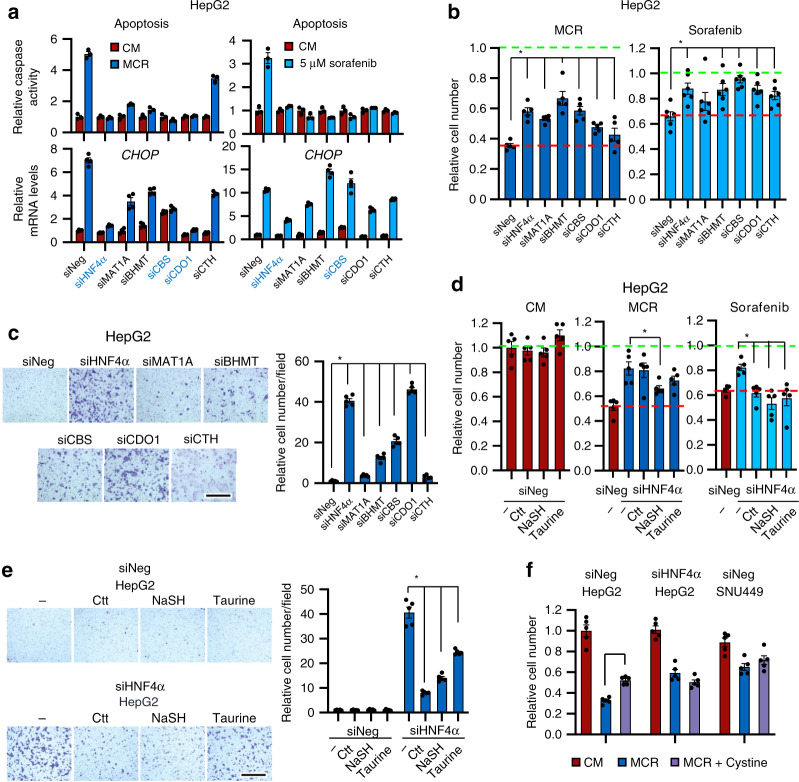
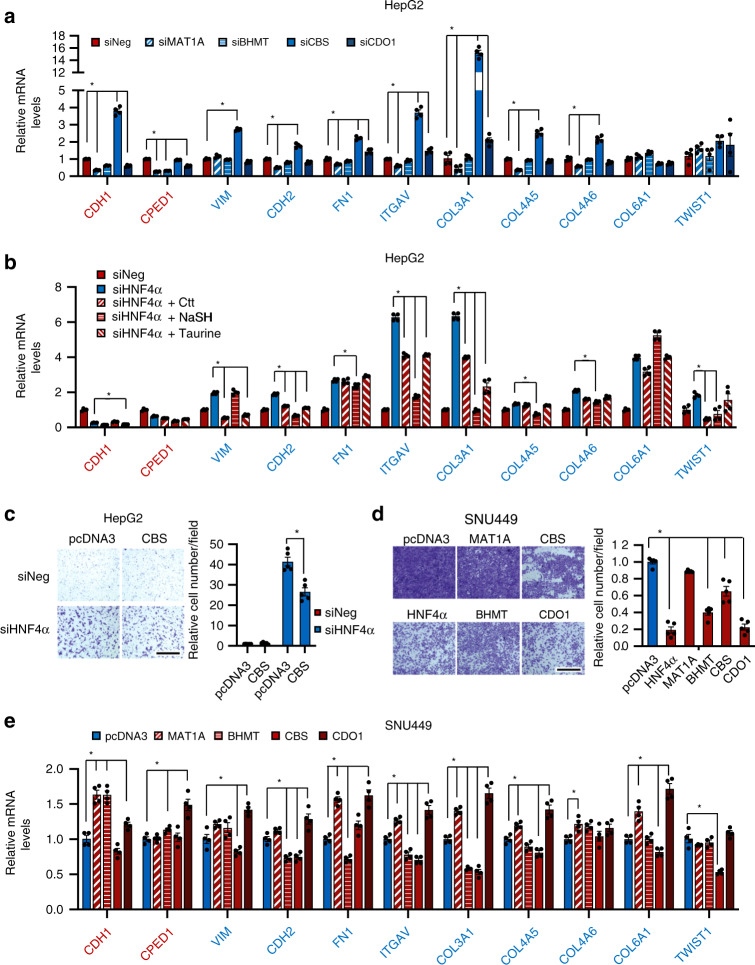
Methionine restriction, a dietary regimen that protects against metabolic diseases and aging, represses cancer growth and improves cancer therapy. However, the response of different cancer cells to this nutritional manipulation is highly variable, and the molecular determinants of this heterogeneity remain poorly understood. Here we report that hepatocyte nuclear factor 4α (HNF4α) dictates the sensitivity of liver cancer to methionine restriction. We show that hepatic sulfur amino acid (SAA) metabolism is under transcriptional control of HNF4α. Knocking down HNF4α or SAA enzymes in HNF4α-positive epithelial liver cancer lines impairs SAA metabolism, increases resistance to methionine restriction or sorafenib, promotes epithelial-mesenchymal transition, and induces cell migration. Conversely, genetic or metabolic restoration of the transsulfuration pathway in SAA metabolism significantly alleviates the outcomes induced by HNF4α deficiency in liver cancer cells. Our study identifies HNF4α as a regulator of hepatic SAA metabolism that regulates the sensitivity of liver cancer to methionine restriction.


Conflict of interest statement

The authors declare no competing interests.

Figures

Fig. 1
Fig. 1. Key SAA metabolic enzymes and HNF4α are correlated in liver cancers.
a SAA metabolic pathways. MAT1A methionine adenosyltransferase 1A, MAT2A methionine adenosyltransferase 2A, MAT2B methionine adenosyltransferase 2B, GNMT glycine N-methyltransferase, SAHH adenosylhomocysteinase, BHMT betaine-homocysteine S-methyltransferase, CBS cystathionine beta-synthase, CTH/CSE cystathionine gamma-lyase, CDO1 cysteine dioxygenase type 1, CSAD cysteine sulfinic acid decarboxylase. Key SAA enzymes investigated in this study are highlighted in orange. b HNF4α is clustered together with key SAA metabolic enzymes in liver cancer patients. The mRNA levels of HNF4α-regulated liver functional genes (Red), mesenchymal markers (Blue), and key SAA metabolic enzymes (Orange) from 373 liver cancer patients from the TCGA LIHC dataset were clustered and represented by the heatmap as described in Methods. c Expression of key SAA metabolic enzymes is positively correlated with HNF4α expression in liver cancer patients (n = 371). The pair-wise Pearson correlation coefficient and the corresponding p-value between two genes were calculated using MATLAB. Two outlier samples in which HNF4α expression levels were more than 3 interquartile ranges (IQRs) below the first quartile among the 373 samples were removed. d Expression of key SAA metabolic enzymes is negatively correlated with TWIST1 expression in liver cancer patients (n = 373). e HNF4α is clustered together with key SAA metabolic genes in liver cancer cells. The mRNA levels of HNF4α-mediated liver genes (Red), mesenchymal markers (Blue), and SAA metabolic enzymes (Orange) from 25 liver cancer cells from CCLE database were clustered and represented by the heatmap using MATLAB as described in Methods. f Expression of MAT1A, CBS and CTH is significantly higher in HNF4α-positive epithelial liver cancer cells than in HNF4α-negative mesenchymal liver cancer cells. The mRNA levels of indicated genes were analyzed using 25 liver cancer cells from the CCLE database (n = 13 epithelial, 12 mesenchymal). g Protein expression of key SAA metabolic enzymes in 3 selected epithelial and 2 mesenchymal liver cancer cell lines (representative immunoblots are shown from at least three independent experiments). For dot plots in f, dots depict individual cell lines, values are expressed as mean ± s.e.m., two-tailed, unpaired, non-parametric Mann-Whitney test, ***p < 0.001, **p < 0.01, *p < 0.05.
Fig. 2
Fig. 2. HNF4α-deficient mesenchymal liver cancer cells have altered SAA metabolism.
a Metabolite sets involved in SAA metabolism are enriched among the metabolites with differential abundance between HNF4α-negative mesenchymal SNU449 cells and HNF4α-positive epithelial HepG2 cells. The 174 metabolites that displayed significantly different abundances between SNU449 and HepG2 cells were subjected for the pathway enrichment analysis (y axis, enrichment p values) and the pathway topology analysis (x axis, pathway impact values, indicative of the centrality and enrichment of a pathway) in the Pathway Analysis module of MetaboAnalyst 4.0 (n = 3 replicates per group, p < 0.05, |FC | > 1.5). The color of a circle is indicative of the level of enrichment significance, with yellow being low and red being high. The size of a circle is proportional to the pathway impact value of the pathway. b SNU449 cells have altered SAA metabolism compared to HepG2 cells. Indicated metabolites were quantified by LC-MS (n = 3 replicates per group). c SNU449 cells have reduced H2S production compared to HepG2 cells. The production of H2S by the indicated number of HepG2 and SNU449 cells was analyzed over 24 h using the lead sulfide assay as described in Methods (n = 3 replicates per group). d SAA metabolic pathway in SNU449 cells relative to HepG2 cells. The log2 ratios of the relative abundance of metabolites and enzymes in indicated pathways in SNU449/HepG2 cells were presented by color scale (n = 3 replicates per group, all colored metabolites were significantly changed in SNU449 cells compared to HepG2 cells with p < 0.05). For graphs in (b, c), values are expressed as mean ± s.e.m., two-tailed, unpaired Student’s t-test, *p < 0.05.
Fig. 3
Fig. 3. HNF4α deficient mesenchymal liver cancer cells are resistant to methionine/cystine restriction-induced and sorafenib-induced cell death.
a Mesenchymal liver cancer cells are resistant to methionine/cystine restriction-induced transcriptional stress response. Five indicated liver cancer cells were cultured in complete medium (CM) or methionine/cystine-restricted medium (MCR) for 6 h. The expression of indicated genes was analyzed by qPCR (n = 4 replicates per group). b Mesenchymal liver cancer cells are resistant to methionine/cystine restriction-induced cell death. Five indicated liver cancer cells were cultured in complete medium (CM) or Met and Cys restricted medium (MR) for 24 h and analyzed by microscopy (representative images were shown from at least three independent experiments). Bar, 100 μm. c Reducing methionine/cystine decreases cell survival in HNF4α-positive epithelial cells but not in HNF4α-negative mesenchymal liver cancer cells. Five liver cancer cells were cultured in medium containing the indicated concentrations of methionine and cystine for 24 h. The relative number of surviving cells was measured by the WST-1 assay (n = 5 replicates for each line; **p < 0.01 between slopes of any HNF4α-positive epithelial cells vs. any HNF4α-negative mesenchymal cells using the semilog line equation in the nonlinear fit regression module of Prism8). d Mesenchymal SNU449 cells are specifically resistant to methionine/cystine-restriction induced cell death. Epithelial Hep3B cells and mesenchymal SNU449 cells were cultured in complete medium or medium depleted of the indicated exogenous amino acid for 24 h. The relative number of surviving cells was measured by the WST-1 assay (n = 4 replicates per group). e Methionine/cystine restriction sensitizes epithelial but not mesenchymal liver cancer cells to sorafenib-induced cell death. Five indicated liver cancer cell lines were cultured in complete medium (CM) or methionine/cystine-restricted medium (MCR), together with the indicated concentrations of sorafenib for 24 h (n = 5 replicates per group). The relative number of surviving cells was measured by WST-1 assay. For graphs in (a, c, d, e), values are expressed as mean ± s.e.m., two-tailed, unpaired Student’s t-test, *p < 0.05.
Fig. 4
Fig. 4. HNF4α regulates the expression of SAA metabolic enzymes in liver cells.
a HNF4α binds to the promoters of SAA metabolic genes. HepG2 cells and SNU449 cells were analyzed by ChIP-qPCR for binding of HNF4α to HNF4α binding sites on the promoters of indicated SAA metabolic genes (n = 4 replicates per group). IgG ChIP in HepG2 cells and anti-HNF4α ChIP in HNF4α-negative SNU449 cells serve as negative controls. b Knockdown of HNF4α in HepG2 cells reduces the mRNA levels of key SAA metabolic enzymes. HepG2 cells were transfected with control siRNA (siNeg) or two independent siRNAs targeting HNF4α (siHNF4α) for 48 h. mRNA levels of the indicated SAA genes were analyzed by qPCR (n = 4 replicates per group). c HNF4α depletion reduces the protein levels of key SAA metabolic enzymes. HepG2 cells were transfected with control siRNA (siNeg) or a siRNA targeting HNF4α (siHNF4α) for 48 h (representative immunoblots are shown from at least three independent experiments). d Knockdown of HNF4α in normal human hepatocytes reduces the mRNA levels of key SAA metabolic enzymes. Normal human hepatocytes were treated and analyzed as in b (n = 4 replicates per group). e Luciferase reporters with mutated HNF4α binding sites from MAT1A, BHMT, and CBS promoters have reduced transactivation in response to HNF4α overexpression in SNU449 cells. HNF4α-negative SNU449 cells were transfected with a control vector (pcDNA3) or a pcDNA3-Flag-HNF4α construct, together with indicated wild type (WT) or mutant (Mut) luciferase reporters. The luciferase activities were measured as described in Methods (n = 3 replicates per group). f Overexpression of HNF4α induces the expression of key SAA metabolic genes in SNU449 cells after treatment with TSA. HNF4α-negative SNU449 cells transfected with a control vector (pcDNA3) or a pcDNA3-Flag-HNF4α construct were treated with 0.5 μM TSA for 2 days, and the expression of the indicated SAA genes was analyzed by qPCR (n = 4 replicates per group). For bar graphs in (a, b, d, e, f), values are expressed as mean ± s.e.m., two-tailed, unpaired Student’s t-test, *p < 0.05.
Fig. 5
Fig. 5. Altered SAA metabolism is a common feature of HNF4α defective and mesenchymal liver cancer cells.
a Metabolite sets related to SAA metabolism are enriched in HNF4α-depleted HepG2 cells. The 65 metabolites significantly altered by HNF4α knockdown in HepG2 cells were analyzed in the Pathway Analysis module of MetaboAnalyst 4.0 as described in Methods (n = 3 replicates per group, p < 0.05, |FC | > 1.5). b HNF4α depletion alters SAA metabolism. Indicated metabolites were quantified by LC-MS (n = 3 replicates per group). c HNF4α depletion reduces H2S production in HepG2 cells. The production of H2S from indicated cells were analyzed over 24 h using the lead sulfide assay as described in Methods. HepG2 cells with knockdown of CBS, a key H2S producing enzyme, were used as a negative control (n = 3 replicates per group). d SAA metabolic pathway in siNeg cells vs. siHNF4α HepG2 cells. The log2 ratios of the relative abundance of metabolites and enzymes in the indicated pathways in siHNF4α/siNeg HepG2 cells are presented by a color scale (n = 3 replicates per group, all colored metabolites were significantly changed with p < 0.05). e HNF4α-depleted HepG2 cells and SNU449 cells have significantly overlapping metabolic profiles (hypergeometric p < 0.05). The indicated significantly altered metabolites between siNeg SNU449 vs. siNeg HepG2 and siHNF4α vs. siNeg HepG2) are visualized by a Venn-diagram (p < 0.05, |FC | > 1.5). f HNF4α depletion shifts HepG2 cells metabolically toward SNU449 cells. All detectable metabolites in siNeg HepG2 cells (green), siHNF4α HepG2 cells (red), and siNeg SNU449 cells (blue) were analyzed by the Principal Component Analysis (PCA). g SAA metabolites are enriched among the commonly altered 34 metabolites in HNF4α-depleted HepG2 cells and SNU449 cells. The 34 metabolites that were altered in the same direction in SNU449 cell and siHNF4α HepG2 were analyzed in the Pathway Analysis module of MetaboAnalyst 4.0 (n = 3 replicates per group, p < 0.05, |FC | > 1.5). The color of a circle is indicative of the level of enrichment significance, with yellow being low and red being high. The size of a circle is proportional to the pathway impact value of the pathway. For graphs in (b, c), values are expressed as mean ± s.e.m., two-tailed, unpaired Student’s t-test, *p < 0.05.
Fig. 6
Fig. 6. HNF4α depletion induces EMT and resistance to sulfur amino acid restriction and sorafenib.
a HNF4α depletion represses epithelial markers while inducing mesenchymal markers. The expression of indicated epithelial (Red) and mesenchymal (Blue) markers was analyzed by qPCR (n = 4 replicates per group). b HNF4α depletion induces mesenchymal morphology. Bar, 200 μm. c HNF4α depletion enhances cell migration. SiNeg and siHNF4α HepG2 cells were subjected to a transwell assay as described in Methods. Bar, 500 μm. d HNF4α depletion confers resistance to MCR induced apoptosis. Indicated cells were cultured in CM or MCR medium for 24 h, then analyzed by Caspase Activity Assay (n = 5 replicates per group). e HNF4α depletion in liver cancer cells induces resistance to MCR. Indicated cells were cultured in CM or MCR medium for 24 h (n = 5 replicates per group). The WST-1 reading in CM was normalized to 1 for each cell line (Green dotted line). fg HNF4α depletion confers resistance to sorafenib-induced cell death in Huh7 and HepB3 cells. Indicated cells were cultured in CM containing the indicated concentrations of sorafenib for 24 h (n = 5 replicates per group). h HNF4α-depleted HepG2 xenograft tumors are resistant to methionine restriction-induced growth inhibition. Mice bearing siNeg and siHNF4α HepG2 xenografted tumors were fed with a control diet (CTR) or methionine-restricted diet (MCR), and tumor volumes were monitored (n = 6 tumors in siNeg CTR, 6 tumors in Neg MCR, 7 tumors in siHNF4α CTR, and 5 tumors in siHNF4α MCR). i HNF4α-depleted HepG2 xenografted tumors are resistant to methionine restriction-induced repression of Ki67. Ki67 in xenografted tumors was immuno-stained and quantified as described in Methods (n = 6 tumors in siNeg CTR, 6 tumors in Neg MCR, 7 tumors in siHNF4α CTR, and 5 tumors in siHNF4α MCR). Representative IHC images are shown, bars: 1 mm. For images in (b, c), representative images are shown from at least three independent experiments. For graphs in (a, d, e, f, g), values are expressed as mean ± s.e.m., two-tailed, unpaired Student’s t-test, *p < 0.05. For plots in (h, i), values are expressed as mean ± s.e.m., two-tailed, unpaired, non-parametric Mann–Whitney test, *p < 0.05. For the dot plot in (i), dots depict individual mice.
Fig. 7
Fig. 7. Transsulfuration metabolic genes affect stress sensitivity and the migration ability of liver cancer cells.
a Knocking down SAA metabolic genes or HNF4α in HepG2 cells confers resistance to MCR-induced and sorafenib-induced stress. Indicated cells were cultured in CM or MCR medium (left) or in CM containing 5 μM sorafenib (right) for 24 h. Apoptosis was analyzed by a caspase activity assay (n = 3 replicates per group) and the expression of CHOP was analyzed by qPCR (n = 4 replicates per group). b Knockdown of SAA metabolic genes or HNF4α in HepG2 cells confers resistance to MCR-induced or sorafenib-induced cell death. Indicated cells were treated as in a (n = 5 replicates per group for MCR and n = 6 replicates per group for sorafenib). The cell number in CM was normalized to 1 (green dotted line), and the cell survival of MCR siNeg cells was denoted by a red dotted line. c Knockdown of SAA metabolic genes or HNF4α in HepG2 cells enhances cell migration. Indicated cells were subjected to a transwell assay as described in Methods (n = 5 replicates per group). The number of migrated siNeg cells was normalized to 1. Bar, 500 μm. d Supplementation of transsulfuration pathway metabolites partially prevents the resistance of HNF4α-depleted cells to MCR and sorafenib. Indicated cells were treated with or without 1 mM Ctt, 1 mM NaSH, or 10 mM taurine for 48 h in CM, then incubated in CM (left), MCR (middle), or CM containing 5 mM sorafenib (right) for additional 24 h. e Supplementation of metabolites in the transsulfuration pathway represses HNF4α depletion-induced cell migration. SiNeg and siHNF4α HepG2 cells were treated and analyzed for cell migration as described in Methods (n = 5 replicates per group). The number of migrated siNeg cells in CM was normalized to 1. Bar, 500 μm. f Addition of cystine partially rescues MCR-induced cell death in HepG2 cells but not in HNF4α-deficient cells. Indicated cells were cultured in CM, MCR, or MCR with 200 μM L-cystine (MCR + cystine) for 24 h (n = 5 replicates per group). For all bar graphs, values are expressed as mean ± s.e.m., two-tailed, unpaired Student’s t-test, *p < 0.05.
Fig. 8
Fig. 8. The transsulfuration pathway regulates EMT and migration of liver cancer cells.
a Knockdown of individual SAA enzymes in HepG2 cells has distinct impacts on expression of epithelial and mesenchymal markers. Indicated HepG2 cells were analyzed for expression of epithelial and mesenchymal markers by qPCR (n = 4 replicates per group). b Supplementation of metabolites in the transsulfuration pathway partially represses the expression of HNF4α depletion-induced mesenchymal markers in HepG2 cells. SiNeg or siHNF4α HepG2 cells were cultured in the complete medium with or without 1 mM Ctt, 1 mM NaSH, or 10 mM taurine and cultured for 48 h. The relative expression levels of the indicated epithelial and mesenchymal markers were analyzed by qPCR (n = 4 replicates per group). c Overexpression of CBS partially inhibits cell migration induced by HNF4α depletion. SiNeg and siHNF4α HepG2 cells were transfected with either an empty vector (pcDNA3) or a pcDNA3-CBS construct expressing CBS. Cells were then analyzed for cell migration in a transwell assay (n = 5 replicates per group). The number of migrated control cells (siNeg + pcDNA3) was normalized to 1. Bar, 500 μm. d Overexpression of SAA metabolic genes or HNF4α represses migration of HNF4α-negative SNU449 cells. SNU449 cells were transfected with either an empty vector (pcDNA3) or a pcDNA3 construct expressing the indicated SAA enzyme. Cells were then analyzed for cell migration in a transwell assay (n = 5 replicates per group). The number of migrated control cells (pcDNA3) was normalized to 1. Bar, 500 μm. e Overexpression of individual SAA enzyme in HNF4α-negative SNU449 cells has distinct impacts on expression of the expression of epithelial and mesenchymal markers. Control (pcDNA3) SNU449 cells, and SNU449 cells overexpressing individual SAA enzyme were analyzed for expression of epithelial and mesenchymal markers by qPCR (n = 4 replicates per group). For all bar graphs, values are expressed as mean ± s.e.m., two-tailed, unpaired Student’s t-test, *p < 0.05.

References

    1. Maddocks OD, et al. Serine starvation induces stress and p53-dependent metabolic remodelling in cancer cells. Nature. 2013;493:542–546. - PMC - PubMed
    1. Gravel SP, et al. Serine deprivation enhances antineoplastic activity of biguanides. Cancer Res. 2014;74:7521–7533. - PubMed
    1. Maddocks ODK, et al. Modulating the therapeutic response of tumours to dietary serine and glycine starvation. Nature. 2017;544:372–376. - PubMed
    1. Kanarek N, et al. Histidine catabolism is a major determinant of methotrexate sensitivity. Nature. 2018;559:632–636. - PMC - PubMed
    1. Knott SRV, et al. Asparagine bioavailability governs metastasis in a model of breast cancer. Nature. 2018;554:378–381. - PMC - PubMed

Publication types

MeSH terms