Ice thickness and volume changes across the Southern Alps, New Zealand, from the little ice age to present
- PMID: 32770050
- PMCID: PMC7415160
- DOI: 10.1038/s41598-020-70276-8
Ice thickness and volume changes across the Southern Alps, New Zealand, from the little ice age to present
Abstract
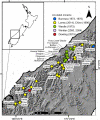
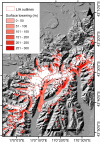
Rapid changes observed today in mountain glaciers need to be put into a longer-term context to understand global sea-level contributions, regional climate-glacier systems and local landscape evolution. In this study we determined volume changes for 400 mountain glaciers across the Southern Alps, New Zealand for three time periods; pre-industrial "Little Ice Age (LIA)" to 1978, 1978 to 2009 and 2009 to 2019. At least 60 km3 ± 12 km3 or between 41 and 62% of the LIA total ice volume has been lost. The rate of mass loss has nearly doubled from - 0.4 m w.e year-1 during 1,600 to 1978 to - 0.7 m w.e year-1 at present. In comparison Patagonia has lost just 11% of it's LIA volume. Glacier ice in the Southern Alps has become restricted to higher elevations and to large debris-covered ablation tongues terminating in lakes. The accelerating rate of ice loss reflects regional-specific climate conditions and suggests that peak glacial meltwater production is imminent if not already passed, which has profound implications for water resources and riverine habitats.
Conflict of interest statement
The authors declare no competing interests.
Figures


References
-
- Raper S, Braithwaite R. Low sea level rise projections from mountain glaciers and icecaps under global warming. Nature. 2006;439:311–313. - PubMed
-
- Gardner AS, Moholdt G, Cogley JG, Wouters B, Arendt AA, Wahr J, Berthier E, Hock R, Pfeffer WT, Kaser G, Ligtenberg SR. A reconciled estimate of glacier contributions to sea level rise: 2003 to 2009. Science. 2013;340(6134):852–857. - PubMed
-
- Zemp M, Huss M, Thibert E, Eckert N, McNabb R, Huber J, Barandun M, Machguth H, Nussbaumer SU, Gärtner-Roer I, Thomson L. Global glacier mass changes and their contributions to sea-level rise from 1961 to 2016. Nature. 2019;568(7752):382. - PubMed
-
- Chen JL, Wilson CR, Tapley BD. Contribution of ice sheet and mountain glacier melt to recent sea level rise. Nat. Geosci. 2013;6(7):549.
-
- Zemp M, Frey H, Gärtner-Roer I, Nussbaumer SU, Hoelzle M, Paul F, Haeberli W, Denzinger F, Ahlstrøm AP, Anderson B, Bajracharya S. Historically unprecedented global glacier decline in the early 21st century. J. Glaciol. 2015;61(228):745–762.
Publication types
LinkOut - more resources
Full Text Sources

