. 2020 Aug 7;11(1):3968.
doi: 10.1038/s41467-020-17679-3.

An equitable redistribution of unburnable carbon

Affiliations

An equitable redistribution of unburnable carbon

Steve Pye et al. Nat Commun. .

Abstract

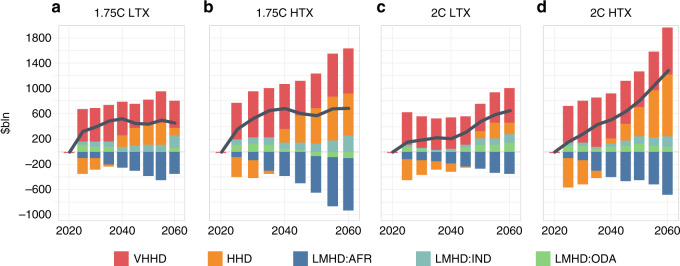
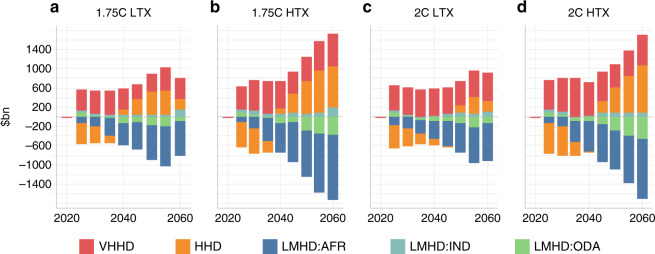
The rapid phase-out of fossil fuels is critical to achieving a well-below 2 °C world. An emerging body of research explores the implications of this phase-out for fossil fuel producing countries, including the perceived tension between least-cost and most-equitable pathways. Here we present modelling, which re-distributes remaining fossil fuel production towards developing countries. We show that redistribution is challenging due to large economic disincentives required to shift production, and offers limited economic benefit for developing countries given the long timeframe required to effect change, and the wider impact of rising fuel import and energy systems costs. Furthermore, increases in production shares are offset by shrinking markets for fossil fuels, which are part dependent on carbon capture and storage (CCS). We argue that while there is a weak economic case for redistribution, there is a clear role for equity principles in guiding the development of supply side policy and in development assistance.


Conflict of interest statement

The authors declare no competing interests.

Figures

Fig. 1
Fig. 1. Change in production levels of fossil fuels under 1.75 and 2 °C redistributed cases relative to the cost-optimal case, 2020–2060.
The left hand panel shows the annual % change in production for a region relative to total global production under the cost-optimal case. Panels (a, b) and (d, e) show the change in gas production under low (LTX) and high tax (HTX) levels for 1.75 °C and 2 °C cases, respectively. Panels (g, h) and (j, k) show the same information for oil production. A positive change reflects a gain in total production in the given region, where, for example, 20% reflects an increase share equivalent to 20% of global production in the cost-optimal case. The right hand panel shows the absolute production levels, necessary for putting the percentage changes (left hand panel) in context. Panels (c) and (f) show the gas production level under low and high tax levels for 1.75 and 2 °C cases, respectively. Panels (i) and (l) show the same information for oil production. See Table 1 for the allocation of regions to the three HDI groups: VHHD, HHD, and LMHD. Source data are provided as a Source data file.
Fig. 2
Fig. 2. Change in regional energy system costs and commodity trade costs under 1.75 and 2 °C HDI-based redistributed cases relative to optimal cases, 2020–2060.
Panels ad represent the change in energy system costs by HDI group, compared with the cost-optimal case. Negative values show a reduction in costs, while the black trend line shows the net change in global costs. Cost estimates do not include tax revenues raised by the production tax, with the focus on the techno-economic costs of the system. Source data are provided as a Source data file.
Fig. 3
Fig. 3. Change in commodity trade costs under 1.75 and 2 °C HDI-based redistributed cases relative to optimal cases, 2020–2060.
Panels ad show the change in commodity trade costs by HDI group, compared with the cost-optimal case, reflecting the balance between export revenues and import costs. The net level is zero in all cases. Negative values show an increase in net exports. Trade cost estimates do not include tax revenues raised by the production tax, with the focus on the techno-economic costs of the system. Source data are provided as a Source data file.
Fig. 4
Fig. 4. Carbon tax levels applied to fossil production in different HDI groups, 2020–2100.
a Different carbon tax level trajectories applied across different HDI groups, with upper side of wedge being high tax variant and lower side of wedge being low variant. b Tax level trajectory variant for more rapid increase in tax levels, where high tax level in 2100 under (a) is implemented by 2050, and then held constant to 2100. Source data are provided as a Source data file.

References

    1. Rogelj, J. et al. in Global Warming of 1.5°C. An IPCC Special Report […] (2018).
    1. McGlade C, Ekins P. The geographical distribution of fossil fuels unused when limiting global warming to 2 °C. Nature. 2015;517:187–190. doi: 10.1038/nature14016. - DOI - PubMed
    1. Ackerman F, DeCanio SJ, Howarth RB, Sheeran K. Limitations of integrated assessment models of climate change. Clim. Change. 2009 doi: 10.1007/s10584-009-9570-x. - DOI
    1. Bradley, S., Lahn, G. & Pye, S. Carbon Risk and Resilience: How Energy Transition is Changing the Prospects for Developing Countries with Fossil Fuels.https://www.chathamhouse.org/publication/carbon-risk-resilience-how-ener... (2018).
    1. United Nations. Adoption of the Paris Agreement. Conference of the Parties on its Twenty-first Session Vol. 21932 https://unfccc.int/resource/docs/2015/cop21/eng/l09r01.pdf (2015).

Publication types