. 2020 Aug 7;10(1):13342.
doi: 10.1038/s41598-020-70165-0.

Thyroid cancer diagnosis by Raman spectroscopy

Affiliations

Thyroid cancer diagnosis by Raman spectroscopy

Marco Sbroscia et al. Sci Rep. .

Abstract

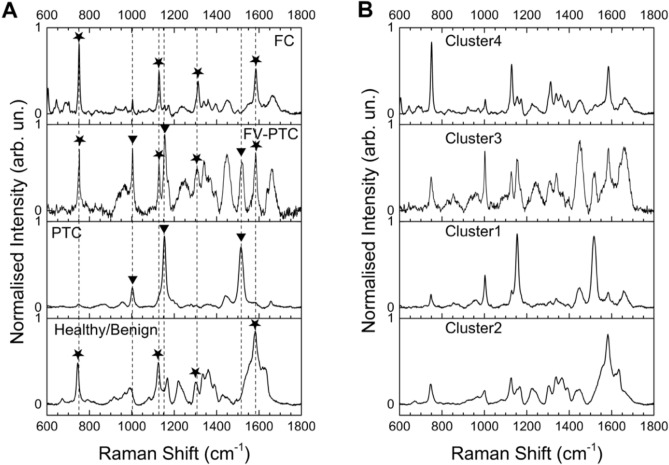
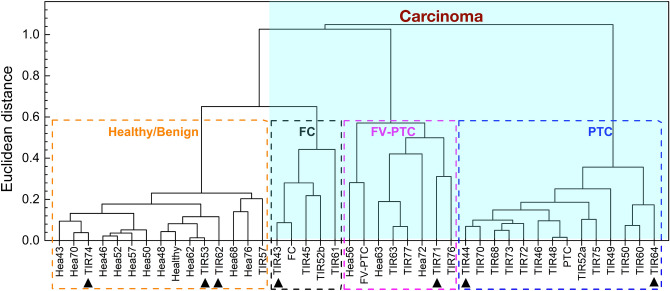
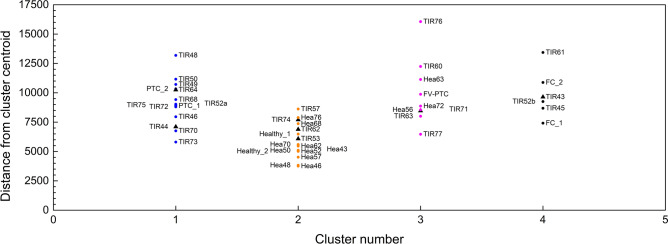
Over the last 50 years, the incidence of human thyroid cancer disease has seen a significative increment. This comes along with an even higher increment of surgery, since, according to the international guidelines, patients are sometimes addressed to surgery also when the fine needle aspiration gives undetermined cytological diagnosis. As a matter of fact, only 30% of the thyroid glands removed for diagnostic purpose have a post surgical histological report of malignancy: this implies that about 70% of the patients have suffered an unnecessary thyroid removal. Here we show that Raman spectroscopy investigation of thyroid tissues provides reliable cancer diagnosis. Healthy tissues are consistently distinguished from cancerous ones with an accuracy of [Formula: see text] 90%, and the three cancer typology with highest incidence are clearly identified. More importantly, Raman investigation has evidenced alterations suggesting an early stage of transition of adenoma tissues into cancerous ones. These results suggest that Raman spectroscopy may overcome the limits of current diagnostic tools.


Conflict of interest statement

The authors declare no competing interests.

Figures

Figure 1
Figure 1
Raman spectra. (A) Typical Raman spectra of the examined thyroid tissues, labelled according to the histology report. Stars label the Raman characteristic peaks of cytochrome c, triangles those of carotenoids. The black vertical dashed lines allow an easier comparison among the spectra. (B) Centroids Raman spectra for the four identified clusters by K-means analysis.
Figure 2
Figure 2
Agglomerative hierarchical clustering analysis. Dendrogram of the Raman spectra of human thyroid tissues, as extracted from the AHCA analysis. Individual samples are represented by the label Hea (for healthy), or TIR (for not healthy) followed by the patient anonymous ID code. Those plotted in Fig. 1A are labelled healthy, FC, FV-PTC and PTC, respectively. Dashed squares identify the four clusters, namely healthy/benign (orange), Follicular carcinoma or FC (black), follicular variant of papillary carcinoma or FV-PTC (magenta) and papillary carcinoma or PTC (blue). The arrows indicate the adenoma samples. All samples within the light blue shaded area are carcinomas.
Figure 3
Figure 3
K-means analysis. Samples distribution within the four KM clusters, as a function of their Euclidean distance from the associated centroid. The same labels and colours as in Fig. 2 have been used. Black triangles refer to adenomas.
Figure 4
Figure 4
Immunohistochemistry images. Microscopic pictures of (A) TIR43 sample stained with immunohistochemistry for Galectin3 (high power field. Hematoxylin counterstained) and (B) TIR64 sample stained with immunohistochemistry for HBME1 (medium power field. Hematoxylin counterstained). Panel (A) shows a mosaic pattern with negative cells intermingled with cells showing positive reaction in cytoplasm as well as in nuclear matrix. Panel (B) shows strong positive reaction due to a microfocus of papillary carcinoma, within the follicular adenoma.
Figure 5
Figure 5
Biochemical analysis. Expression levels of cytochrome c have been assessed in thyroids of five patients; for each patient, the healthy (Hea) and pathological (TIR) slices have been analysed. (A) Levels of cytochrome c have been normalized to actin. Data represent the mean values ± SDs derived from three replicates normalized to healthy counterparts (Student’s t test, *P < 0.05, **P < 0.01 compared with control). (B) Exemplificative images of filters blotted with cytochrome c and actin primary antibodies. Images have been gathered at the same time.
Figure 6
Figure 6
Spread of the individual K-means clusters as a function of their number. Data are reported by using the same colors as in Fig. 2 for the individual clusters. Notice that four clusters give the largest spread among the clusters.

References

    1. Vaccarella S, et al. Worldwide thyroid-cancer epidemic? The increasing impact of overdiagnosis. N. Engl. J. Med. 2016;375:614–617. doi: 10.1056/NEJMp1604412. - DOI - PubMed
    1. Udelsman R, Zhang Y. The epidemic of thyroid cancer in the United States: the role of endocrinologists and ultrasounds. Thyroid. 2014;24:472–479. doi: 10.1089/thy.2013.0257. - DOI - PMC - PubMed
    1. Rusinek D, et al. Current advances in thyroid cancer management. Are we ready for the epidemic rise of diagnoses? Int. J. Mol. Sci. 2017;18:1817. doi: 10.3390/ijms18081817. - DOI - PMC - PubMed
    1. TCGAR Network Integrated genomic characterization of papillary thyroid carcinoma. Cell. 2014;159:676–690. doi: 10.1016/j.cell.2014.09.050. - DOI - PMC - PubMed
    1. Cantara S, et al. Molecular signature of indeterminate thyroid lesions: current methods to improve fine needle aspiration cytology (fnac) diagnosis. Int. J. Mol. Sci. 2017;18:775. doi: 10.3390/ijms18040775. - DOI - PMC - PubMed

Publication types