. 2021 Apr;35(4):1023-1036.
doi: 10.1038/s41375-020-1003-x. Epub 2020 Aug 7.

Decitabine- and 5-azacytidine resistance emerges from adaptive responses of the pyrimidine metabolism network

Affiliations

Decitabine- and 5-azacytidine resistance emerges from adaptive responses of the pyrimidine metabolism network

Xiaorong Gu et al. Leukemia. 2021 Apr.

Abstract

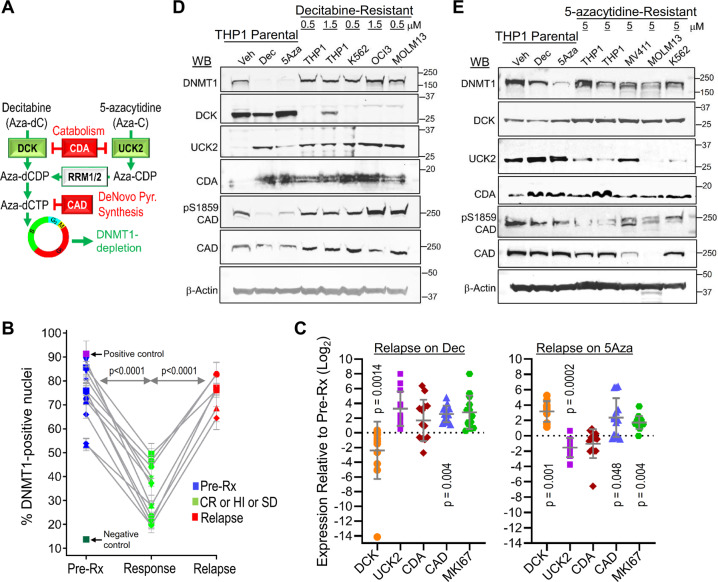
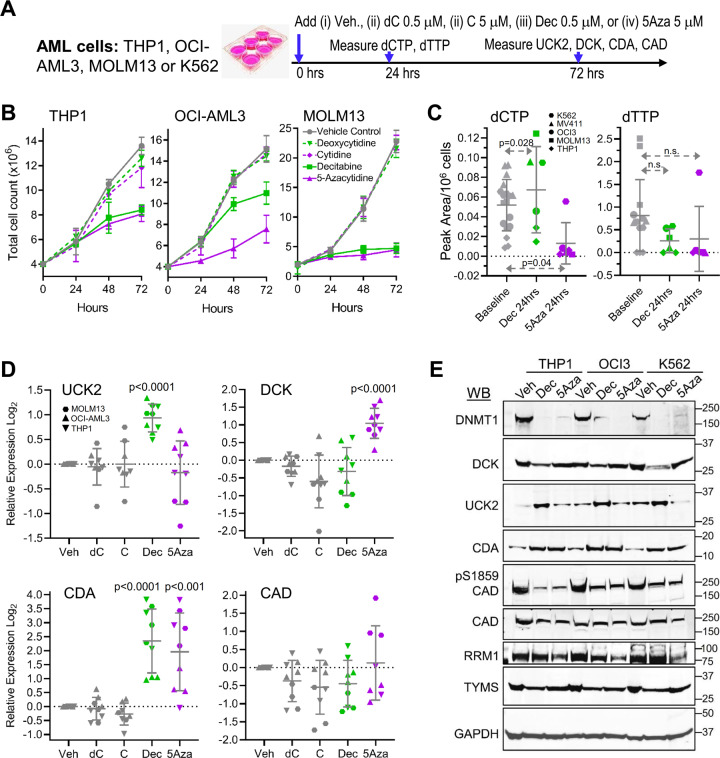
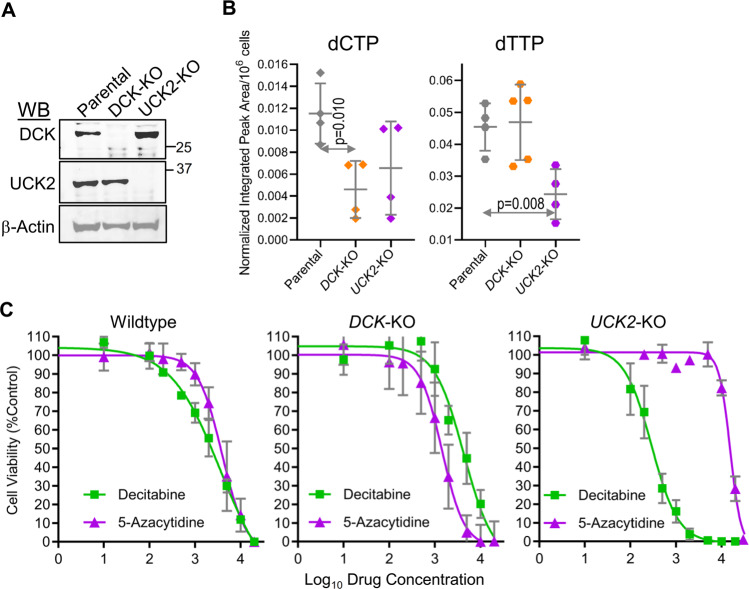
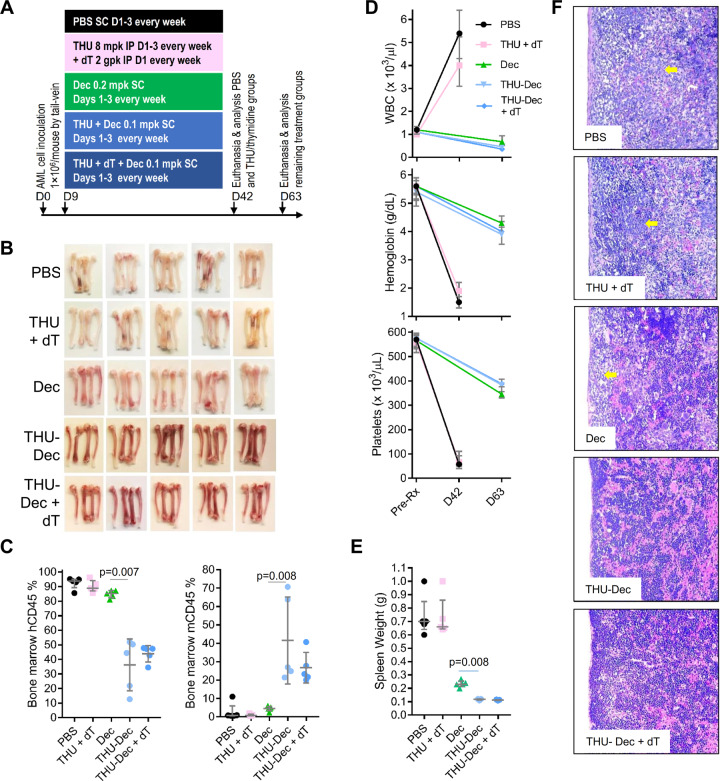
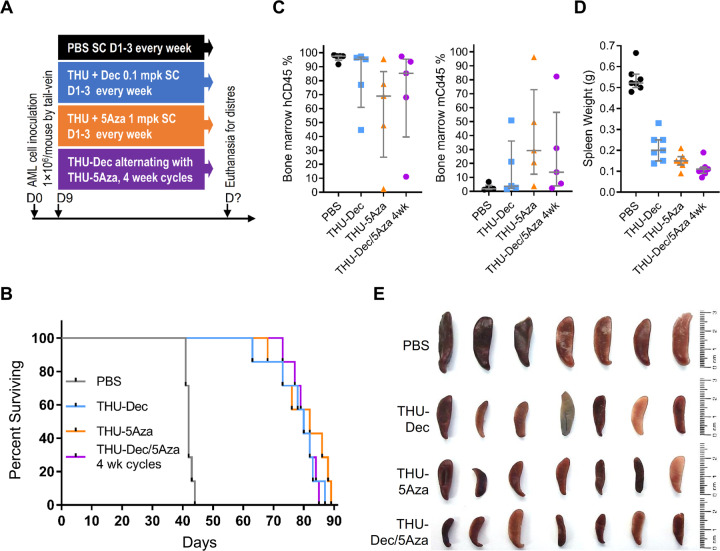
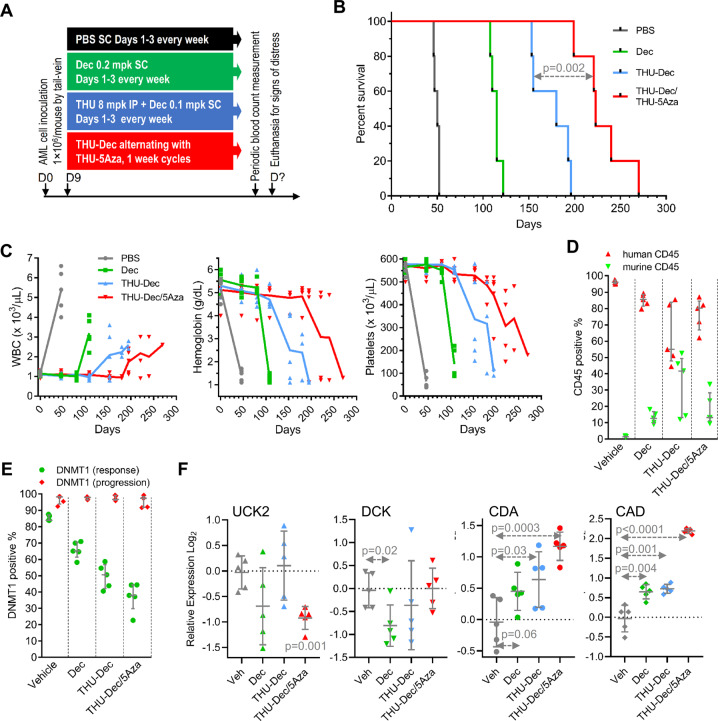
Mechanisms-of-resistance to decitabine and 5-azacytidine, mainstay treatments for myeloid malignancies, require investigation and countermeasures. Both are nucleoside analog pro-drugs processed by pyrimidine metabolism into a deoxynucleotide analog that depletes the key epigenetic regulator DNA methyltranseferase 1 (DNMT1). Here, upon serial analyses of DNMT1 levels in patients' bone marrows on-therapy, we found DNMT1 was not depleted at relapse. Showing why, bone marrows at relapse exhibited shifts in expression of key pyrimidine metabolism enzymes in directions adverse to pro-drug activation. Further investigation revealed the origin of these shifts. Pyrimidine metabolism is a network that senses and regulates deoxynucleotide amounts. Deoxynucleotide amounts were disturbed by single exposures to decitabine or 5-azacytidine, via off-target depletion of thymidylate synthase and ribonucleotide reductase respectively. Compensating pyrimidine metabolism shifts peaked 72-96 h later. Continuous pro-drug exposures stabilized these adaptive metabolic responses to thereby prevent DNMT1-depletion and permit exponential leukemia out-growth as soon as day 40. The consistency of the acute metabolic responses enabled exploitation: simple treatment modifications in xenotransplant models of chemorefractory leukemia extended noncytotoxic DNMT1-depletion and leukemia control by several months. In sum, resistance to decitabine and 5-azacytidine originates from adaptive responses of the pyrimidine metabolism network; these responses can be anticipated and thus exploited.


Conflict of interest statement

Ownership: YS—EpiDestiny. Income: none. Research support: none. Intellectual property: YS—patents around tetrahydrouridine, decitabine and 5-azacytidine (US 9,259,469 B2; US 9,265,785 B2; US 9,895,391 B2), and cancer differentiation therapy (US 9,926,316 B2). The other authors declare that they have no conflict of interest.

Figures

Fig. 1
Fig. 1. DNMT1 is not depleted at clinical or in vitro resistance.
a Schema shows key pyrimidine metabolism enzymes that favor (green) or impede (red) decitabine (Dec) or 5-azacytidine (5Aza) conversion into DNMT1-depleting Aza-dCTP. dCDP = deoxycytidine diphosphate; CDP = cytidine diphosphate; dCTP—deoxycytidine triphosphate. b Dec or 5Aza decreased bone marrow DNMT1 at clinical response (green) versus pretreatment (dark blue) but not at relapse (red). Serial bone marrow biopsies from the same patent were cut onto the same slide, stained for DNMT1, and the number of DNMT1-positive nuclei was quantified objectively using ImageIQ software (n = 13 patients; positive/negative controls were wild-type and DNMT1-knockout HCT116 tissue blocks respectively). Pre-Rx = pretreatment; HI = hematologic improvement; CR = complete remission; SD = stable disease. Mean ± SD of ≥3 image segments (cellular regions) per sample; p value paired t-test, two-sided. c Pyrimidine metabolism enzyme expression at relapse on Dec or 5Aza. Bone marrow cells aspirated pretreatment and at relapse/progression on Dec (13 patients, median duration of therapy 175 days, range 97–922) or 5Aza (14 patients, median duration of therapy 433 days, range 61–1155) were analyzed by QRT-PCR. Mean ± SD, paired t-test, two-sided. d, e DNMT1 and pyrimidine metabolism enzyme protein expression in Dec- or 5Aza-resistant AML cells. We selected for AML cells THP1, K562, MOLM13, and OCI-AML3 or MV411 growing exponentially through Dec or 5Aza at the indicated concentrations. Parental THP1 AML cells treated with vehicle, Dec 0.25 µM or 5Aza 2.5 µM were included for comparison purposes. Primary antibodies for P-S1859 and total CAD were both rabbit and thus probed on separate gels/blots. CDA analysis was in nuclear fractions. Equal loading was confirmed for all Western blots.
Fig. 2
Fig. 2. Dec and 5Aza cause nucleotide imbalances and automatic metabolic compensations for this.
a Experiment schema. Vehicle, natural deoxycytidine (dC) 0.5 μM, natural cytidine (C) 5 μM, Dec 0.5 μM, or 5Aza 5 μM were added once to AML cells at 0 h. b Cell counts. By automated counter. Means ± SD for three independent biological replicates for each cell line. c Dec and 5Aza have opposite effects on dCTP levels. Measured by LCMS/MS 24 h after addition of Dec or 5Aza. Analyses of two or more independent nucleotide extractions from three different AML cells lines. Means ± SD; p values paired t-test, one-sided. d Gene expression 72 h after Dec or 5Aza. Gene expression by QRT-PCR, relative to average expression in vehicle-treated controls. Means ± SD for three independent biological replicates in each of three AML cell lines; p values unpaired t-test versus vehicle, two-sided. e Western blot 72 h after Dec or 5Aza. AML cells THP1, OCI-AML3, and K562. Western blots were reproduced in three independent biological replicates.
Fig. 3
Fig. 3. DCK is important for maintaining dCTP and UCK2 for maintaining dTTP levels.
a DCK and UCK2 knockout (KO) were confirmed by Western blot. HAP1 leukemia cells, KO by CRISPR-Cas9. b DCK-KO lowers dCTP and UCK2-KO lowers dTTP. Analysis of independent nucleotide extractions. Means ± SD; p values unpaired t-test, two-sided. c Sensitivity of Wildtype, DCK-KO and UCK2-KO HAP1 leukemia cells to Dec versus 5Aza. Means ± SD of three independent biological replicates.
Fig. 4
Fig. 4. Impact on efficacy of adding inhibitors of CDA and/or de novo pyrimidine synthesis.
NSG mice were tail-vein inoculated with patient-derived AML cells (1 × 106 cells/mouse) and randomized to (i) PBS vehicle; (ii) CDA-inhibitor (intra-peritoneal [IP] THU)+ de novo pyrimidine synthesis inhibitor (IP thymidine [dT]); (iii) Dec; (iv) THU + Dec; (v) THU + Dec + dT (n = 5/group). PBS and THU + dT mice were euthanized for distress on D42, and other mice were sacrificed for analysis on D63. a Experiment schema. b Femoral bones. White = leukemia replacement, reddish = functional hematopoiesis. c Bone marrow human (hCD45) and murine (mCd45) myelopoiesis content. Flow-cytometry. Median ± IQR. p value Mann–Whitney test two-sided. d Blood counts pretreatment and at euthanasia/sacrifice. Measured by Hemavet. Median ± IQR. e Spleen AML burden (spleen weights) at euthanasia/sacrifice. Median ± IQR. p value Mann–Whitney test two-sided. f Spleen histology. Hematoxylin-Eosin stain of paraffin-embedded sections. Magnification ×400. Leica DMR microscope.
Fig. 5
Fig. 5. Comparison of THU + Dec alone versus THU + 5Aza alone versus THU + Dec alternating with THU + 5Aza in 4 week cycles.
NSG mice were tail-vein inoculated with patient-derived AML cells (1 × 106 cells/mouse) and on Day 9 after inoculation randomized to the treatments as shown (n = 7/group). Mice were euthanized if there were signs of distress. a Experiment schema; b Time-to-distress and euthanasia. c Bone marrow human (hCD45) and murine (mCd45) myelopoiesis content. Femoral bones flushed after euthanasia. Measured by flow-cytometry. Median ± IQR. d Spleen weights at time-of-distress/euthanasia. Median ± IQR. e Spleens at the time-of-distress/euthansia.
Fig. 6
Fig. 6. Alternating THU + Dec with THU + 5Aza week to week.
NSG mice were tail-vein inoculated with patient-derived AML cells (1 × 106 cells/mouse) and randomized to the treatments shown (n = 5/group). Blood counts were obtained periodically by tail-vein phlebotomy. Mice were euthanized for signs of distress. a Experiment schema; b Time-to-distress. Log-rank test. c Serial blood counts. Measured by Hemavet. Median ± IQR. d Bone marrow replacement by AML. Bone marrow human and murine CD45 + cells measured by flow-cytometry after euthanasia (time-points b). Median ± IQR. p value Mann–Whitney test two-sided. e DNMT1 was not depleted from AML cells at progression (timepoints b) but was depleted at time-of-response (bone marrow harvested at Day 63 in a separate experiment). Flow cytometry. f Pyrimidine metabolism gene expression in bone marrow AML cells. QRT-PCR using human gene specific primers, bone marrow harvested after euthanasia. p values versus vehicle, unpaired t-test, two-sided.

References

    1. Saunthararajah Y. Key clinical observations after 5-azacytidine and decitabine treatment of myelodysplastic syndromes suggest practical solutions for better outcomes. Hematol Am Soc Hematol Educ Program. 2013;2013:511–21. - PubMed
    1. Vesely J, Cihak A, Sorm F. Characteristics of mouse leukemic cells resistant to 5-azacytidine and 5-aza-2’-deoxycytidine. Cancer Res. 1968;28:1995–2000. - PubMed
    1. Ng KP, Ebrahem Q, Negrotto S, Mahfouz RZ, Link KA, Hu Z, et al. p53 independent epigenetic-differentiation treatment in xenotransplant models of acute myeloid leukemia. Leukemia. 2011;25:1739–50. - PMC - PubMed
    1. Saunthararajah Y, Sekeres M, Advani A, Mahfouz R, Durkin L, Radivoyevitch T, et al. Evaluation of noncytotoxic DNMT1-depleting therapy in patients with myelodysplastic syndromes. J Clin Investig. 2015;125:1043–55. - PMC - PubMed
    1. Tsai HC, Li H, Van Neste L, Cai Y, Robert C, Rassool FV, et al. Transient low doses of DNA-demethylating agents exert durable antitumor effects on hematological and epithelial tumor cells. Cancer Cell. 2012;21:430–46. - PMC - PubMed

Publication types

MeSH terms