. 2021 Jan;28(1):267-282.
doi: 10.1038/s41418-020-0599-8. Epub 2020 Aug 7.

PIAS1 and TIF1γ collaborate to promote SnoN SUMOylation and suppression of epithelial-mesenchymal transition

Affiliations

PIAS1 and TIF1γ collaborate to promote SnoN SUMOylation and suppression of epithelial-mesenchymal transition

Ayan Chanda et al. Cell Death Differ. 2021 Jan.

Erratum in

Abstract

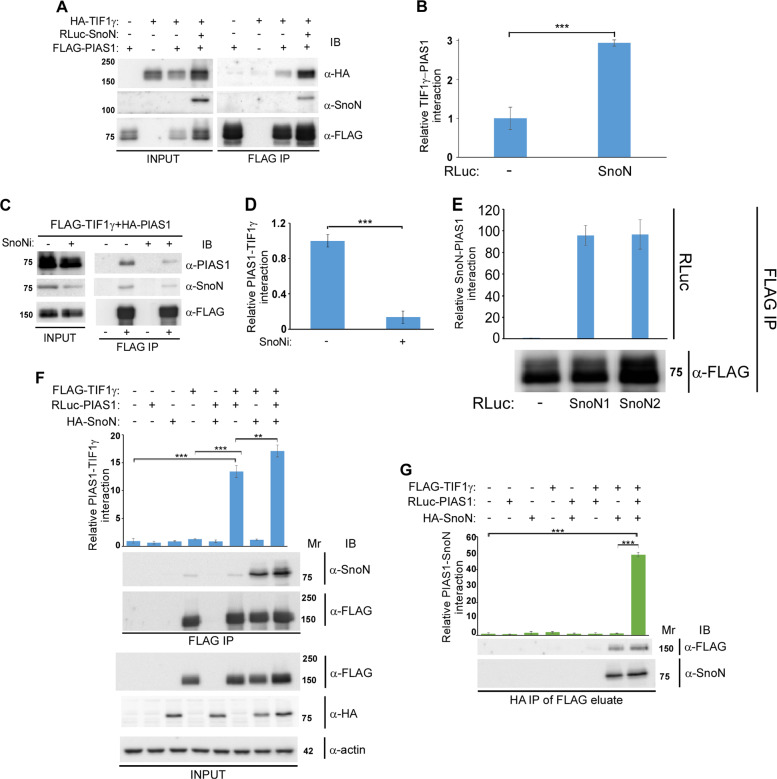
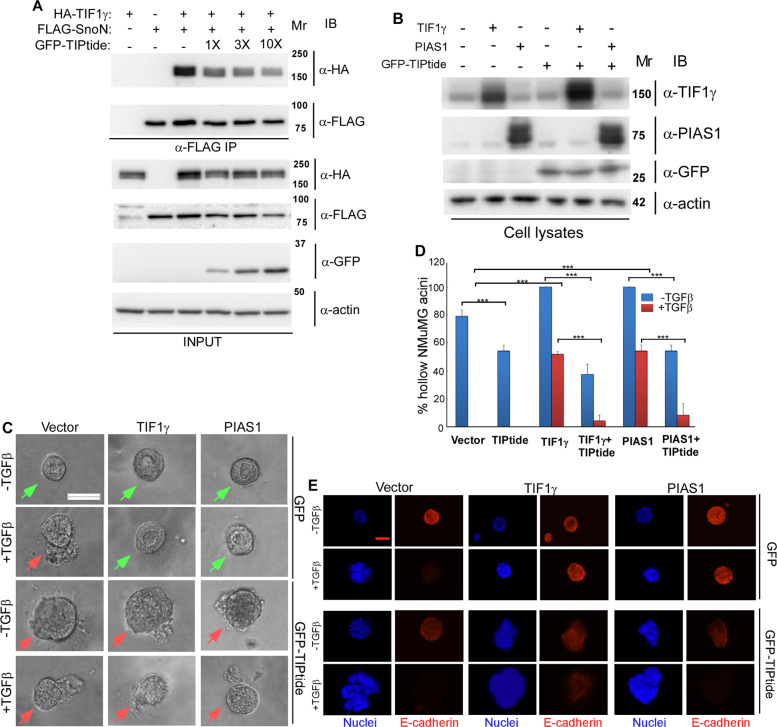
SUMO E3 ligases specify protein substrates for SUMOylation. The SUMO E3 ligases PIAS1 and TIF1γ target the transcriptional regulator SnoN for SUMOylation leading to suppression of epithelial-mesenchymal transition (EMT). Whether and how TIF1γ and PIAS1 might coordinate SnoN SUMOylation and regulation of EMT remained unknown. Here, we reveal that SnoN associates simultaneously with both TIF1γ and PIAS1, leading to a trimeric protein complex. Hence, PIAS1 and TIF1γ collaborate to promote the SUMOylation of SnoN. Importantly, loss of function studies of PIAS1 and TIF1γ suggest that these E3 ligases act in an interdependent manner to suppress EMT of breast cell-derived tissue organoids. Collectively, our findings unveil a novel mechanism by which SUMO E3 ligases coordinate substrate SUMOylation with biological implications.


Conflict of interest statement

ASC is currently employed at Fog Pharma, USA. However, this study is neither funded nor associated in any manner with Fog Pharma. The other authors declare no conflict of interest.

Figures

Fig. 1
Fig. 1. SnoN promotes a TIF1γ–SnoN–PIAS1-containing multiprotein complex.
a Lysates of 293T cells transfected with vector control or a plasmid containing cDNA encoding HA-TIF1γ, FLAG-PIAS1, alone or in combination, together with a plasmid containing cDNA encoding Renilla luciferase (RLuc) (−) alone, or RLuc–SnoN fusion (+), were subjected to PIAS1 immunoprecipitation (α-FLAG IP) followed by TIF1γ (α-HA), SnoN (α-SnoN), and PIAS1 (α-FLAG) immunoblotting (IB). Lysates were subjected to TIF1γ (α-HA), SnoN (α-SnoN), and PIAS1 (α-FLAG) immunoblotting (IB) as the input. b Bar graph represents relative mean ± SEM of coimmunoprecipitated TIF1γ normalized to the protein abundance of PIAS1 in the corresponding immunoprecipitated sample and TIF1γ in the input in the absence or presence of expressed SnoN from three biological replicates including from the data shown in the last two lanes of 1A (Student’s t test: ***P ≤ 0.001). c Lysates of 293T cells transfected with HA-PIAS1 and FLAG-TIF1γ together with a control RNAi vector (−) or one expressing short hairpin RNA (shRNA) targeting SnoN (SnoNi), were subjected to TIF1γ immunoprecipitation using a mouse α-FLAG antibody (+) or a mouse IgG (−) as a negative control, followed by PIAS1 (α-PIAS1), SnoN (α-SnoN), and TIF1γ (α-FLAG) immunoblotting (IB) (right hand side panel). Lysates were subjected to immunoblotting for TIF1γ (α-FLAG), SnoN (α-SnoN), and PIAS1 (α-PIAS1) immunoblotting as the input (left hand side panel). d Bar graph represents relative mean ± SEM of coimmunoprecipitated PIAS1, normalized to the protein abundance of immunoprecipitated TIF1γ and the input PIAS1, in the absence (−) or presence (+) of shRNA targeting endogenous SnoN (SnoNi), from four biological replicates including the one with the data shown in lanes 2 and 4 of right-hand side panel in c (Student’s t test: ***P ≤ 0.001). e Bar graph depicts relative input-normalized SnoN (mean ± SEM, n = 3 biological replicates) interacting with PIAS1 obtained by luciferase measurements of 80% of α-FLAG immunoprecipitation (IP) of lysates of 293T cells co-expressing FLAG-PIAS1 and RLuc alone (−), or in fusion with SnoN or SnoN2. Four percent of lysates (input) and 20% of the PIAS1 immunocomplexes were subjected to luciferase measurements and PIAS1 (α-FLAG) immunoblotting (IB), respectively. f Top panel: bar graph depicts relative input-normalized PIAS1 interaction with TIF1γ (mean ± SEM, n = 4 biological replicates) obtained by subjecting lysates of 293T cells, transfected with control vector (−) or one expressing FLAG-TIF1γ, HA-SnoN, alone or combined, together with a plasmid expressing RLuc only (−) or in fusion with PIAS1 (+), to TIF1γ immunoprecipitation (α-FLAG IP) followed by subjecting 10% of the immunocomplexes and 0.5% of the lysates to luciferase measurements, with the latter serving as the input values (ANOVA: **P ≤ 0.01; ***P ≤ 0.001). Lower panels: representative scans from one of the biological replicates in which 10% of the TIF1γ immunocomplexes were subjected to TIF1γ (α-FLAG) and SnoN (α-SnoN) immunoblotting (IB), and where lysates were subjected to TIF1γ (α-FLAG), SnoN (α-SnoN), and actin (α-actin) immunoblotting as the input, with the latter as a loading control. g Upper panel: bar graph depicts relative input-normalized PIAS1 interaction with SnoN (mean ± SEM, n = 4 biological replicates) obtained by SnoN immunoprecipitation (α-HA) of FLAG peptide eluates of the TIF1γ (FLAG) immunocomplexes of cells transfected and immunoprecipitated as described in a, followed by subjecting the SnoN immunocomplexes to luciferase measurements, with the input from a serving as the input values (ANOVA: ***P ≤ 0.001). Lower panels: representative scans from one of the three biological replicates showing TIF1γ (α-FLAG) and SnoN (α-SnoN) immunoblotting (IB) of 10% of the SnoN immunocomplexes.
Fig. 2
Fig. 2. A PIAS1–TIF1γ protein complex that promotes SnoN SUMOylation.
a NEM-treated lysates of 293T cells transfected with control plasmids, alone or together with plasmids encoding MYC-SnoN or HA-SUMO, alone or together, alone or along with different combinations of plasmids encoding FLAG-TIF1γ, FLAG-PIAS1, short hairpin RNA (sh) targeting PIAS1 (PIAS1i), or shRNA targeting TIF1γ (TIF1γi), were subjected to SnoN immunoprecipitation (α-MYC IP) followed by SUMO (α-HA) and SnoN (α-SnoN) immunoblotting. Lysates were subjected to TIF1γ, SnoN, PIAS1, and actin immunoblotting as the input, with the latter as a loading control. b The bar graph represents the mean ± SEM of proportion of SUMOylated SnoN relative to unmodified SnoN quantified from HA and SnoN immunoblots of SnoN immunoprecipitation and expressed relative to the proportion of SUMOylated SnoN in lysates of cells transfected with MYC/SnoN and HA/SUMO along with empty vectors as a control (lane 4). The data are from three biological replicates including from the replicate whose data are shown in a (ANOVA: **P ≤ 0.01; ***P ≤ 0.001).
Fig. 3
Fig. 3. PIAS1 and TIF1γ act reciprocally to suppress EMT in mammary epithelial cell-derived organoids.
a PIAS1, TIF1γ, and actin immunoblotting of lysates of NMuMG cells expressing PIAS1, TIF1γ, PIAS1i, and TIF1γi alone or together, and which were used to generate three-dimensional organoids shown in bd. b Representative DIC light microscopy micrographs of untreated or 100pM TGFβ-treated 8-day-old organoids derived from NMuMG cells transfected and assessed as in a. Green and red arrows indicate acinar and filled organoids, respectively. c Bar graph depicts mean ± SEM proportion of acinar organoids expressed as a percentage of total colonies counted for each experimental condition from three biological replicates including the replicates with data shown in b. d Representative fluorescence microscopy scans of E-cadherin-(red) and nuclei-(blue) stained fixed 8-day-old three-dimensional organoids derived from NMuMG cells transfected and assessed in a, b. e PIAS1, FLAG, and actin immunoblotting of lysates of NMuMG cells expressing PIAS1, FLAG-TIF1γ, PIAS1CS, and FLAG-TIF1γΔC alone or together, and which were used to generate three-dimensional organoids shown in fh. f Representative DIC light microscopy micrographs of untreated or 100pM TGFβ-treated 8-day-old organoids derived from NMuMG cells transfected and assessed as in e. Green and red arrows indicate acinar and filled organoids, respectively. g Bar graph depicts mean ± SEM proportion of acinar organoids expressed as a percentage of total colonies counted for each experimental condition from three biological replicates including the replicates with data shown in f. h Representative fluorescence microscopy scans of E-cadherin-(red) and nuclei-(blue) stained fixed 8-day-old three-dimensional organoids derived from NMuMG cells transfected and assessed in e, f. Statistical difference, ANOVA: **P ≤ 0.01; ***P ≤ 0.001. Scale bar indicates 50 μm.
Fig. 4
Fig. 4. PIAS1–TIF1γ SUMO E3 ligase act via SnoN to suppress TGFβ-induced EMT in NMuMG cell-derived organoids.
a Lysates of 293T cells expressing HA-TIF1γ, FLAG-SnoN, and GFP-TIPtide alone or together were subjected to SnoN immunoprecipitation (FLAG IP) followed by TIF1γ (α-HA) and SnoN (α-FLAG) immunoblotting. Lysates were subjected to immunoblotting for TIF1γ (α-HA), SnoN (α-FLAG), TIPtide (α-GFP), and actin (α-actin) as the input, with the latter as a loading control. b TIF1γ, PIAS1, GFP, and actin immunoblotting of lysates of NMuMG cells expressing TIF1γ, PIAS1, and GFP-TIPtide alone or together, and which were used to generate three-dimensional organoids shown in ce. c Representative DIC light microscopy micrographs of untreated or 100pM TGFβ-treated 8-day-old organoids derived from NMuMG cells transfected and assessed as in b. Green and red arrows indicate acinar and filled organoids, respectively. d Bar graph depicts mean ± SEM proportion of acinar organoids expressed as a percentage of total colonies counted for each experimental condition from three biological replicates including the replicates with data shown in c. e Representative fluorescence microscopy scans of E-cadherin-(red) and nuclei-(blue) stained fixed 8-day-old three-dimensional organoids derived from NMuMG cells transfected and assessed in b, c. Statistical difference, ANOVA: ***P ≤ 0.001. Scale bar indicates 50 μm.
Fig. 5
Fig. 5. PIAS1 and TIF1γ reciprocally regulate TNBC cell-derived organoid invasiveness.
a PIAS1, TIF1γ, and actin immunoblotting of lysates of MDA-MB-231 cells expressing PIAS1, TIF1γ, PIAS1i, and TIF1γi alone or together, and which were used to generate three-dimensional organoids shown in bd. b Representative DIC light microscopy micrographs of untreated or 100pM TGFβ-treated 8-day-old organoids derived from MDA-MB-231 cells transfected and assessed as in a. Green and red arrows indicate non-deformed and disrupted organoids, respectively. c Bar graph depicts mean ± SEM proportion of non-deformed organoids expressed as a percentage of total colonies counted for each experimental condition from three biological replicates including the replicates with data shown in b. d PIAS1, FLAG, and actin immunoblotting of lysates of MDA-MB-231 cells expressing PIAS1, FLAG-TIF1γ, PIAS1CS, and FLAG-TIF1γΔC alone or together, and which were used to generate three-dimensional organoids shown in eg. e Representative DIC light microscopy micrographs of untreated or 100pM TGFβ-treated 8-day-old organoids derived from MDA-MB-231 cells transfected and assessed as in d. Green and red arrows indicate non-deformed and disrupted organoids, respectively. f Bar graph depicts mean ± SEM proportion of non-deformed organoids expressed as a percentage of total colonies counted for each experimental condition from five biological replicates including the replicates with data shown in e. g Representative fluorescence microscopy scans of E-cadherin-(red) and nuclei-(blue) stained fixed 8-day-old three-dimensional organoids derived from MDA-MB-231 cells transfected and assessed in d, e. Statistical difference, ANOVA: ***P ≤ 0.001. Scale bar indicates 50 μm.
Fig. 6
Fig. 6. PIAS1 and TIF1γ act together via SnoN to suppress EMT in TNBC cell-derived organoids.
a TIF1γ, PIAS1, GFP, and actin immunoblotting of lysates of MDA-MB-231 cells expressing TIF1γ, PIAS1, and GFP-TIPtide alone or together, and which were used to generate three-dimensional organoids shown in bd. b Representative DIC light microscopy micrographs of untreated or 100pM TGFβ-treated 8-day-old organoids derived from MDA-MB-231 cells transfected and assessed as in a. Green and red arrows indicate non-deformed and disrupted organoids, respectively. c Bar graph depicts mean ± SEM proportion of non-deformed organoids expressed as a percentage of total colonies counted for each experimental condition from five biological replicates including the replicates with data shown in b. d Representative fluorescence microscopy scans of E-cadherin-(red) and nuclei-(blue) stained fixed 8-day-old three-dimensional organoids derived from NMuMG cells transfected and assessed in b, c. Statistical difference, ANOVA: *P ≤ 0.05; ***P ≤ 0.001. Scale bar indicates 50 μm. The scale bar indicated in the top left image (first image) in d reflects the relative 50 μm ruler of that image and that of other images that do not contain a scale bar. Any other images that display a different length of the 50 μm scale bar reflects images that are scaled down or up relative to the first image.
Fig. 7
Fig. 7. PIAS1–TIF1γ SUMO E3 ligase complex acts via SnoN SUMOylation to suppress EMT in luminal breast cancer cell-derived organoids.
a SnoN and actin immunoblots of lysates of MCF7 cells expressing a control vector (−) or a SnoN specific shRNA (SnoNi), with or without a SnoNi-resistant SnoN expression construct (SnoNres). b Representative DIC light microscopy micrographs of untreated or 100pM TGFβ-treated 8-day-old organoids derived from MCF7 cells transfected and assessed as in a. Green and red arrows indicate hollow center and filled acinis, respectively. c Bar graph depicts mean ± SEM proportion of hollow center acini expressed as a percentage of total colonies counted for each experimental condition from three biological replicates including the one with data shown in b. d Representative fluorescence microscopy scans of E-cadherin-(red) and nuclei-(blue) stained fixed 8-day-old three-dimensional organoids derived from MCF7 cells transfected and assessed in b, c. e PIAS1, TIF1γ, SnoN, and actin immunoblots of lysates of MCF7 cells expressing PIAS1, TIF1γ, SnoNKdR, alone or together. f Representative DIC light microscopy micrographs of untreated or 100pM TGFβ-treated 8-day-old organoids derived from MCF7 cells transfected and assessed as in e. Green and red arrows indicate acinar and filled organoids, respectively. g Bar graph depicts mean ± SEM proportion of acinar organoids expressed as a percentage of total colonies counted for each experimental condition from three biological replicates including the one with data shown in f. h Representative fluorescence microscopy scans of E-cadherin-(red) and nuclei-(blue) stained fixed 8-day-old three-dimensional organoids derived from MCF7 cells transfected and assessed in f, g. Statistical difference, ANOVA: *P ≤ 0.05; ***P ≤ 0.001. Scale bar indicates 50 μm.
Fig. 8
Fig. 8. PIAS1 and TIF1γ act reciprocally to suppress EMT in luminal breast cancer cell-derived organoids.
a PIAS1, FLAG, and actin immunoblotting of lysates of MCF7 cells expressing PIAS1, FLAG-TIF1γ, PIAS1CS, and FLAG-TIF1γΔC alone or together. b Representative DIC light microscopy micrographs of untreated or 100pM TGFβ-treated 8-day-old organoids derived from MCF7 cells transfected and assessed as in a. Green and red arrows indicate acinar and filled organoids, respectively. c Bar graph depicts mean ± SEM proportion of acinar organoids expressed as a percentage of total colonies counted for each experimental condition from three biological replicates including the one with data shown in b. d Representative fluorescence microscopy scans of E-cadherin-(red) and nuclei-(blue) stained fixed 8-day-old three-dimensional organoids derived from MCF7 cells transfected and assessed in a, b. Statistical difference, ANOVA: ***P ≤ 0.001. Scale bar indicates 50 μm. The scale bar indicated in the top left image (first image) in d reflects the relative 50 μm ruler of that image and that of other images that do not contain a scale bar. Any other images that display a different length of the 50 μm scale bar reflects images that are scaled down or up relative to the first image.

Similar articles

Cited by

References

    1. Bettermann K, Benesch M, Weis S, Haybaeck J. SUMOylation in carcinogenesis. Cancer Lett. 2012;316:113–25. doi: 10.1016/j.canlet.2011.10.036. - DOI - PubMed
    1. Palvimo JJ. PIAS proteins as regulators of small ubiquitin-related modifier (SUMO) modifications and transcription. Biochemical Soc Trans. 2007;35:1405–8. doi: 10.1042/BST0351405. - DOI - PubMed
    1. Johnson ES. Protein modification by SUMO. Annu Rev Biochem. 2004;73:355–82. doi: 10.1146/annurev.biochem.73.011303.074118. - DOI - PubMed
    1. Netherton SJ, Bonni S. Suppression of TGFbeta-induced epithelial-mesenchymal transition like phenotype by a PIAS1 regulated sumoylation pathway in NMuMG epithelial cells. PLoS ONE. 2010;5:e13971. doi: 10.1371/journal.pone.0013971. - DOI - PMC - PubMed
    1. Pichler A, Fatouros C, Lee H, Eisenhardt N. SUMO conjugation—a mechanistic view. Biomol Concepts. 2017;8:13–36. doi: 10.1515/bmc-2016-0030. - DOI - PubMed

Publication types

MeSH terms

Substances