. 2021 Jan;28(1):303-319.
doi: 10.1038/s41418-020-0601-5. Epub 2020 Aug 7.

Pyrroline-5-carboxylate synthase senses cellular stress and modulates metabolism by regulating mitochondrial respiration

Affiliations

Pyrroline-5-carboxylate synthase senses cellular stress and modulates metabolism by regulating mitochondrial respiration

Zhaoying Yang et al. Cell Death Differ. 2021 Jan.

Abstract

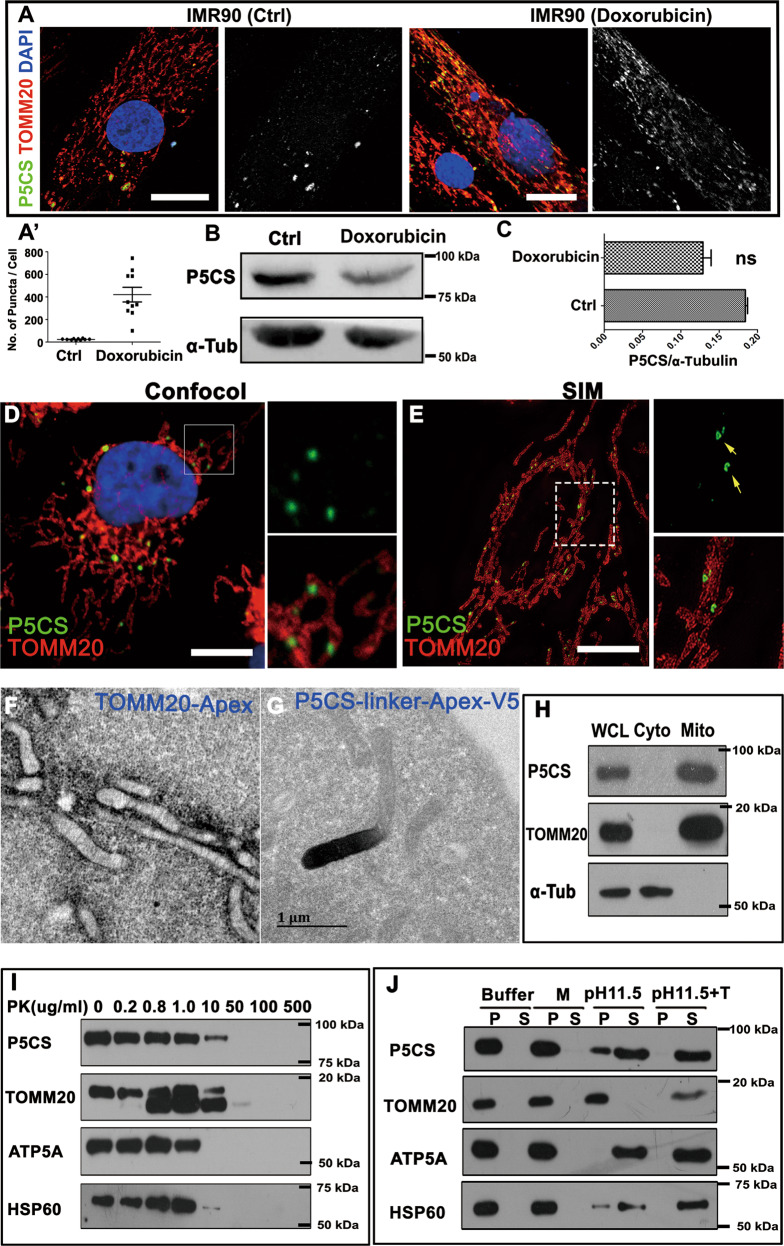
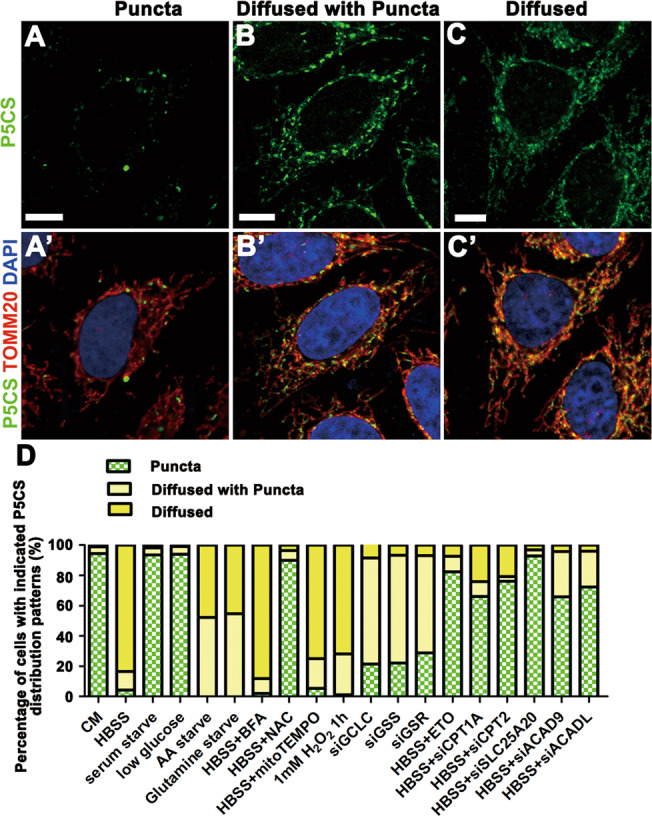
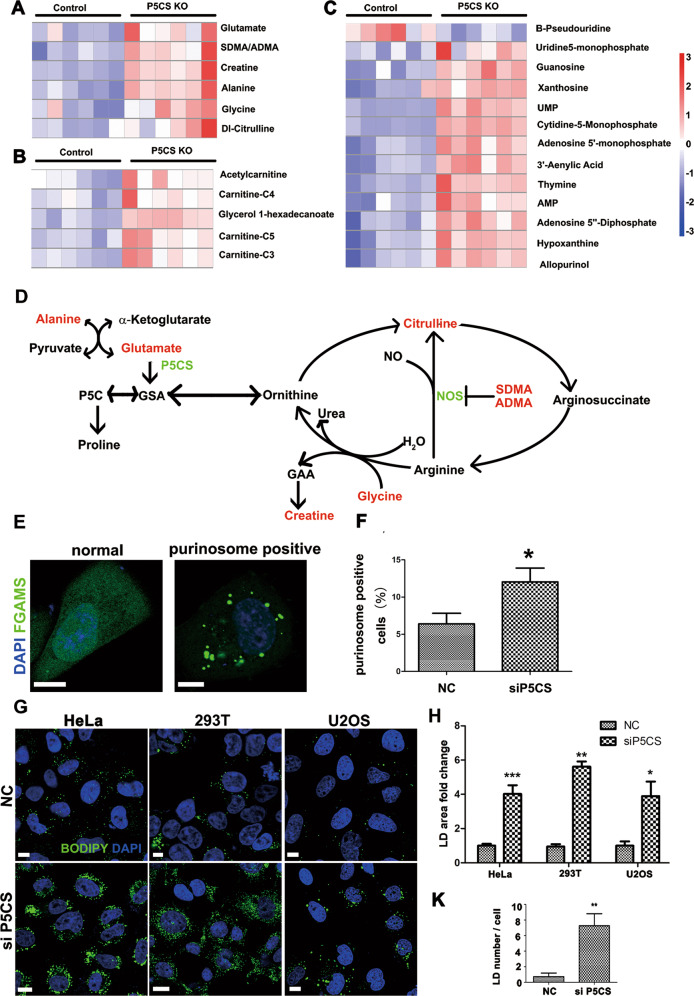
Pyrroline-5-carboxylate synthase (P5CS) catalyzes the synthesis of pyrroline-5-carboxylate (P5C), a key precursor for the synthesis of proline and ornithine. P5CS malfunction leads to multiple human diseases; however, the molecular mechanism underlying these diseases is unknown. We found that P5CS localizes in mitochondria in rod- and ring-like patterns but diffuses inside the mitochondria upon cellular starvation or exposure to oxidizing agents. Some of the human disease-related mutant forms of P5CS also exhibit diffused distribution. Multimerization (but not the catalytic activity) of P5CS regulates its localization. P5CS mutant cells have a reduced proliferation rate and are sensitive to cellular stresses. Flies lacking P5CS have reduced eclosion rates. Lipid droplets accumulate in the eyes of the newly eclosed P5CS mutant flies, which degenerate with aging. The loss of P5CS in cells leads to abnormal purine metabolism and lipid-droplet accumulation. The reduced lipid-droplet consumption is likely due to decreased expression of the fatty acid transporter, CPT1, and few β-oxidation-related genes following P5CS knockdown. Surprisingly, we found that P5CS is required for mitochondrial respiratory complex organization and that the respiration defects in P5CS knockout cells likely contribute to the metabolic defects in purine synthesis and lipid consumption. This study links amino acid synthesis with mitochondrial respiration and other key metabolic processes, whose imbalance might contribute to P5CS-related disease conditions.


Conflict of interest statement

The authors declare that they have no conflict of interest.

Figures

Fig. 1
Fig. 1. P5CS forms rod- and ring-like structures in mitochondria.
a Control (Ctrl) and Doxorubicin-induced senescent IMR-90 cells were fixed and stained with anti-P5CS (green) and anti-TOMM20 (red) antibodies. In control IMR-90 cells, P5CS forms large bright puncta inside mitochondria. In cells induced to undergo senescence by treatment with doxorubicin, P5CS became diffused. a′ is a quantification of the P5CS puncta numbers per cell in the cells with indicated treatments. b, c The expression levels of P5CS in Ctrl and senescent IMR-90 cells were comparable. α-tubulin served as the loading control. c Statistical analysis of b. Data were presented as mean + SEM, n = 3. d Confocal image of HeLa cells stained with anti-P5CS (green) and anti-TOMM20 (red) antibodies indicates that P5CS forms puncta inside the mitochondria. e SIM image of HeLa cells stained with anti-P5CS (green) and anti-TOMM20 (red) antibodies indicates that P5CS localizes in mitochondria with a rod and ring-like pattern. f TEM image of HeLa cells expressing mitochondrial outer membrane protein TOMM20 tagged with Apex at the C-terminus. DAB reaction product was restricted to the surface of mitochondria. g TEM image of HeLa cells expressing P5CS tagged with Apex at the C-terminus. DAB reaction product was restricted to the matrix of mitochondria. h Cell fractionation assay of HeLa cells indicates that endogenous P5CS was enriched in a mitochondria fraction positive for TOMM20. WCL whole cell lysate, Cyto cytoplasm, Mito mitochondrion. i PK digestion experiments show that endogenous P5CS has similar digestion patterns to those of the mitochondrial matrix protein HSP60. j Alkaline carbonate extraction assay shows that majority of P5CS, ATP5A, and HSP60 could be released to the supernatant with pH 11.5 sodium carbonate buffer treatment, while membrane-integrated protein TOMM20 cannot be released. M: purified mitochondria suspended in isotonic buffer; buffer: mock-treated buffer; pH 11.5: pH 11.5 sodium carbonate buffer; pH 11.5 + T: pH 11.5 sodium carbonate buffer with Triton X-100; P: pellet; S: supernatant. Scale bar: 10 μm.
Fig. 2
Fig. 2. The dimerization domains are required for P5CS puncta patterns.
a–i′ HeLa cells expressing V5-tagged wild-type or diseases-related mutant forms of P5CS were fixed and stained with anti-V5 and anti-HSP60 antibody. For some mutant forms of P5CS, two different distribution patterns (puncta or diffused) were observed. The ratios of cells with typical P5CS distribution patterns were labeled at the bottom of images. j–j″ HeLa cells expressing Myc-tagged P5CSR138Q and V5 tagged wildtype P5CS together were fixed and stained with anti-Myc (green) and anti-V5 (red) antibody. Three different patterns were observed: diffused in mitochondria (similar to P5CSR138Q expression alone, 38%); puncta in mitochondria (similar to P5CSWT expression alone, 11%), and a diffused pattern with some puncta (51%). k Co-IP experiments showed that both P5CS-Myc and P5CSR138Q-Myc could pull down P5CS-V5 when they were co-expressed in Hela cells. l A schematic diagram indicated the domain organization of human P5CS and the truncation forms that were made in this study. m–p HeLa cells expressing the indicated V5-tagged truncation forms of P5CS were fixed and stained with anti-V5 and anti-HSP60 antibody. For the truncation forms of P5CS, which have two different distributions, the ratio of cells with typical P5CS distribution patterns was labeled at the bottom of images. q–s HeLa cells expressing the enzyme activity dead forms of P5CS (P5CSCD with K76, D247, K311, and C612 mutated to A) were fixed and stained with anti-V5 and anti-HSP60 antibody. Loss of catalytic activity did not affect P5CS distribution patterns. Scale bar: 10 μm.
Fig. 3
Fig. 3. P5CS diffuses throughout the mitochondria upon oxidative stress.
Hela cells with indicated treatments (d) were fixed and stained with anti-P5CS (green) and anti-TOMM20 (red) antibodies. DAPI (blue) staining indicates the nuclei. a–c′ The typical distributions of P5CS were shown. a, a′ Puncta. b, b′ Diffused with puncta. c, c′ Diffused. ac showed the green channels (P5CS). a′–c′ showed the merged channels. d is the quantification of the proportions of cells with different P5CS patterns when the cells were treated with indicated treatments. CM: complete medium; AA: amino acid; si: RNAi knockdown. Scale bar: 10 μm.
Fig. 4
Fig. 4. Loss of P5CS leads to increased sensitivity to stress and neurodegeneration.
a A schematic diagram indicated the CRISPR/Cas9 knockout strategy in cultured HeLa cells. The gRNA targeting human ALDH18A1 was underlined. The indel of the isolated knockout (KO) cell line was indicated. Position of the premature stop codon resulted from the indel was indicated in the diagram. b Western blot confirmed the loss of P5CS protein from the KO cells. Ctrl: control. c The proliferation rates of the control cells (Ctrl) and P5CS KO (KO) cells in complete medium (CM) were measured and normalized by dividing the cell numbers at indicated time points to the cell numbers at 0 h. d The proliferation rates of Ctrl and P5CS KO cells in HBSS were measured and normalized. Data were presented as mean + SEM, n = 3. e A schematic diagram indicated the CRISPR/Cas9 knockout strategy in flies. The gRNA targeting CG7470 (dP5CS) was underlined. The indels of the isolated strains was indicated. Positions of the premature stop codon resulted from the indels were indicated in the diagram. f The eclosion rates of the heterozygous and homozygous dP5CS67 were measured. The data was presented as mean ± SEM, n = 10 groups, each group contains at least 30 animals. g The retina of the wild-type (WT) and homozygous dP5CS67 mutant flies were analyzed by TEM at day 1 and day 30. h The numbers of the rhabdomeres per ommatidia were counted and plotted. The 30 days old dP5CS67 mutant flies have reduced rhabdomeres than the age-matched controls. i The numbers of lipid droplets per ommatidia in 1-day-old WT and homozygous dP5CS67 mutant flies were quantified. The data were presented as mean + SEM, n = 30.
Fig. 5
Fig. 5. Loss of P5CS leads to multiple metabolic defects.
A quasi-target metabolomics analysis of controls and P5CS KO cells was performed. Six independent samples for each genotype were analyzed and the data were presented as heat map. Upregulated and downregulated metabolites were indicated by red and blue hues, respectively. Color intensity indicates the expression levels of metabolites as displayed. a Six metabolites were related to proline synthesis and the urea cycle was upregulated in the P5CS KO cells. b Five intermediate metabolites of β-oxidation were increased in P5CS KO cells. c The levels of 13 nucleotides and their derivatives were changed in P5CS KO cells. d A diagram showed the metabolic pathways of proline synthesis and urea cycle. e, f (FGAMS)-mEos was expressed in Hela cells subjected to control and P5CS RNAi treatments. The loss of P5CS increased the number of purinosome-positive cells under normal medium culture conditions. More than 300 cells from three independent samples were quantified. g P5CS was RNAi knockdown in HeLa, 293T, and U2OS cells. Lipid droplets were stained by BODIPY. The reduction of P5CS increased lipid droplets in the cells. h The quantification of the fold changes of LD area upon P5CS RNAi in three different cell types. Data were presented as mean + SEM, n = 5 images (more than100 cells for each genotype were counted). i–j″ TEM analysis of the control HeLa cells and HeLa cells (i, i′) with P5CS RNAi knockdown (j, j″). Mitochondrial morphology did not change significantly upon the reduction of P5CS (i′, j″). Red arrows indicated mitochondria. P5CS KO cells accumulated large amount of lipid droplets (j, j′). k The quantification of the numbers of LDs per cell in the TEM analysis. Data were presented as mean + SEM, n = 11 cells. l–n LDs were accumulated in P5CS KO cells, which could be rescued by introduction of wild-type P5CS into the KO cells. o is the quantification of the fold changes of LD area in the cells with indicated genotypes. Data were presented as mean + SEM, n = 5 groups (more than 100 cells for each genotype were counted). p–r HeLa cells transfected with V5 tag empty vector (V5), P5CSR138Q-V5, or P5CS-V5 were stained with anti-V5 antibody and BODIPY. Overexpression of, P5CSR138Q-V5 but not P5CS-V5 led to accumulation of lipid droplets. s is the quantification of the fold changes of LD area in the cells with indicated genotypes. Data were presented as mean + SEM, n = 5 groups (more than 100 cells for each genotype were counted). Scale bar for the immunofluorescence images: 10 μm.
Fig. 6
Fig. 6. P5CS loss inhibits fatty acid β-oxidation.
a A diagram showed the key enzymes in TAG synthesis and lipolysis pathway. b A scheme showed the experimental strategies to measure the consumption of LDs. HeLa cells treated with DGAT1 and DGAT2 inhibitors 24 h after mock treatment or P5CS knockdown. Stained with BODIPY and observed at different time points after the drug treatment. c The consumption of LDs is decreased in P5CS-deficient cells. b′ A scheme showed the experimental strategies to measure the rate of lipid-droplet formation. HeLa cells treated with DGAT1/2 inhibitors when P5CS RNAi knockdown was initiated. Twenty-four hours later, the inhibitors were washed off and an inhibitor of ATGL (ATGLi) was added and LDs were monitored at different time points by BODIPY staining. c′ The rates of lipid-droplet formation were largely the same in the control and P5CS knockdown cells. d–d‴ Quantitative PCRs (q-PCRs) were performed for the indicated genes in control and P5CS RNAi knockdown cells. The expression data are represented as mean ± SEM, n = 3. e Western blot results showed that the protein level of CPT1A was reduced in P5CS knockdown cells. f is the quantification of CPT1A protein level in P5CS knockdown cells. Data were represented as mean + SEM, n = 3. g–g‴ HeLa cells with indicated treatments were stained with BODIPY and DAPI. MCD overexpression partially rescue the accumulation of lipid droplets in P5CS knockdown cells. h is the quantification of the fold change of the area of LDs in the cells with indicated treatments. Data were represented as mean + SEM, n = 5 groups (more than 100 cells for each treatment were analyzed). i, i′ P5CS KO cells cultured with or without addition of proline in the culture medium were stained with BODIPY and DAPI. The addition of proline reduced LD accumulation in P5CS KO cells. j is the quantification of the fold change of the area of LDs in the cells with indicated treatments. Data were represented as mean + SEM, n = 5 groups (more than 100 cells for each treatment were analyzed).
Fig. 7
Fig. 7. P5CS is required for oxidative respiration in mitochondria.
a, b The oxygen consumption rate (OCR) was measured by Seahorse. Basal respiration, ATP production, and maximal respiration were greatly reduced in P5CS KO cells. The OCR defects were partially rescued by the addition of proline to the culture medium. c–c″ The dependency, capacity, and flexibility of cells to oxidize long-chain fatty acids, glucose, and glutamine were determined by measuring mitochondrial OCR in the presence or absence of metabolic pathway inhibitors. The cell’s dependency on glucose but not on fatty acid or glutamine was increased when P5CS was deficient. The capacity of the P5CS KO cells using fatty acids as fuel to meet energy defects was reduced. The capacity of P5CS KO cells using glucose and glutamine did not change. Data are presented as means + SEM, n = 3. d The organization of respiratory complexes was analyzed by BN-PAGE. Complexes were examined by immunoblots with indicated antibodies followed blue native gel separation. The organization of complex I, II, IV, and V are reduced in P5CS KO cells. e Statistical analysis of d. Data were presented as mean + SEM, n = 3. f The protein levels of indicated subunits of respiration complexes were analyzed by western blot. α-Tubulin and TOMM20 functioned as loading control. g Statistical analysis of e. Data were presented as mean + SEM, n = 3. h Inhibition of mitochondrial respiration by treatments with oligomycin or Rotenone together with antimycin A results in increased purinosome formation, which phenocopies the lack of P5CS. i–j HeLa cells with indicated treatments were subjected to staining with BODIPY and DAPI. The respiration complex inhibitors induced lipid-droplet accumulation. j is the quantification of the fold changes of LD area in e. Data were presented as mean + SEM, n = 5 groups (more than 100 cells for each treatment were analyzed).

References

    1. Martinez-Reyes I, Chandel NS. Mitochondrial TCA cycle metabolites control physiology and disease. Nat Commun. 2020;11:102. doi: 10.1038/s41467-019-13668-3. - DOI - PMC - PubMed
    1. Spinelli JB, Haigis MC. The multifaceted contributions of mitochondria to cellular metabolism. Nat cell Biol. 2018;20:745–54. doi: 10.1038/s41556-018-0124-1. - DOI - PMC - PubMed
    1. Kauppila TES, Kauppila JHK, Larsson NG. Mammalian mitochondria and aging: an update. Cell Metab. 2017;25:57–71. doi: 10.1016/j.cmet.2016.09.017. - DOI - PubMed
    1. Sun N, Youle RJ, Finkel T. The mitochondrial basis of aging. Mol Cell. 2016;61:654–66. doi: 10.1016/j.molcel.2016.01.028. - DOI - PMC - PubMed
    1. Perez-Arellano I, Carmona-Alvarez F, Martinez AI, Rodriguez-Diaz J, Cervera J. Pyrroline-5-carboxylate synthase and proline biosynthesis: from osmotolerance to rare metabolic disease. Protein Sci: Publ Protein Soc. 2010;19:372–82. doi: 10.1002/pro.340. - DOI - PMC - PubMed

Publication types

LinkOut - more resources