. 2020 Aug;26(8):1247-1255.
doi: 10.1038/s41591-020-0930-4. Epub 2020 Aug 7.

A combined risk score enhances prediction of type 1 diabetes among susceptible children

Collaborators, Affiliations

A combined risk score enhances prediction of type 1 diabetes among susceptible children

Lauric A Ferrat et al. Nat Med. 2020 Aug.

Erratum in

Abstract

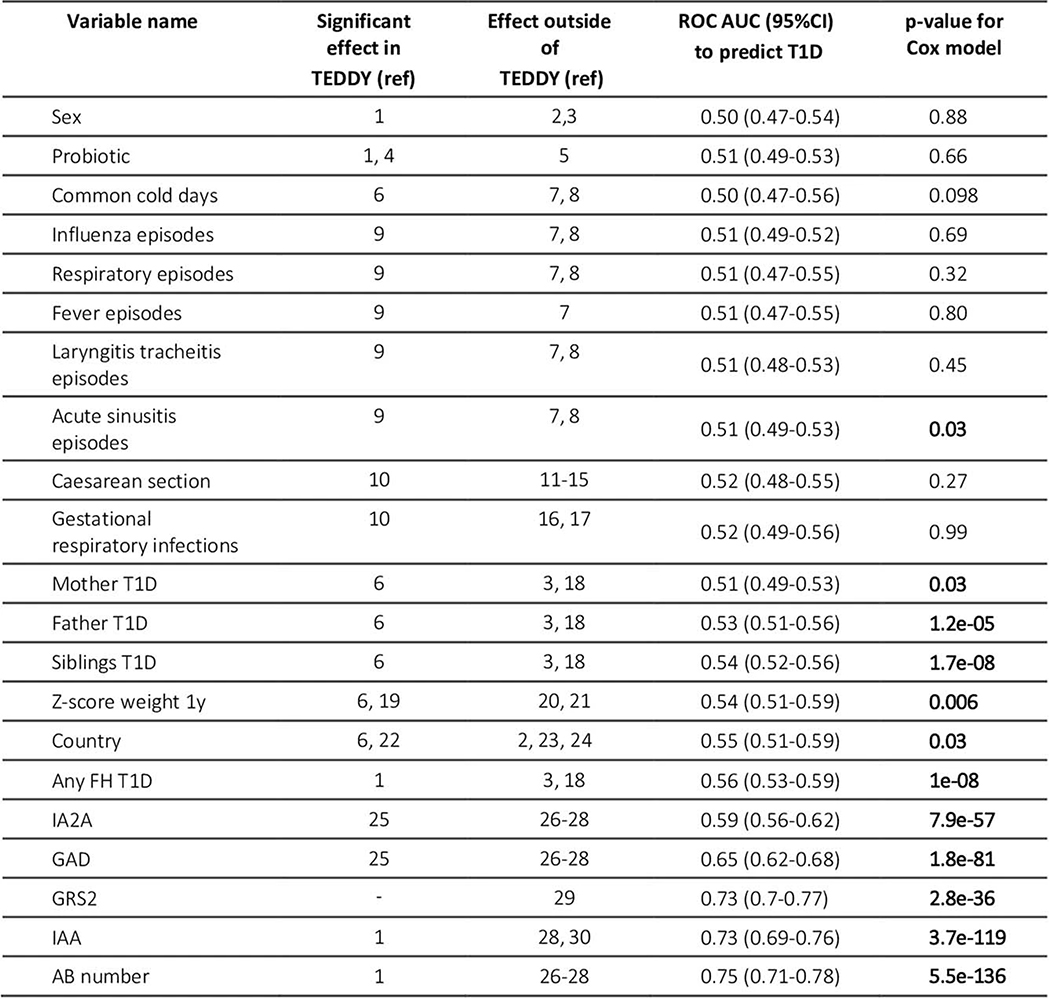
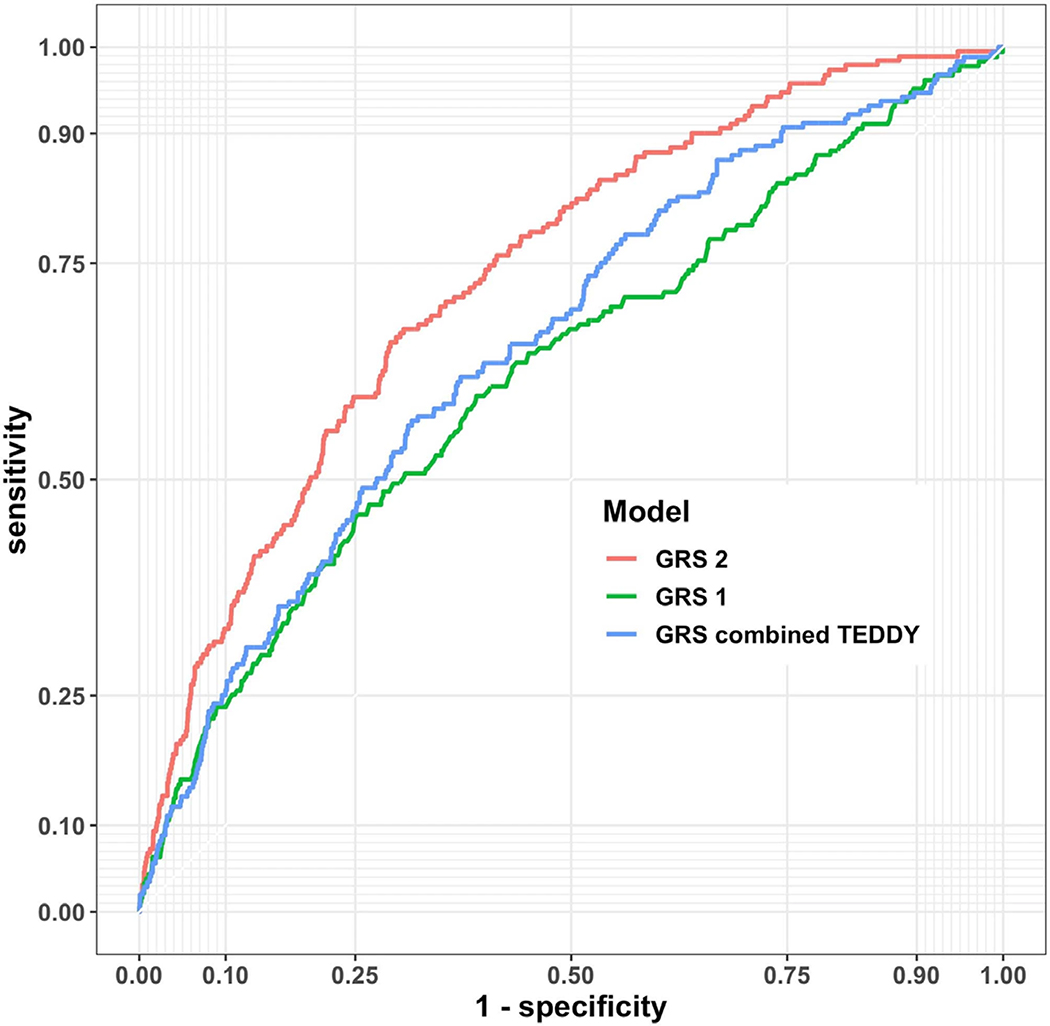
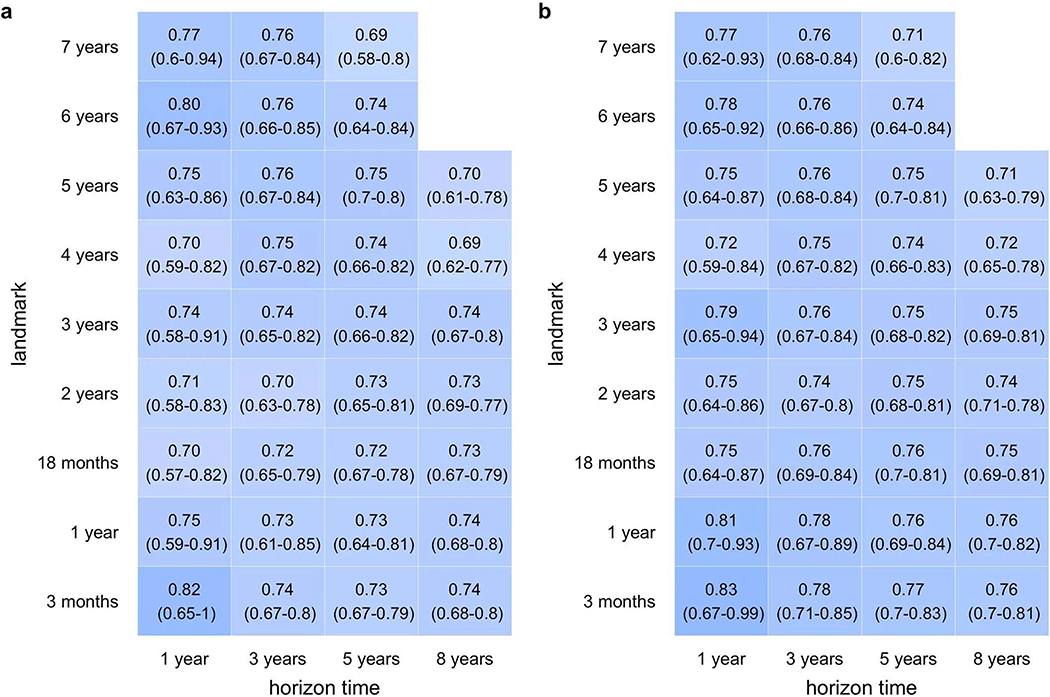
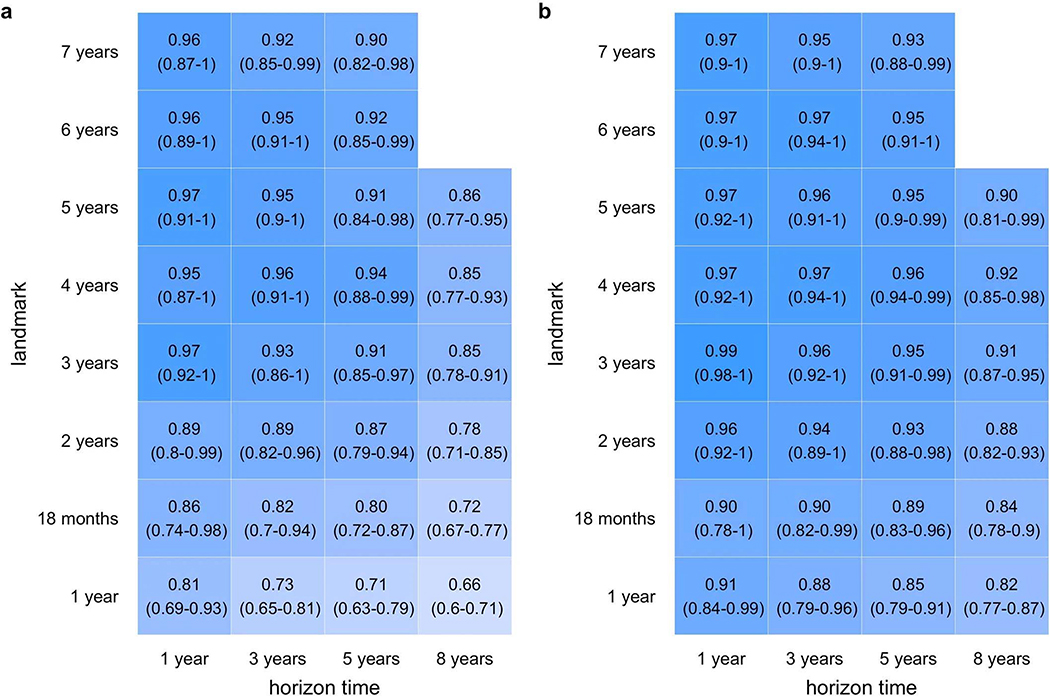
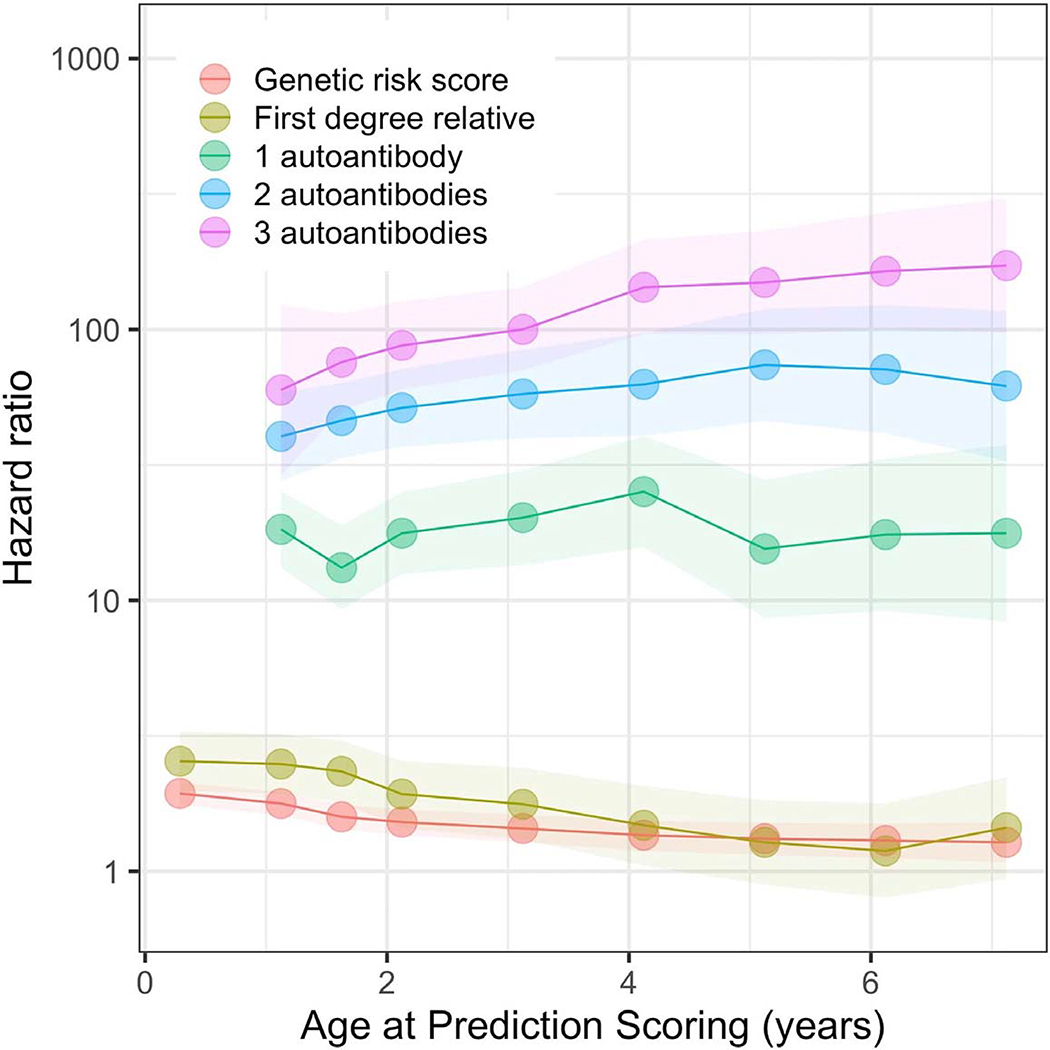
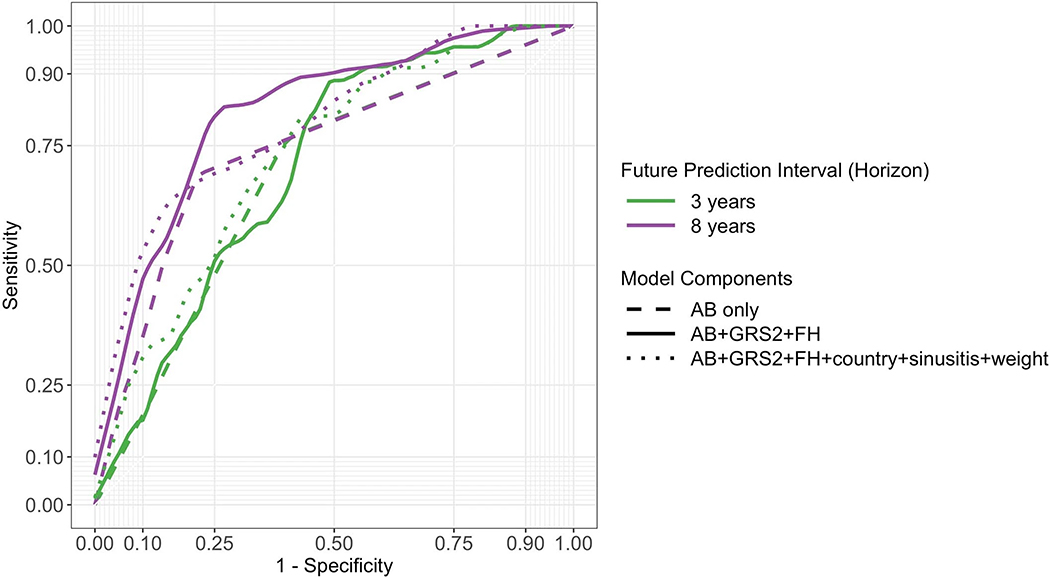
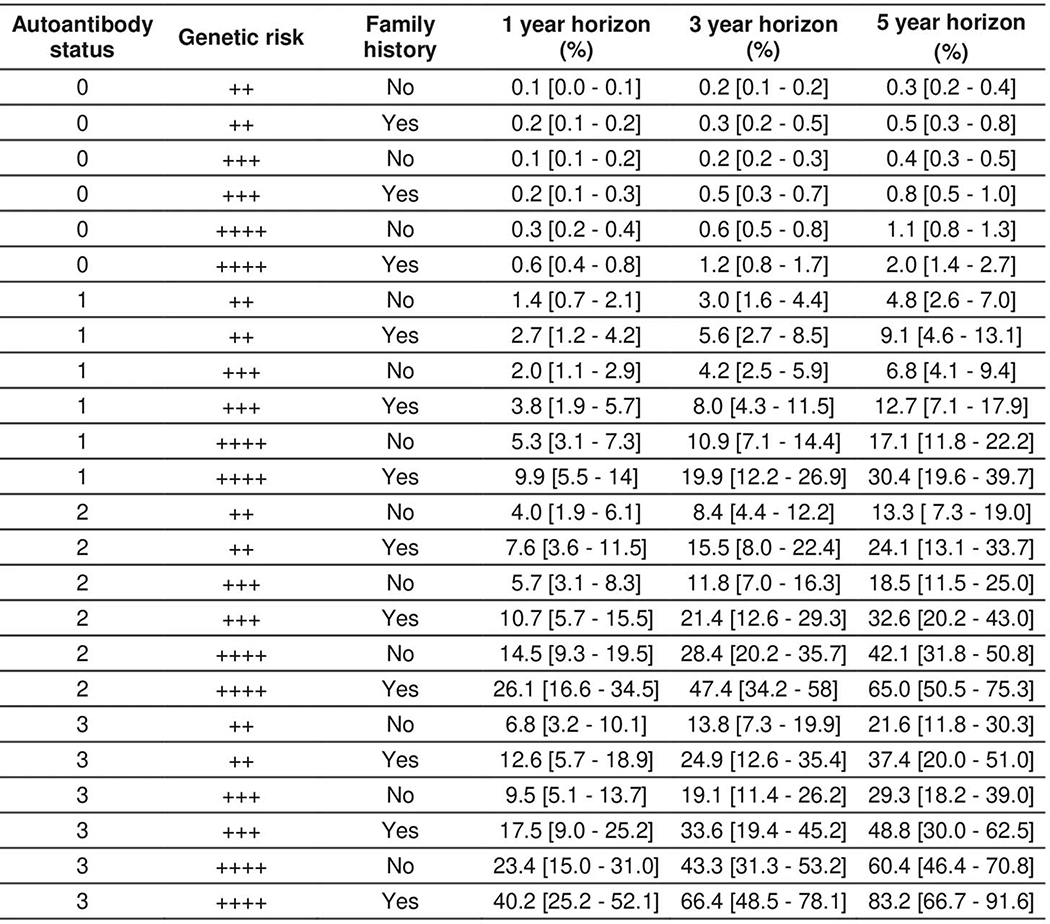
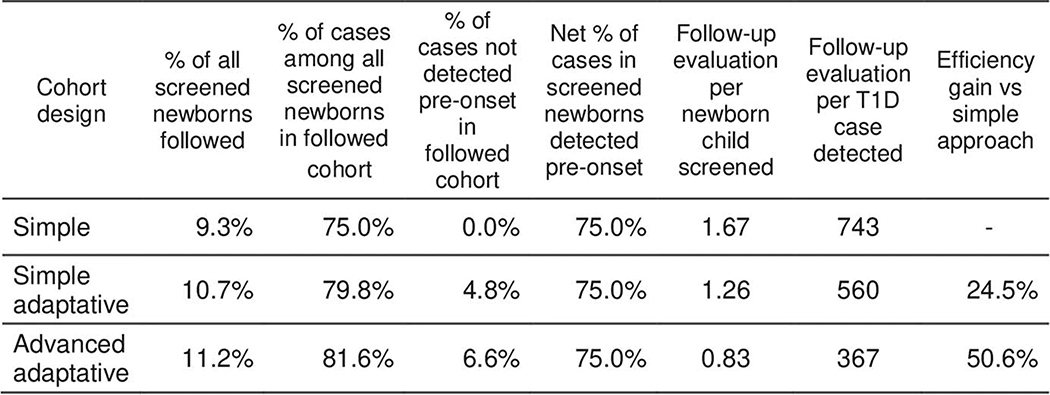
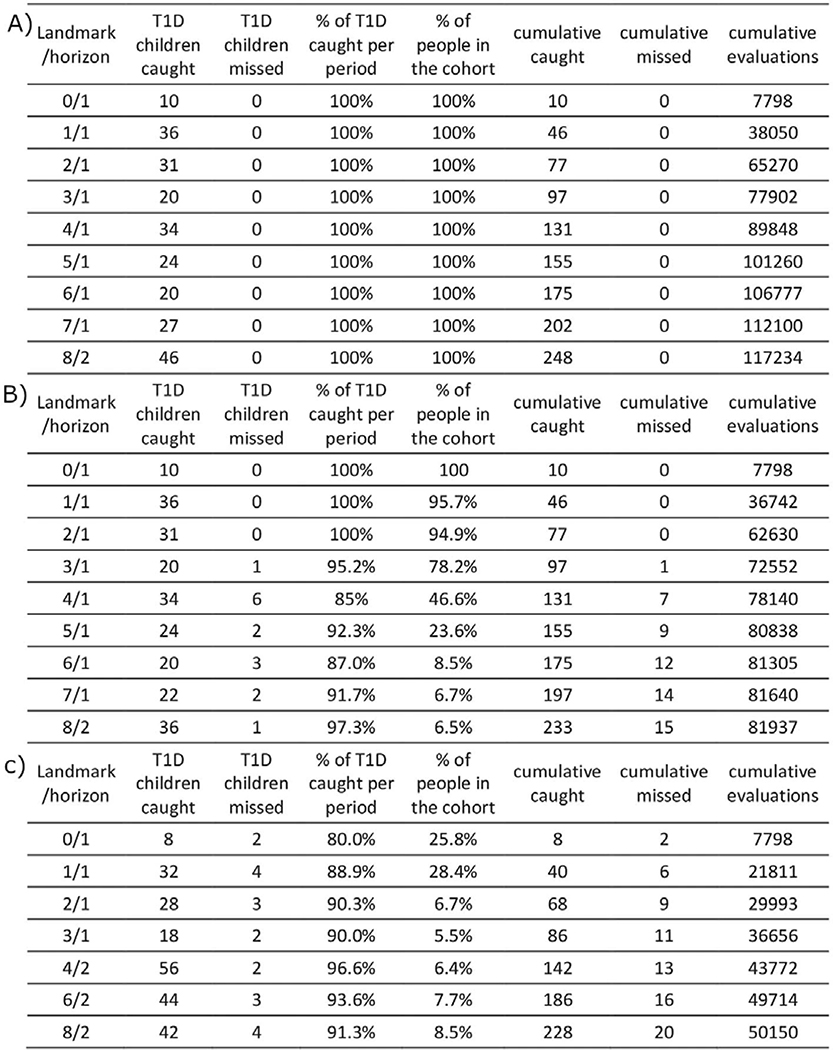
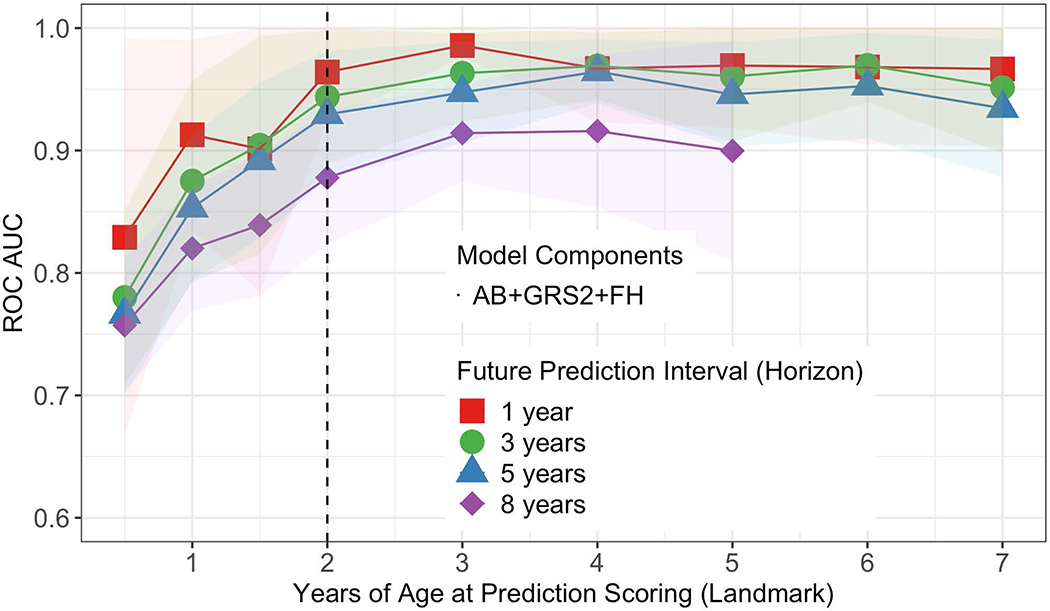
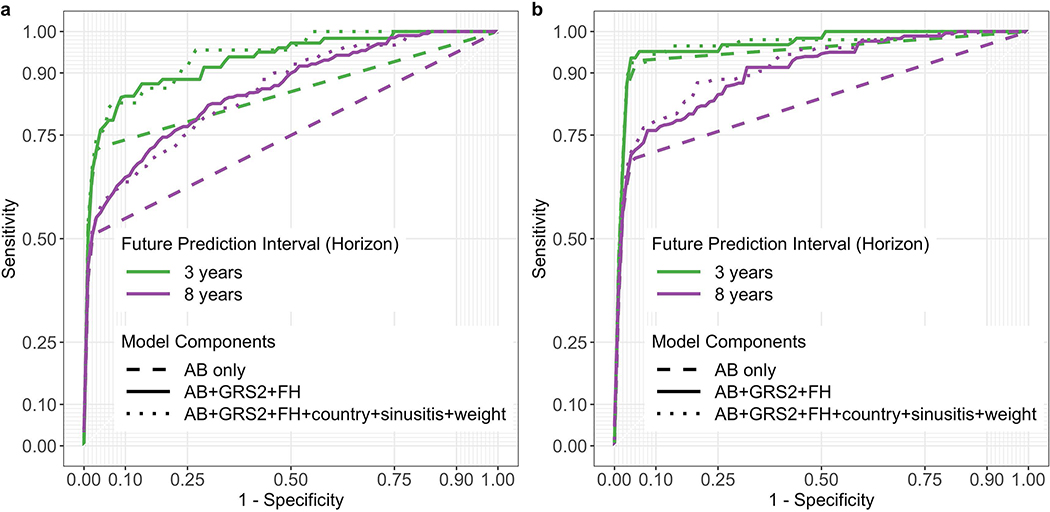
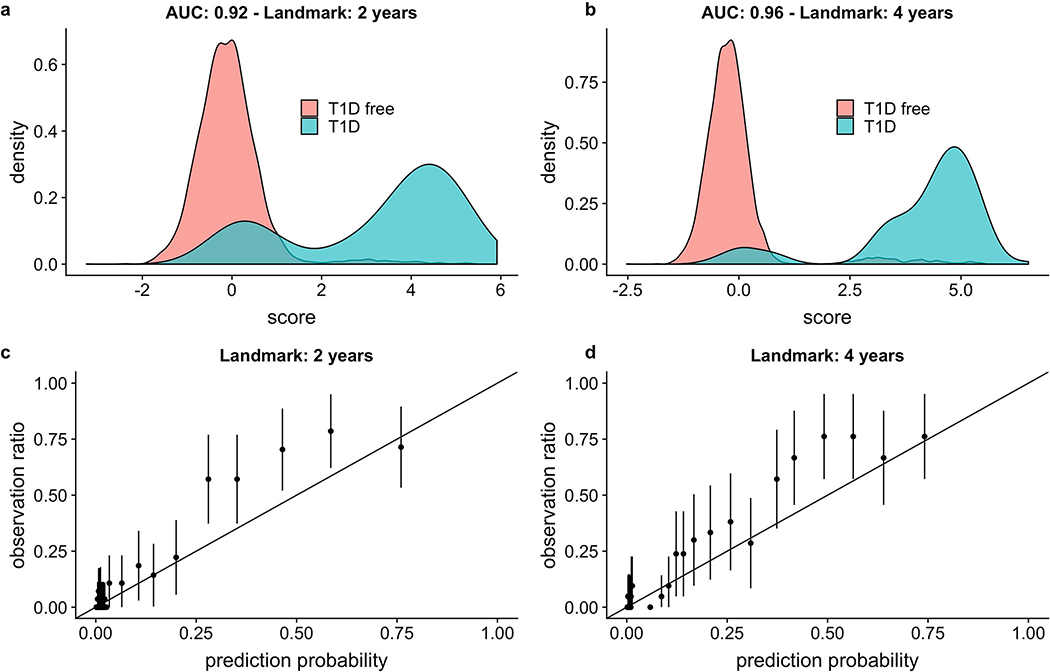
Type 1 diabetes (T1D)-an autoimmune disease that destroys the pancreatic islets, resulting in insulin deficiency-often begins early in life when islet autoantibody appearance signals high risk1. However, clinical diabetes can follow in weeks or only after decades, and is very difficult to predict. Ketoacidosis at onset remains common2,3 and is most severe in the very young4,5, in whom it can be life threatening and difficult to treat6-9. Autoantibody surveillance programs effectively prevent most ketoacidosis10-12 but require frequent evaluations whose expense limits public health adoption13. Prevention therapies applied before onset, when greater islet mass remains, have rarely been feasible14 because individuals at greatest risk of impending T1D are difficult to identify. To remedy this, we sought accurate, cost-effective estimation of future T1D risk by developing a combined risk score incorporating both fixed and variable factors (genetic, clinical and immunological) in 7,798 high-risk children followed closely from birth for 9.3 years. Compared with autoantibodies alone, the combined model dramatically improves T1D prediction at ≥2 years of age over horizons up to 8 years of age (area under the receiver operating characteristic curve ≥ 0.9), doubles the estimated efficiency of population-based newborn screening to prevent ketoacidosis, and enables individualized risk estimates for better prevention trial selection.


Conflict of interest statement

Competing Interests Statement. RAO holds a UK Medical Research Council Institutional Confidence in Concept grant to develop a 10 SNP biochip T1D genetic test in collaboration with Randox. AGZ is a co-applicant on patent application WO 2019/002364 Al covering use of a genetic risk score to identify and treat individuals with high T1D genetic risk. Neither of these genetic risk tests is identical to the more extensive GRS2 used in the final version of this paper. The other authors declare no conflicts of interest.

Figures

Extended Data Fig. 1
Extended Data Fig. 1. Variables previously shown or susceptible to be associated with T1D auto-immunity evaluated in univariate analysis.
Time ROC AUC and p-value (two side Wald test) are computed at landmark age 2 years and horizon of 8 years (n = 6,805). Abbreviations: Type 1 diabetes (T1D), Family history (FH), Islet Autoantibodies (AB), insulinoma Antigen-2 Autoantibody (IA2A), Glutamic Acid Decarboxylase Autoantibody (GADA), Insulin AutoAntibody (IAA), Genetic Risk score (GRS2). The referent sex is female. A concise list of references for this table is provided in the Supplementary Information file associated with this paper.
Extended Data Fig. 2
Extended Data Fig. 2. Time dependent ROC curves comparing the performance of various genetic risk scores in the TEDDY cohort.
Shown are curves for GRS1, GRS2 and the combined TEDDY GRS to predict T1D from a landmark age of birth and a horizon interval of 8 years (n= 7,798).
Extended Data Fig. 3
Extended Data Fig. 3. Family history adds predictive power to the T1D GRS2.
T1D GRS2 alone (a) is compared to T1D GRS2 + FH (b) at nine different landmark scoring ages and over four different horizon times. Although 95% confidence intervals always overlapped, among 34 total combinations, T1D GRS2 + FH gave a larger AUC ROC in 24 of these combinations. Results were similar in 9 combinations, and in only one instance was T1D GRS2 better. T1D GRS2 + FH superiority was greatest at landmarks ≤3 years of age. The number of children at each landmark age were 7798 (birth), 7563 (1 year), 7123 (1.5 years), 6805 (2 years), 6316 (3 years), 5973 (4 years), 5706 (5 years), 5517 (6 years) and 5323 (7 years).
Extended Data Fig. 4
Extended Data Fig. 4. T1D GRS2 and family history add predictive power to AB.
AB alone (a) is compared to the three-variable model of AB, GRS2 and FH. (b) at eight different landmark scoring ages and over four different horizon times. Although 95% confidence intervals overlapped, among 30 total combinations, the three-variable model yielded larger AUC ROC in 28 of these combinations and similar results in the remaining 2 combinations. The differences were often substantial, especially at landmarks ≤4 years of age. The number of children at each landmark age were 7798 (birth), 7563 (1 year), 7123 (1.5 years), 6805 (2 years), 6316 (3 years), 5973 (4 years), 5706 (5 years), 5517 (6 years) and 5323 (7 years).
Extended Data Fig. 5
Extended Data Fig. 5. Hazard ratio for each variable at different ages at prediction scoring landmarks.
Each point represents the hazard ratio at a landmark age (x abscises), the shaded region its respective 95% confidence interval. The number of children at each landmark age were 7798 (birth), 7563 (1 year), 7123 (1.5 years), 6805 (2 years), 6316 (3 years), 5973 (4 years), 5706 (5 years), 5517 (6 years) and 5323 (7 years).
Extended Data Fig. 6
Extended Data Fig. 6. Time dependent ROC of different models now considering only children positive for at least one AB (n = 252).
The landmark age is 2 years. At the 3 year time horizon the CRS (AB+GRS2+FH) performs similarly to AB only, but at the 8 year horizon the CRS is more predictive.
Extended Data Fig. 7
Extended Data Fig. 7. Individual estimated future T1D risk probability percentages (and 95% confidence intervals) for 24 different scenarios combining a GRS risk level and FH background with different AB status calculated at age 2 years.
“++” represents a T1D genetic risk score at 80th percentile of the general (UK) population. “+++” represents a T1D genetic risk score at 90th percentile of the general (UK) population. “++++” represents a T1D genetic risk score at 99th percentile of the general (UK) population.
Extended Data Fig. 8
Extended Data Fig. 8. Comparison of newborn screening strategies aiming to predict ≥75% of the children who will develop T1D before age 10.
In the “Classic” design, the 9.3% of screened newborn population containing 75% of the T1D cases, are all followed for 10 years. In the “Simple Adaptive” design, 10.7% of the screened newborns containing 79.8% of the T1D cases, are followed for variable lengths determined by CRS-based risk, and 4.8% of T1D cases miss AB detection before onset, leaving 75% detected in advance. In the “Advanced Adaptive” design, 11.2% of the screened newborns containing 81.6 % of T1D cases are followed closely or less closely determined by CRS-based risk, 6.6% of cases miss AB detection before onset, again leaving 75% detected. Numbers are computed by using the performance of each strategy on TEDDY data. Tests per child are computed using TEDDY data and simulation to take into account right censoring in TEDDY data.
Extended Data Fig. 9
Extended Data Fig. 9. Visit number calculation for each design.
Table A. Visit number calculations for the “Classic” design. Infants initially selected for high. GRS2 genetic risk were all followed quarterly until age 3, and every 6 months until age 6, then annually thereafter. This simulation was made on the TEDDY dataset. Table B. Visit number calculations for the “Simple Adaptive” design. Infants selected for high genetic risk were initially followed as in the Classic strategy, but the T1D CRS was recalculated at annual landmarks, at which time any child whose T1D probability by age 10 had decreased to <0.8% was eliminated from further follow-up. Of new cases, 94% had high risk detected before onset. This simulation was made on the TEDDY dataset. Table C. Visit number calculations for the “Advanced Adaptive” design. Infants selected for high genetic risk were initially followed as in the Classic strategy, but at birth and annually thereafter, a T1D CRS calculation was used to reallocate children among the quarterly or annual surveillance groups based on T1D probability in 2 years of ≥0.6% or <0.6%, respectively. Of new cases, 92% had high risk detected before onset. Simulation made on the TEDDY dataset.
Extended Data Fig. 10
Extended Data Fig. 10. GRS2 violin plot in the Type 1 Diabetes Genetics Consortium (T1DGC) and TEDDY datasets.
T1DGC is more representative of the general background population. The genetic pre- selection in TEDDY based on the major T1D risk locus HLA-DR-DQ, renders the T1D GRS2 higher in TEDDY, even in T1D free subjects. Further, the separation between T1D and non-T1D subjects in TEDDY is much less. There are 7,798 observations in TEDDY including 305 with T1D. There are 15729 observations in T1DGC including 6483 with T1D. The lines in the violin plots respectively indicate the 25th, 50th and 75th percentiles, while the lowest and the highest point of each violin plot indicates the minimum and the maximum, respectively, for each group of individuals.
Figure 1:
Figure 1:
Average time dependent ROC AUCs for the 3-variable model by age at prediction scoring. Four different prediction horizons are denoted by different colors. The vertical dotted line corresponds to the landmark age of 2 years featured in Figure 2 Panel a. The shaded region indicate the 95% confidence interval of the mean.
Figure 2:
Figure 2:
ROC curves derived from models incorporating different numbers of variables. Use of all 6-variables is denoted by the dotted line, 3-variables by the solid line, and autoantibodies only by the dashed line. Curves in panel a use a landmark age of 2 years, with prediction horizons of 3 or 8 years as indicated. Curves in panel b use a landmark age of 4 years, also with prediction horizons of 3 or 8 years as indicated.
Figure 3:
Figure 3:
Performance of the 3-variable model at a 5-year horizon. Panels a and b: Score distributions using a 2-year or 4-year landmark age, respectively. AUC ROC values are noted on the figure. The T1D CRS was generated by the linear predictor of the parametric part of the hazard function of the Cox model. Panels c and d: Calibration plots using a 2- year or 4-year landmark age, respectively. The predictions are grouped into bins corresponding to centiles, and then each bin prevalence (the ratio of plots in this bin with observed T1D endpoints to the total number of plots in this bin) is calculated. Each point represents the mean of each bin, and each error bar indicates the 95% confidence interval of that mean (computed by assuming using normal approximation interval). For 2-year or 4-year landmark ages, a total of n= 6,805 and n= 5,973 children with an AB test in the prior 6 months were analyzed, respectively.
Figure 4:
Figure 4:
Three strategies for population-based newborn screening and surveillance follow-up. The models are termed “Classic”, “Simple Adaptive”, and “Advanced Adaptive”. A flow chart for each model is shown in panels a, b and c, respectively. The two adaptive models use the 3-variable T1D CRS to dynamically define the follow-up schedule for each individual in the cohort. Panels d, e and f show the proportion of children remaining under follow-up in each respective scenario using cohort simulations on TEDDY data (n=7,798). *Risk is recalculated annually during the first 4 years life, then every 2 years thereafter. **Close follow-up is quarterly to age 3, then biannually to age 6, then annually to age 8. Reduced follow-up is annually to age 4 and then every two years.

Similar articles

Cited by

References

References Main Text

    1. Ziegler AG et al. Seroconversion to Multiple Islet Autoantibodies and Risk of Progression to Diabetes in Children. JAMA 309, 2473 (2013). - PMC - PubMed
    1. Dabelea D et al. Trends in the Prevalence of Ketoacidosis at Diabetes Diagnosis: The SEARCH for Diabetes in Youth Study. Pediatrics 133, e938–e945 (2014). - PMC - PubMed
    1. Alonso GT et al. Diabetic Ketoacidosis at Diagnosis of Type 1 Diabetes in Colorado Children, 2010–2017. Diabetes Care 43, 117–121 (2020). - PMC - PubMed
    1. Jefferies C et al. 15-year incidence of diabetic ketoacidosis at onset of type 1 diabetes in children from a regional setting (Auckland, New Zealand). Sci. Rep 5, 10358 (2015). - PMC - PubMed
    1. Iovane B et al. Diabetic ketoacidosis at the onset of Type 1 diabetes in young children Is it time to launch a tailored campaign for DKA prevention in children <5 years? Acta Biomed 89, 67–71 (2018). - PMC - PubMed

Methods-Only References

    1. TEDDY Study Group. The Environmental Determinants of Diabetes in the Young (TEDDY) Study. Ann. N. Y. Acad. Sci 1150, 1–13 (2008). - PMC - PubMed
    1. Hagopian WA et al. The Environmental Determinants of Diabetes in the Young (TEDDY): genetic criteria and international diabetes risk screening of 421 000 infants. Pediatr. Diabetes 12, 733–743 (2011). - PMC - PubMed
    1. Lönnrot M et al. A method for reporting and classifying acute infectious diseases in a prospective study of young children: TEDDY. BMC Pediatr 15, 24 (2015). - PMC - PubMed
    1. Bonifacio E et al. Harmonization of Glutamic Acid Decarboxylase and Islet Antigen-2 Autoantibody Assays for National Institute of Diabetes and Digestive and Kidney Diseases Consortia. J. Clin. Endocrinol. Metab 95, 3360–3367 (2010). - PMC - PubMed
    1. Cortes A & Brown MA Promise and pitfalls of the Immunochip. Arthritis Res. Ther 13, 101 (2011). - PMC - PubMed

Publication types

MeSH terms