. 2020 Oct 1;161(10):bqaa132.
doi: 10.1210/endocr/bqaa132.

SMRT Regulates Metabolic Homeostasis and Adipose Tissue Macrophage Phenotypes in Tandem

Affiliations

SMRT Regulates Metabolic Homeostasis and Adipose Tissue Macrophage Phenotypes in Tandem

Jonathan H Kahn et al. Endocrinology. .

Abstract

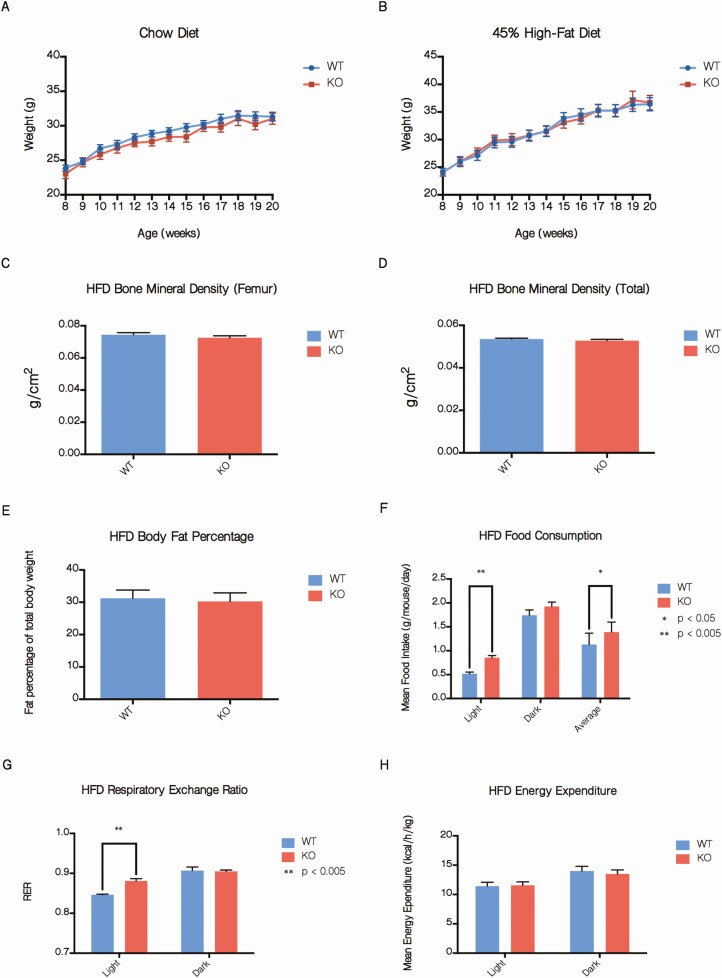
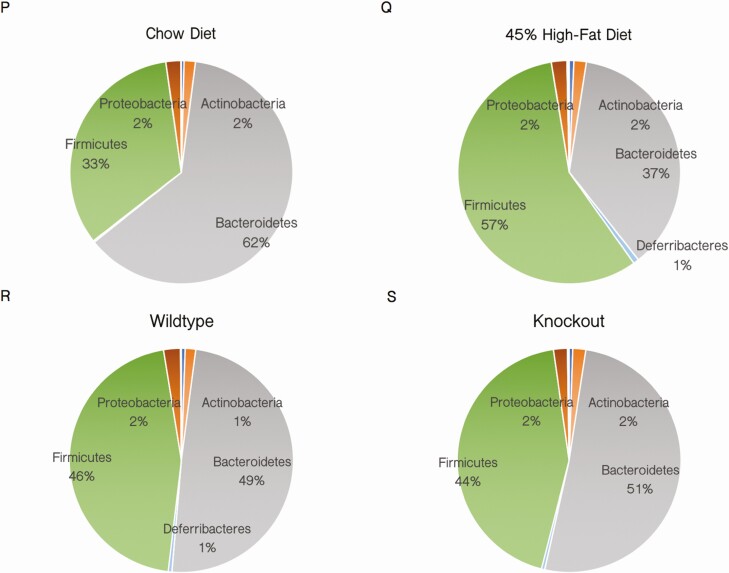
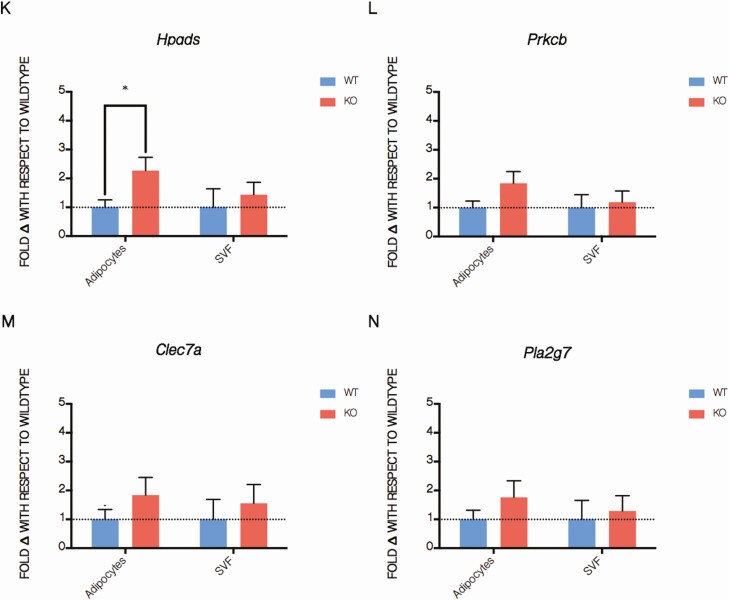
The Silencing Mediator of Retinoid and Thyroid Hormone Receptors (SMRT) is a nuclear corepressor, regulating the transcriptional activity of many transcription factors critical for metabolic processes. While the importance of the role of SMRT in the adipocyte has been well-established, our comprehensive understanding of its in vivo function in the context of homeostatic maintenance is limited due to contradictory phenotypes yielded by prior generalized knockout mouse models. Multiple such models agree that SMRT deficiency leads to increased adiposity, although the effects of SMRT loss on glucose tolerance and insulin sensitivity have been variable. We therefore generated an adipocyte-specific SMRT knockout (adSMRT-/-) mouse to more clearly define the metabolic contributions of SMRT. In doing so, we found that SMRT deletion in the adipocyte does not cause obesity-even when mice are challenged with a high-fat diet. This suggests that adiposity phenotypes of previously described models were due to effects of SMRT loss beyond the adipocyte. However, an adipocyte-specific SMRT deficiency still led to dramatic effects on systemic glucose tolerance and adipocyte insulin sensitivity, impairing both. This metabolically deleterious outcome was coupled with a surprising immune phenotype, wherein most genes differentially expressed in the adipose tissue of adSMRT-/- mice were upregulated in pro-inflammatory pathways. Flow cytometry and conditioned media experiments demonstrated that secreted factors from knockout adipose tissue strongly informed resident macrophages to develop a pro-inflammatory, MMe (metabolically activated) phenotype. Together, these studies suggest a novel role for SMRT as an integrator of metabolic and inflammatory signals to maintain physiological homeostasis.

Keywords: NCoR2; SMRT; adipose tissue; gene knockout; homeostasis; hormone receptor; inflammation; metabolism; nuclear corepressor; transcription regulation.


Figures

Figure 1.
Figure 1.
Genetics of adSMRT-/- mouse. A:  Smrt receives a single loxP site on both alleles, inserted 187 bp downstream of exon 11; mice hemizygously expressing adiponectin-driven Cre excise this site such that a frameshift mutation is introduced, rendering SMRT protein nonfunctional exclusively in adipocytes. B: Mice expressing Cre display 2 bands at ~320bp and ~250bp while wild-type mice display a darker band (2 overlapping bands) at ~320bp; all mice used in this study are floxed on both alleles, displaying a band at ~450bp; Cre+/-, Flox+/+ mice are crossed with Cre-/-, Flox+/+ mice to generate adSMRT-/- mice. C: qRT-PCR model validation shows that adSMRT-/- mice have ~80% reduction in Smrt expression exclusively in adipocytes while the associated stromal vascular fraction remains unaffected. N = 5 per genotype. Data are means ± SEM; *P < 0.01. D: Western blot for SMRT (274 kDa) using nuclear protein extracts from a panel of tissues demonstrates adipose tissue-specific decrease in expression of SMRT in adSMRT-/- (KO) samples compared with wild-type (WT). Total AKT (60 kDa) was measured as a loading control; Abbreviations: BAT, brown adipose tissue; EPIDID, epididymal; SUBCUT, subcutaneous; SVF, stromal vascular fraction;.
Figure 2.
Figure 2.
adSMRT-/- mice exhibit altered energy consumption and utilization without obesity or hypertrophy. A, B: Total body weight measured weekly between ages 8 and 20 weeks for mice on a chow diet (A) and mice fed a 45% high-fat diet (HFD) (B). N = 15–25 per genotype. Data are means ± SEM. C, D, E: Determinations of femur bone mineral density (C), total bone mineral density (D), and body fat percentage (E) by DEXA scanning for 20-week old mice fed a 45% HFD. N = 10-15 per genotype. Data are means ± SEM. F, G, H: Determinations of average food consumption (F), respiratory exchange ratio (RER) (G), and energy expenditure (H) for 20-week old mice fed a 45% HFD by metabolic cage analysis. N = 4 per genotype. Data are means ± SEM; *P < 0.05, **P < 0.001. I-L: Sample histological sections of H&E-stained subcutaneous (I) and epididymal (J) adipose tissue for mice fed a 45% HFD, and the respective quantifications for adipocyte size via ImageJ quantification of negative space in arbitrary units (K, L). Figure 2. Continued. M, N: Triglyceride quantification of whole adipose tissue from subcutaneous (M) and epididymal (N) depots via colorimetric assay demonstrates no difference in triglyceride concentration. N = 5 per genotype. Data are means ± SEM. O: qRT-PCR expression data from wild-type (WT) and knockout (KO) isolated adipocytes show no difference in levels of target leptin (Lep), expressed as fold change from wild-type. N = 5 per genotype. Data are means ± SEM. P-S: Phylum diversity of gut microbiota for mice following 12 weeks of diet, compared by diet (chow vs HFD) (M-N) and genotype (WT vs KO) (O-P). N = 12 per genotype or diet comparison.
Figure 2.
Figure 2.
adSMRT-/- mice exhibit altered energy consumption and utilization without obesity or hypertrophy. A, B: Total body weight measured weekly between ages 8 and 20 weeks for mice on a chow diet (A) and mice fed a 45% high-fat diet (HFD) (B). N = 15–25 per genotype. Data are means ± SEM. C, D, E: Determinations of femur bone mineral density (C), total bone mineral density (D), and body fat percentage (E) by DEXA scanning for 20-week old mice fed a 45% HFD. N = 10-15 per genotype. Data are means ± SEM. F, G, H: Determinations of average food consumption (F), respiratory exchange ratio (RER) (G), and energy expenditure (H) for 20-week old mice fed a 45% HFD by metabolic cage analysis. N = 4 per genotype. Data are means ± SEM; *P < 0.05, **P < 0.001. I-L: Sample histological sections of H&E-stained subcutaneous (I) and epididymal (J) adipose tissue for mice fed a 45% HFD, and the respective quantifications for adipocyte size via ImageJ quantification of negative space in arbitrary units (K, L). Figure 2. Continued. M, N: Triglyceride quantification of whole adipose tissue from subcutaneous (M) and epididymal (N) depots via colorimetric assay demonstrates no difference in triglyceride concentration. N = 5 per genotype. Data are means ± SEM. O: qRT-PCR expression data from wild-type (WT) and knockout (KO) isolated adipocytes show no difference in levels of target leptin (Lep), expressed as fold change from wild-type. N = 5 per genotype. Data are means ± SEM. P-S: Phylum diversity of gut microbiota for mice following 12 weeks of diet, compared by diet (chow vs HFD) (M-N) and genotype (WT vs KO) (O-P). N = 12 per genotype or diet comparison.
Figure 3.
Figure 3.
adSMRT-/- mice are glucose intolerant with insulin resistant adipocytes. A-D: Intraperitoneal glucose tolerance tests (IP-GTTs) for 20-week old mice fed a chow (A) and 45% high-fat diet (HFD) (B), and their respective area under the curve (AUC) quantifications (C, D). N = 12-13 per genotype for chow GTT data, N = 7-11 for HFD GTT data. Data are means ± SEM; *P < 0.05, **P < 0.005. E, F: Adipocyte insulin sensitivity from mice fed a 45% HFD, determined by Western blotting for pAKT:AKT signaling and, using ImageJ, plotted as a quantification of band intensity in arbitrary units (E), and the respective AUC measurement (F). N = 7 per genotype. Data are means ± SEM; *P < 0.05, **P < 0.005. G, H: Western blots demonstrate insulin resistance in white adipose tissues of knockout (KO) mice compared with wild-type (WT). Following treatment with increasing concentrations of insulin (note different insulin concentration scales used for G, H and E, F), whole-cell protein extracts from subcutaneous (G) and epididymal (H) white adipose tissue were probed for phosphorylated (Ser473) AKT (pAKT, 60 kDa); total AKT (AKT, 60 kDa) was measured as a loading control.
Figure 4.
Figure 4.
PPARγ derepression fails to explain the phenotype. A-E: qRT-PCR expression data from isolated adipocytes for PPARγ downstream targets Fabp4, Gyk, Pck1, Ucp1, and Cd36. N = 7 per genotype. Data are means ± SEM. F: Lipogenesis assay determining ability of adipocytes to incorporate radiolabeled glucose into triglycerides upon stimulation with insulin; plotted as fold change in radioactivity from baseline. N = 8 per genotype. Data are means ± SEM.
Figure 5.
Figure 5.
RNA sequencing indicates dysregulation of immune pathways in adSMRT-/- mice. A-D: Significantly differentially expressed genes, identified by RNA sequencing of whole adipose tissue samples from mice fed a 45% HFD, plotted as a heatmap and categorized for roles in either immune pathways or other pathways, with category “Other” representing molecular functions spanning histone modifications, homeostasis, cell cycle regulation, and more; red, blue, and yellow colors represent upregulation, downregulation, or no change, respectively, relative to the average expression level for that gene across all eight biological replicates (each column represents a biological replicate) (A); summarizing table identifying differentially expressed genes between wild-type and adSMRT-/- samples at various fold change (FD) and false-discovery rate (FDR) cutoffs (67 differentially expressed genes identified at a FDR of < 0.05 and FD of > 1.5) (B); unbiased GO analysis revealing that the vast majority of pathways identified as differentially regulated between genotypes are those within the functional category of immune processes (C). GO terms that may be classified under multiple functional categories, eg, “leukocyte migration” as either “Immune Response” or “Migration,” were counted as the less frequent category; FDs and FDR-corrected P values of genes selected for qRT-PCR validation (D); N = 4 per genotype. E-N: qRT-PCR validation of RNAseq via genes identified in table C, expressed as fold change with respect to wild-type for both isolated adipocytes and the associate stromal vascular fraction. N = 3 per genotype per sample type (adipocyte vs SVF). Data are means ± SEM; *P < 0.05. Fold changes for targets Slamf9, Prkcb, Clec7a, and Pla2g7 all trended towards significance (P < 0.1).
Figure 5.
Figure 5.
RNA sequencing indicates dysregulation of immune pathways in adSMRT-/- mice. A-D: Significantly differentially expressed genes, identified by RNA sequencing of whole adipose tissue samples from mice fed a 45% HFD, plotted as a heatmap and categorized for roles in either immune pathways or other pathways, with category “Other” representing molecular functions spanning histone modifications, homeostasis, cell cycle regulation, and more; red, blue, and yellow colors represent upregulation, downregulation, or no change, respectively, relative to the average expression level for that gene across all eight biological replicates (each column represents a biological replicate) (A); summarizing table identifying differentially expressed genes between wild-type and adSMRT-/- samples at various fold change (FD) and false-discovery rate (FDR) cutoffs (67 differentially expressed genes identified at a FDR of < 0.05 and FD of > 1.5) (B); unbiased GO analysis revealing that the vast majority of pathways identified as differentially regulated between genotypes are those within the functional category of immune processes (C). GO terms that may be classified under multiple functional categories, eg, “leukocyte migration” as either “Immune Response” or “Migration,” were counted as the less frequent category; FDs and FDR-corrected P values of genes selected for qRT-PCR validation (D); N = 4 per genotype. E-N: qRT-PCR validation of RNAseq via genes identified in table C, expressed as fold change with respect to wild-type for both isolated adipocytes and the associate stromal vascular fraction. N = 3 per genotype per sample type (adipocyte vs SVF). Data are means ± SEM; *P < 0.05. Fold changes for targets Slamf9, Prkcb, Clec7a, and Pla2g7 all trended towards significance (P < 0.1).
Figure 6.
Figure 6.
In vitro and in vivo data suggest adSMRT-/- adipose tissue microenvironment influences development of and is enriched for metabolically activated macrophages. A: qRT-PCR expression data from macrophages isolated from primary epididymal adipose tissue for the MMe/proinflammatory macrophage phenotype targets Abca1, Plin2, Tnfa, and Il1b. N = 5 per genotype. *P < 0.05. Data are means ± SEM. B-C: flow cytometric data for isolated SVF, with data presented as a percentage of cells from the previous gate (indicated on axes); only cells positive for both macrophage markers CD11b and F4/80 were considered downstream analysis, and any samples that contained <65% live cells were excluded. N = 5-8 per genotype. Data are means ± SEM; **P < 0.01, ***P < 0.001. D: Following incubation in media conditioned from wild-type and adSMRT-/- whole fat, naïve macrophages were analyzed via qRT-PCR for expression of metabolically activated macrophage (MMe) phenotype markers IL1, TNFa, Abca1, and Plin2 to determine whether alterations in the KO adipose tissue secretome influence macrophage differentiation. N = 3 per genotype. Data are means ± SEM; **P < 0.005, ***P < 0.0005.

References

    1. Kershaw EE, Flier JS. Adipose tissue as an endocrine organ. J Clin Endocrinol Metab. 2004;89(6):2548-2556. - PubMed
    1. Coelho M, Oliveira T, Fernandes R. Biochemistry of adipose tissue: an endocrine organ. Arch Med Sci. 2013;9(2):191-200. - PMC - PubMed
    1. Choe SS, Huh JY, Hwang IJ, Kim JI, Kim JB. Adipose tissue remodeling: its role in energy metabolism and metabolic disorders. Front Endocrinol (Lausanne). 2016;7:30. - PMC - PubMed
    1. Ali Khan A, Hansson J, Weber P, et al. Comparative secretome analyses of primary murine white and brown adipocytes reveal novel adipokines. Mol Cell Proteomics. 2018;17(12):2358-2370. - PMC - PubMed
    1. Rezaee F, Dashty M. Role of adipose tissue in metabolic system disorders: adipose tissue is the initiator of metabolic diseases. J Diabet Metab. 2013;13(8):2155–6156.

Publication types

MeSH terms

Substances