. 2020 Aug 8;17(1):38.
doi: 10.1186/s12989-020-00369-9.

Particle characterization and toxicity in C57BL/6 mice following instillation of five different diesel exhaust particles designed to differ in physicochemical properties

Affiliations

Particle characterization and toxicity in C57BL/6 mice following instillation of five different diesel exhaust particles designed to differ in physicochemical properties

Katja Maria Bendtsen et al. Part Fibre Toxicol. .

Abstract

Background: Diesel exhaust is carcinogenic and exposure to diesel particles cause health effects. We investigated the toxicity of diesel exhaust particles designed to have varying physicochemical properties in order to attribute health effects to specific particle characteristics. Particles from three fuel types were compared at 13% engine intake O2 concentration: MK1 ultra low sulfur diesel (DEP13) and the two renewable diesel fuels hydrotreated vegetable oil (HVO13) and rapeseed methyl ester (RME13). Additionally, diesel particles from MK1 ultra low sulfur diesel were generated at 9.7% (DEP9.7) and 17% (DEP17) intake O2 concentration. We evaluated physicochemical properties and histopathological, inflammatory and genotoxic responses on day 1, 28, and 90 after single intratracheal instillation in mice compared to reference diesel particles and carbon black.

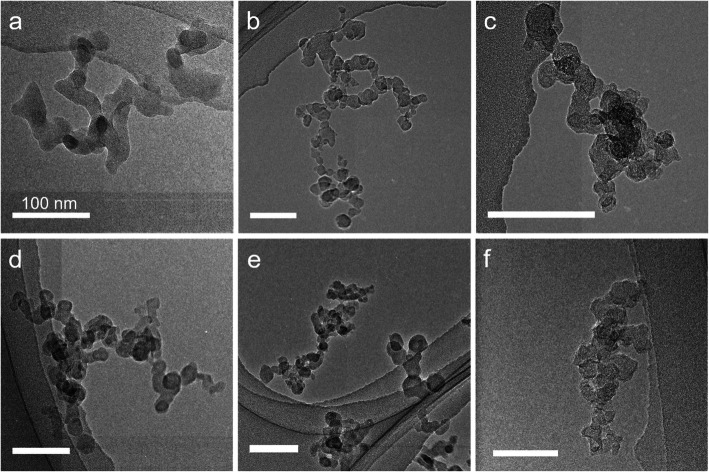
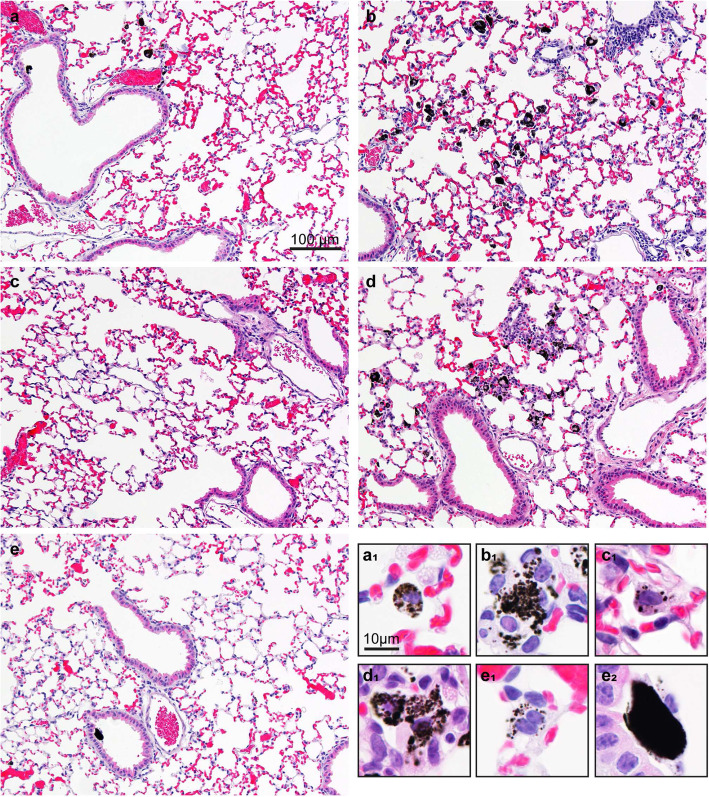
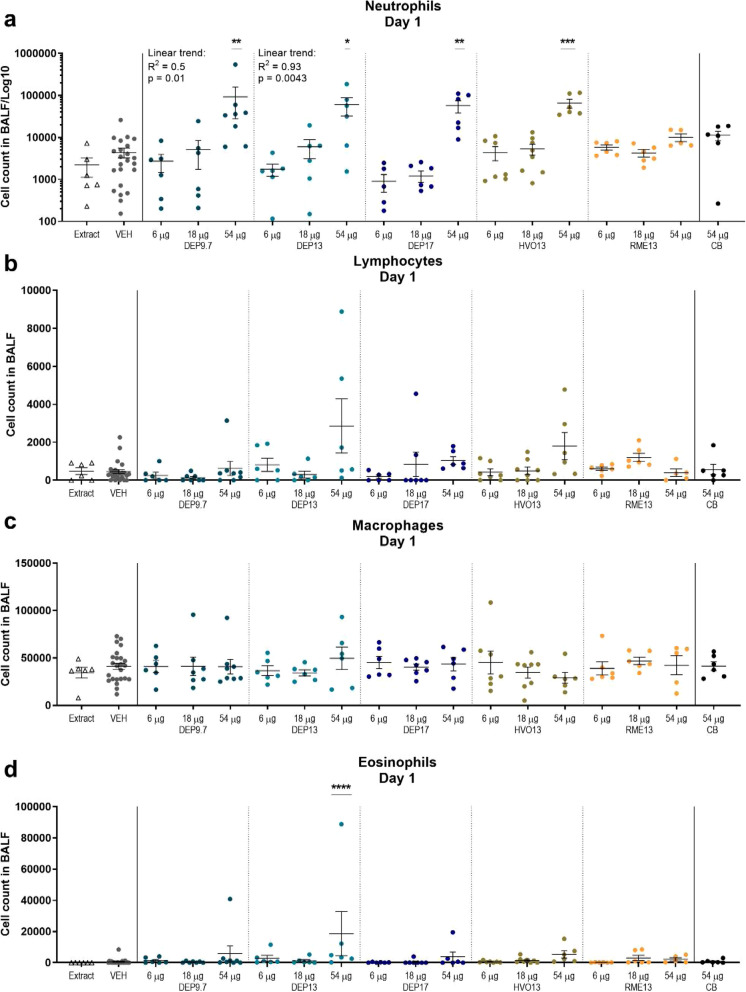
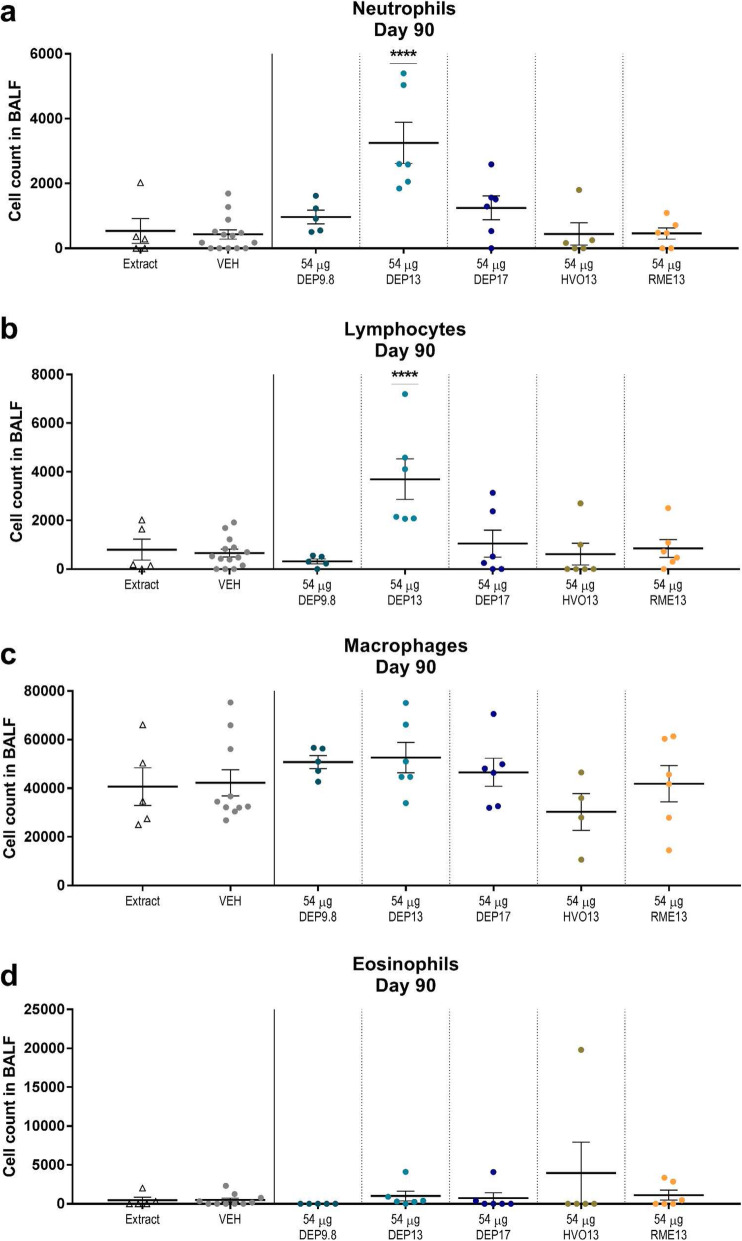
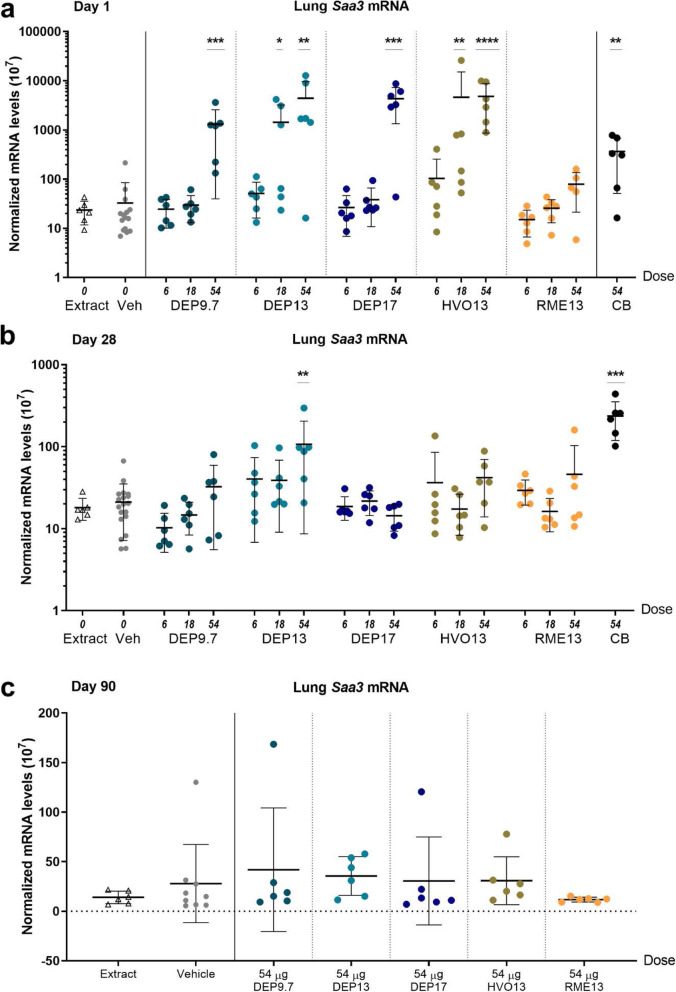
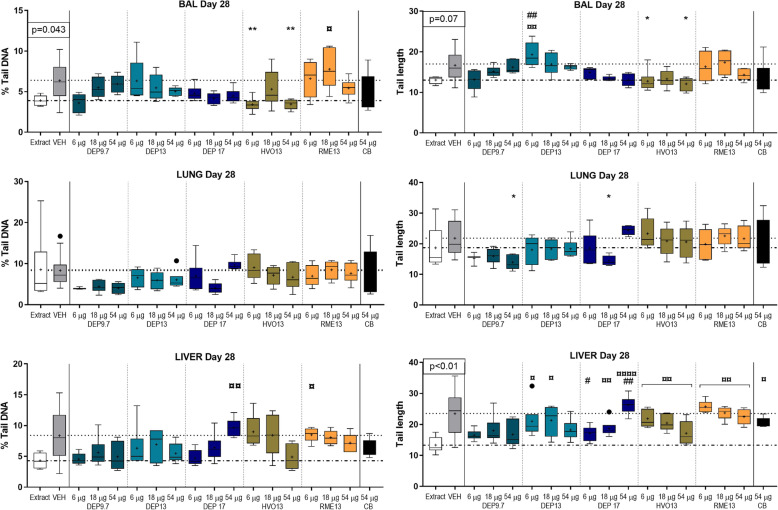
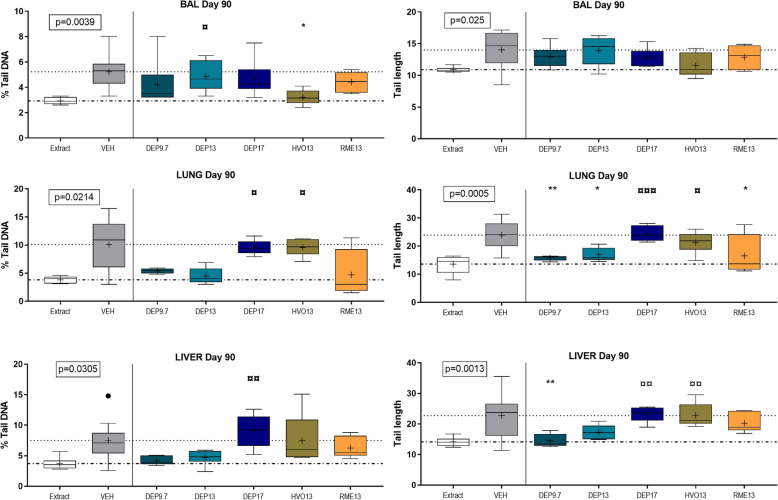
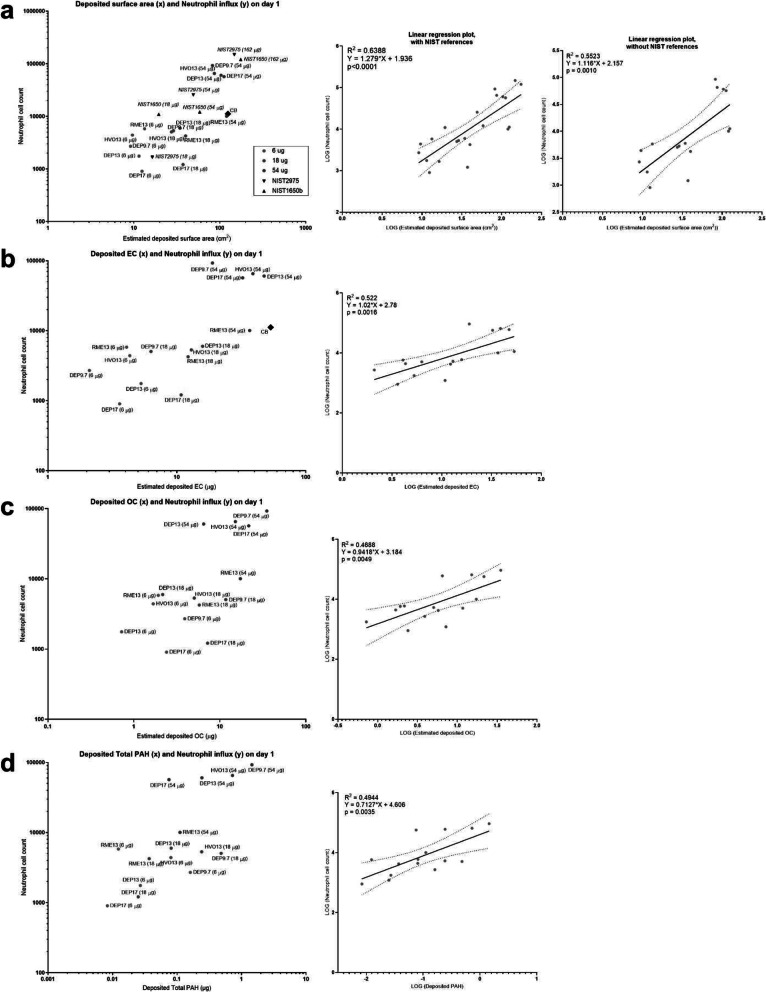
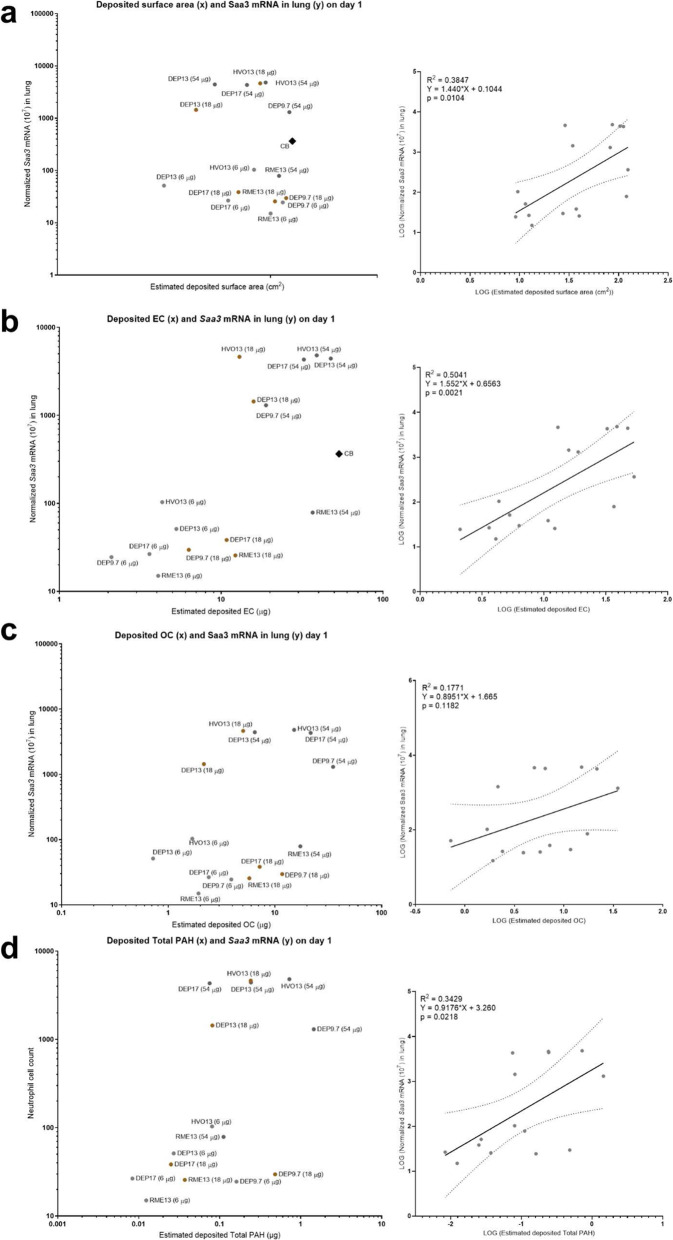
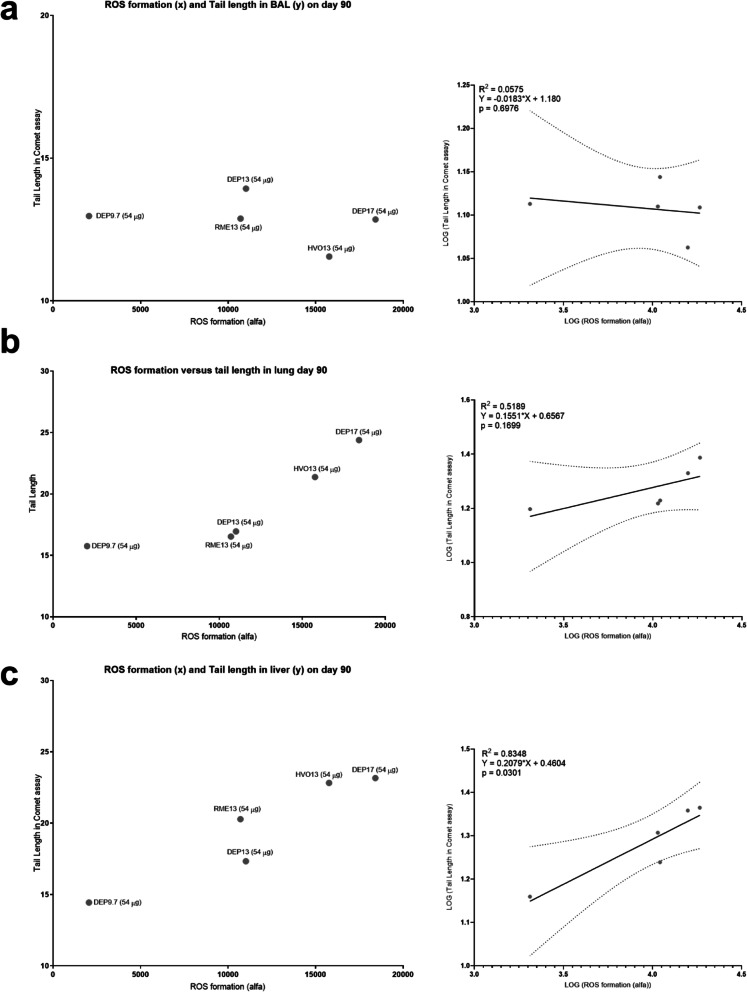
Results: Moderate variations were seen in physical properties for the five particles: primary particle diameter: 15-22 nm, specific surface area: 152-222 m2/g, and count median mobility diameter: 55-103 nm. Larger differences were found in chemical composition: organic carbon/total carbon ratio (0.12-0.60), polycyclic aromatic hydrocarbon content (1-27 μg/mg) and acid-extractable metal content (0.9-16 μg/mg). Intratracheal exposure to all five particles induced similar toxicological responses, with different potency. Lung particle retention was observed in DEP13 and HVO13 exposed mice on day 28 post-exposure, with less retention for the other fuel types. RME exposure induced limited response whereas the remaining particles induced dose-dependent inflammation and acute phase response on day 1. DEP13 induced acute phase response on day 28 and inflammation on day 90. DNA strand break levels were not increased as compared to vehicle, but were increased in lung and liver compared to blank filter extraction control. Neutrophil influx on day 1 correlated best with estimated deposited surface area, but also with elemental carbon, organic carbon and PAHs. DNA strand break levels in lung on day 28 and in liver on day 90 correlated with acellular particle-induced ROS.

Conclusions: We studied diesel exhaust particles designed to differ in physicochemical properties. Our study highlights specific surface area, elemental carbon content, PAHs and ROS-generating potential as physicochemical predictors of diesel particle toxicity.

Keywords: Diesel exhaust particles - ultrafine particles; Exhaust gas recirculation; Intratracheal instillation; Renewable diesel fuels; Toxicity.


Conflict of interest statement

The authors declare that they have no competing interests.

Figures

Fig. 1
Fig. 1
TEM images of DEP9.7 (a), DEP13 (b), and DEP17 (c), HVO13 (d), RME13 (e) and CB (f). The morphology of the particles generated with 13 and 17% O2 conditions (b, c, d, and e) are similar, while the soot agglomerates generated with 9.7% O2 (a) have less defined primary particles and appear more aggregated compared to the other samples
Fig. 2
Fig. 2
Mouse lung histology 28 days post-exposure to 54 μg DEP9.7 (a), DEP13 (b), DEP17 (c), and HVO13 (d) and RME13 (e). (a1)-(e2) are high magnification images of black particles in exposed lungs. Haematoxylin and eosin stained
Fig. 3
Fig. 3
Cell counts of broncho-alveolar lavage of mice day 1 post-exposure to 6, 18, and 54 μg DEP9.7, DEP13, DEP17, HVO13 and RME13; a) Neutrophils. Four values of zero were excluded due to the log10 axis chosen to depict the large response range. b) Lymphocytes, c) Macrophages, d) Eosinophils. * = p < 0.05. ** = p < 0.01, *** = p < 0.001, **** = p < 0.0001
Fig. 4
Fig. 4
Cell counts of broncho-alveolar lavage of mice day 90 post-exposure to 54 μg DEP9.7, DEP13, DEP17, HVO13 and RME13; a) Neutrophils, b) Lymphocytes, c) Macrophages, d) Eosinophils. * = p < 0.05. ** = p < 0.01, *** = p < 0.001, **** = p < 0.0001
Fig. 5
Fig. 5
Saa3 mRNA levels in lung tissue of mice day 1 (a), 28 (b) and 90 (c) post-exposure to 6, 18 and 54 μg DEP9.7, DEP13, DEP17, HVO13 and RME13. * = p < 0.05. ** = p < 0.01, *** = p < 0.001, **** = p < 0.0001
Fig. 6
Fig. 6
DNA strand breaks assessed in the Comet assay by %Tail DNA and Tail length in bronco-alveolar lavage cells, and lung and liver tissue of mice day 28 post-exposure to 6, 18 and 54 μg DEP9.7, DEP13, DEP17, HVO13 and RME13. ¤ = compared to extract, * = compared to VEH, ## = compared to CB. Dot-dash line: extraction control level, dotted line: vehicle control level
Fig. 7
Fig. 7
DNA strand breaks assessed in the Comet assay by % Tail DNA and Tail length in bronco-alveolar lavage cells, and lung and liver tissue of mice day 90 post-exposure to 6, 18 and 54 μg DEP9.7, DEP13, DEP17, HVO13 and RME13. ¤ = compared to extract, * = compared to VEH, ## = compared to CB. Dot-dash line: extraction control level, dotted line: vehicle control level
Fig. 8
Fig. 8
Deposited surface area, EC, OC, and PAH correlations with neutrophil influx on day 1. (a) Estimated deposited surface area, original data (left panel) and linear regression plots with and without NIST references (right panels). (b) Estimated deposited elemental carbon, original data (left panel) and linear regression plot (right panel). (c) Estimated deposited organic carbon, original data (left panel) and linear regression plot (right panel). (d) Estimated deposited Total (native) PAH, original data (left panel) and linear regression plot (right panel). The estimated deposited specific surface area (SSA), elemental carbon (EC), organic carbon (OC) and PAHs were calculated by multiplying the physicochemical values by the dose (EC and OC: dose in μg * EC fraction = deposited EC in μg; for SSA: dose in g * SSA m2/g = deposited SSA in g; for PAH: dose in g * PAH μg/g = deposited PAH in μg). The data was log-transformed for the linear regression analysis
Fig. 9
Fig. 9
Deposited surface area, EC, OC, and PAH correlations with Saa3 mRNA on day 1. (a) Estimated deposited surface area, original data (left panel) and linear regression plot (right panel). (b) Estimated deposited elemental carbon, original data (left panel) and linear regression plot (right panel). (c) Estimated deposited organic carbon, original data (left panel) and linear regression plot (right panel). (d) Estimated deposited Total (native) PAH, original data (left panel) and linear regression plot (right panel).The estimated deposited specific surface area (SSA), elemental carbon (EC), organic carbon (OC) and PAHs were calculated by multiplying the physicochemical values by the dose (EC and OC: dose in μg * EC fraction = deposited EC in μg; for SSA: dose in g * SSA m2/g = deposited SSA in g; for PAH: dose in g * PAH μg/g = deposited PAH in μg). The data was log-transformed for the linear regression analysis
Fig. 10
Fig. 10
ROS formation correlations with Tail Length in Comet assay on day 90. (a) BAL, original data (left panel), linear regression plot (right panel). (b) Lung, original data (left panel), linear regression plot (right panel). (c) Liver, original data (left panel), linear regression plot (right panel). ROS is given in arbitrary alfa-values. Data were log-transformed for the linear regression analysis

References

    1. International Agency for Research on Cancer Monographs database, 2010. https://monographs.iarc.fr/agents-classified-by-the-iarc/. Accessed 27 July 2018.
    1. Salvi S, Blomberg A, Rudell B, Kelly F, Sandström T, Holgate S, et al. Acute inflammatory responses in the airways and peripheral blood after short-term exposure to diesel exhaust in healthy human volunteers. Am J Respir Crit Care Med. 1999;159(3):702–709. doi: 10.1164/ajrccm.159.3.9709083. - DOI - PubMed
    1. Vermeulen R, Portengen L, Silverman DT, Garshick E, Steenland K. Meta-analysis of lung cancer risk from exposure to diesel exhaust: vermeulen et Al. Respond Environ Health Perspect. 2014;122(9):A230–A231. doi: 10.1289/ehp.1408428R. - DOI - PMC - PubMed
    1. Andersen MHG, Frederiksen M, Saber AT, Wils RS, Fonseca AS, Koponen IK, et al. Health effects of exposure to diesel exhaust in diesel-powered trains. Part Fibre Toxicol. 2019;16(1):21. doi: 10.1186/s12989-019-0306-4. - DOI - PMC - PubMed
    1. Saber AT, Bornholdt J, Dybdahl M, Sharma AK, Loft S, Vogel U, et al. Tumor necrosis factor is not required for particle-induced genotoxicity and pulmonary inflammation. Arch Toxicol. 2005;79(3):177–182. doi: 10.1007/s00204-004-0613-9. - DOI - PubMed

Publication types

LinkOut - more resources