. 2020 Dec:205:104396.
doi: 10.1016/j.cognition.2020.104396. Epub 2020 Aug 5.

Performance monitoring for sensorimotor confidence: A visuomotor tracking study

Affiliations

Performance monitoring for sensorimotor confidence: A visuomotor tracking study

Shannon M Locke et al. Cognition. 2020 Dec.

Abstract

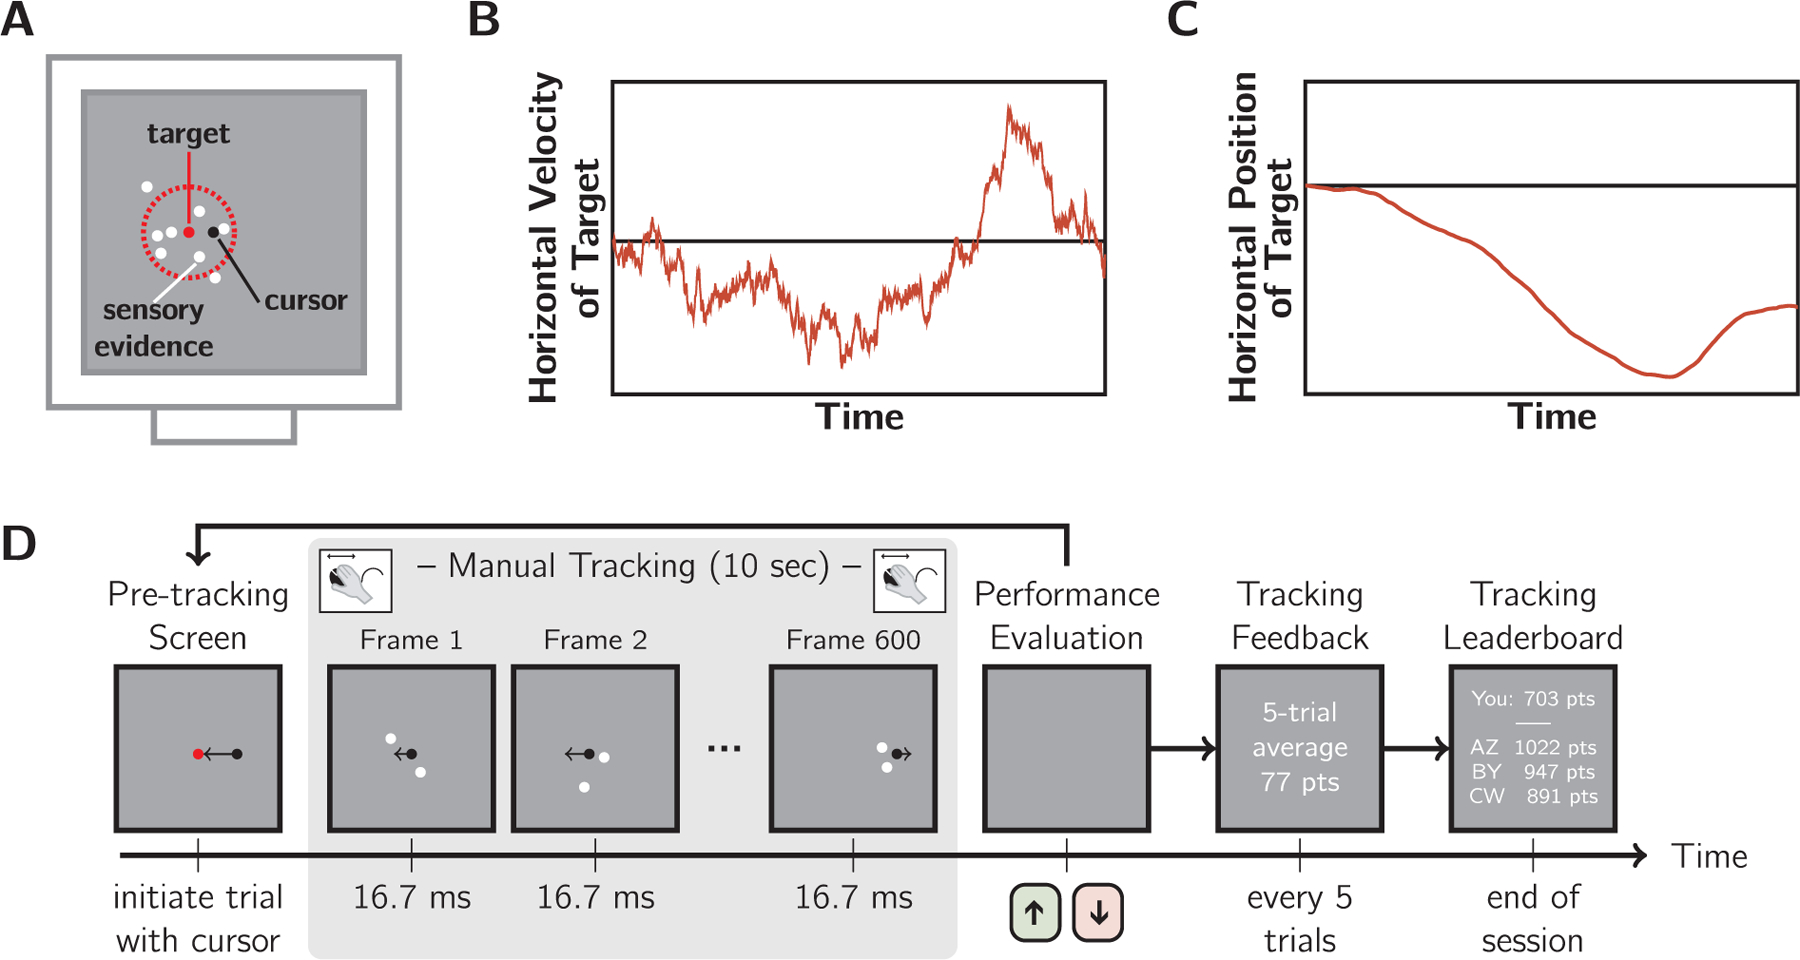
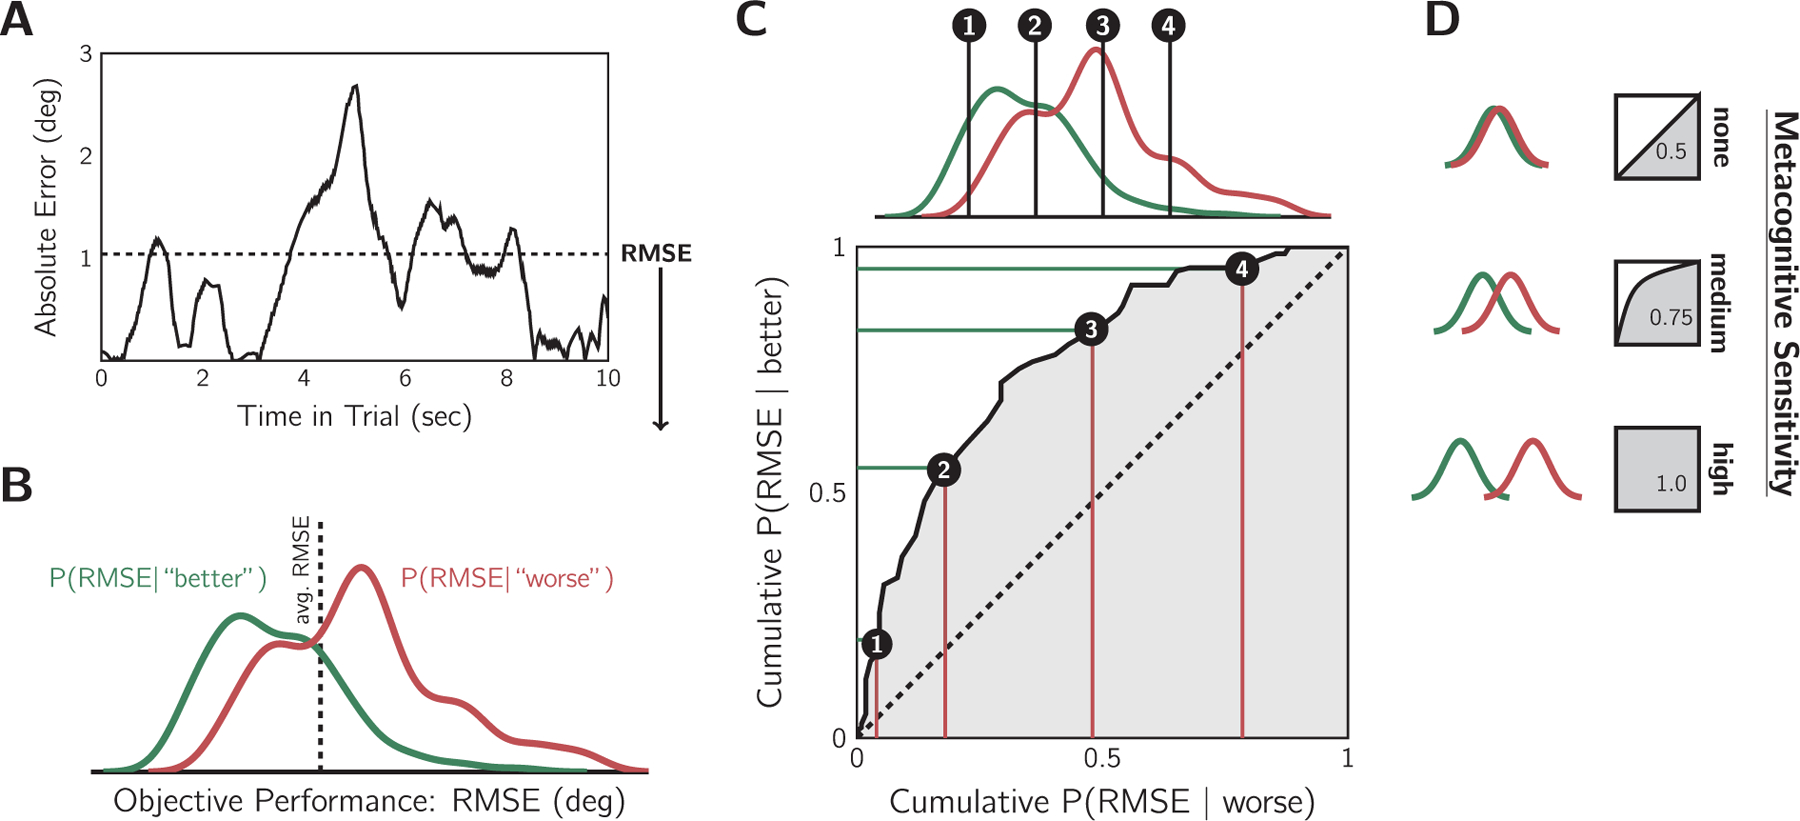
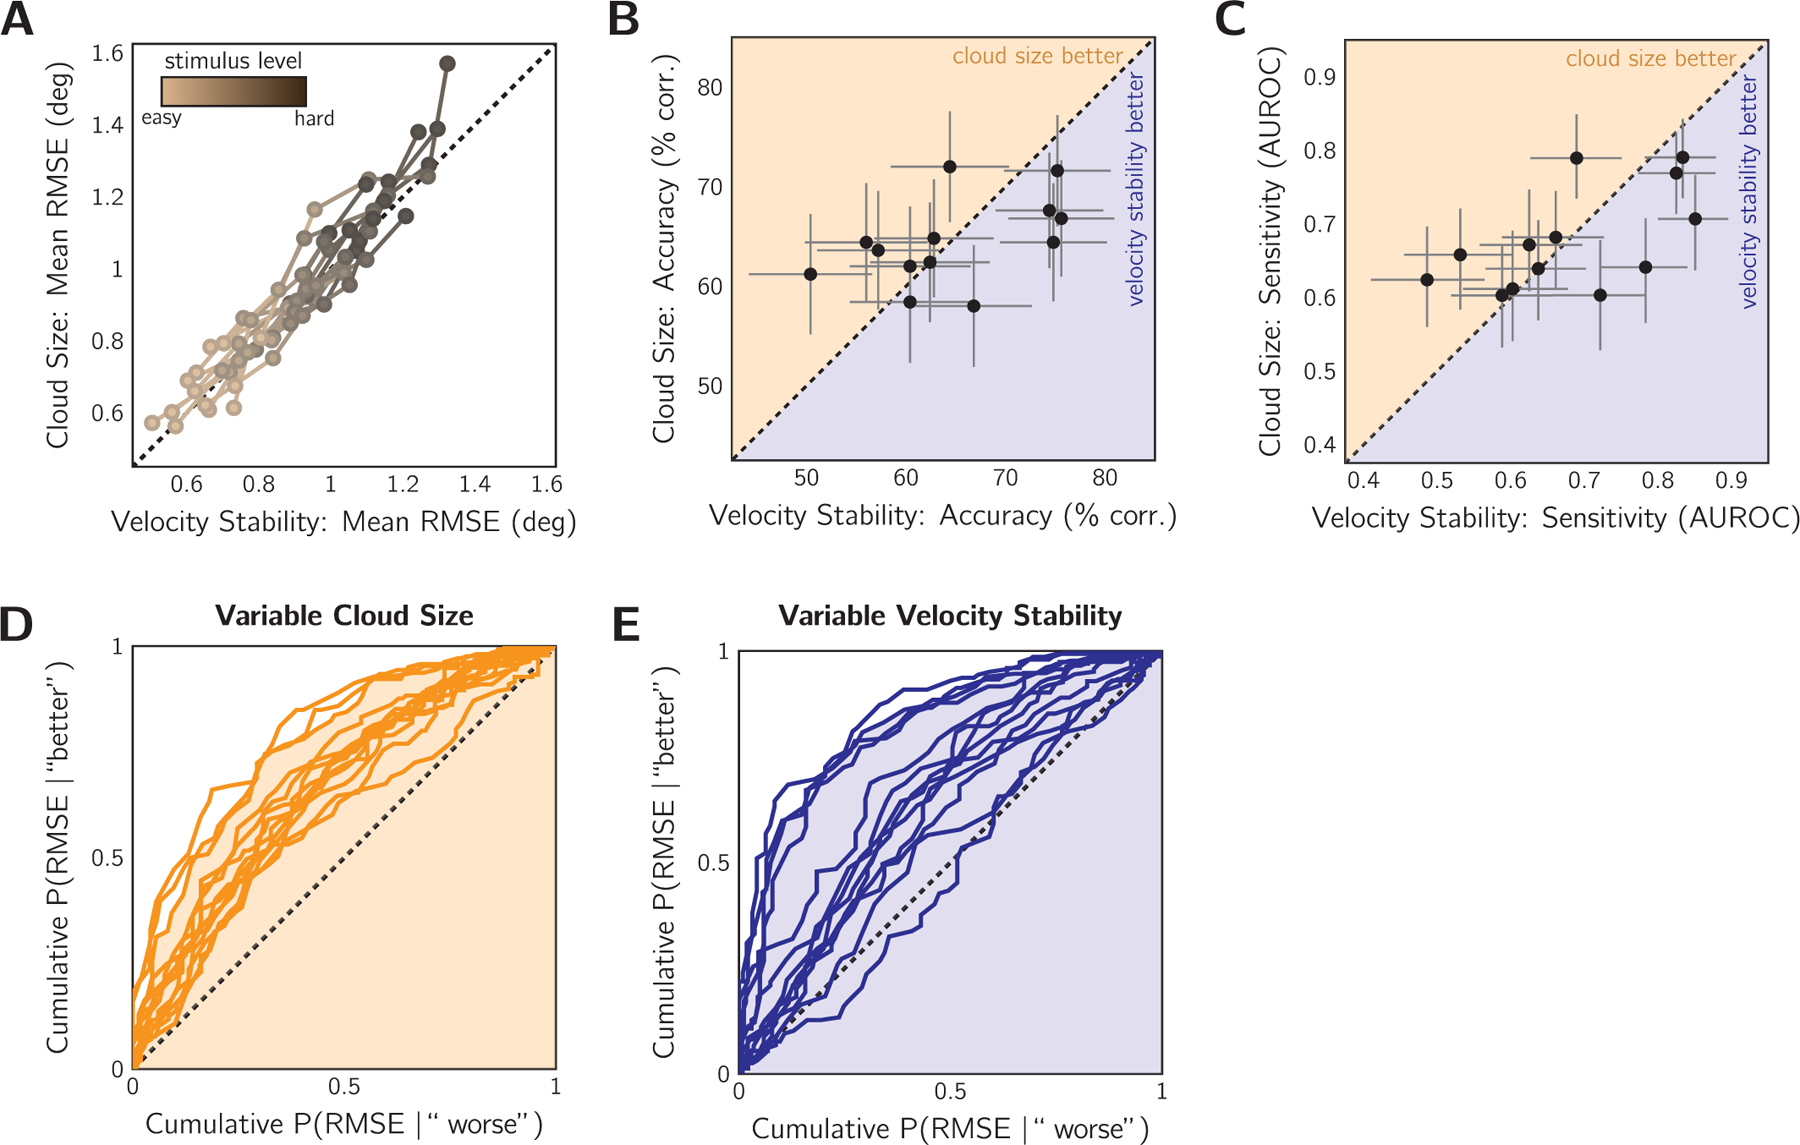
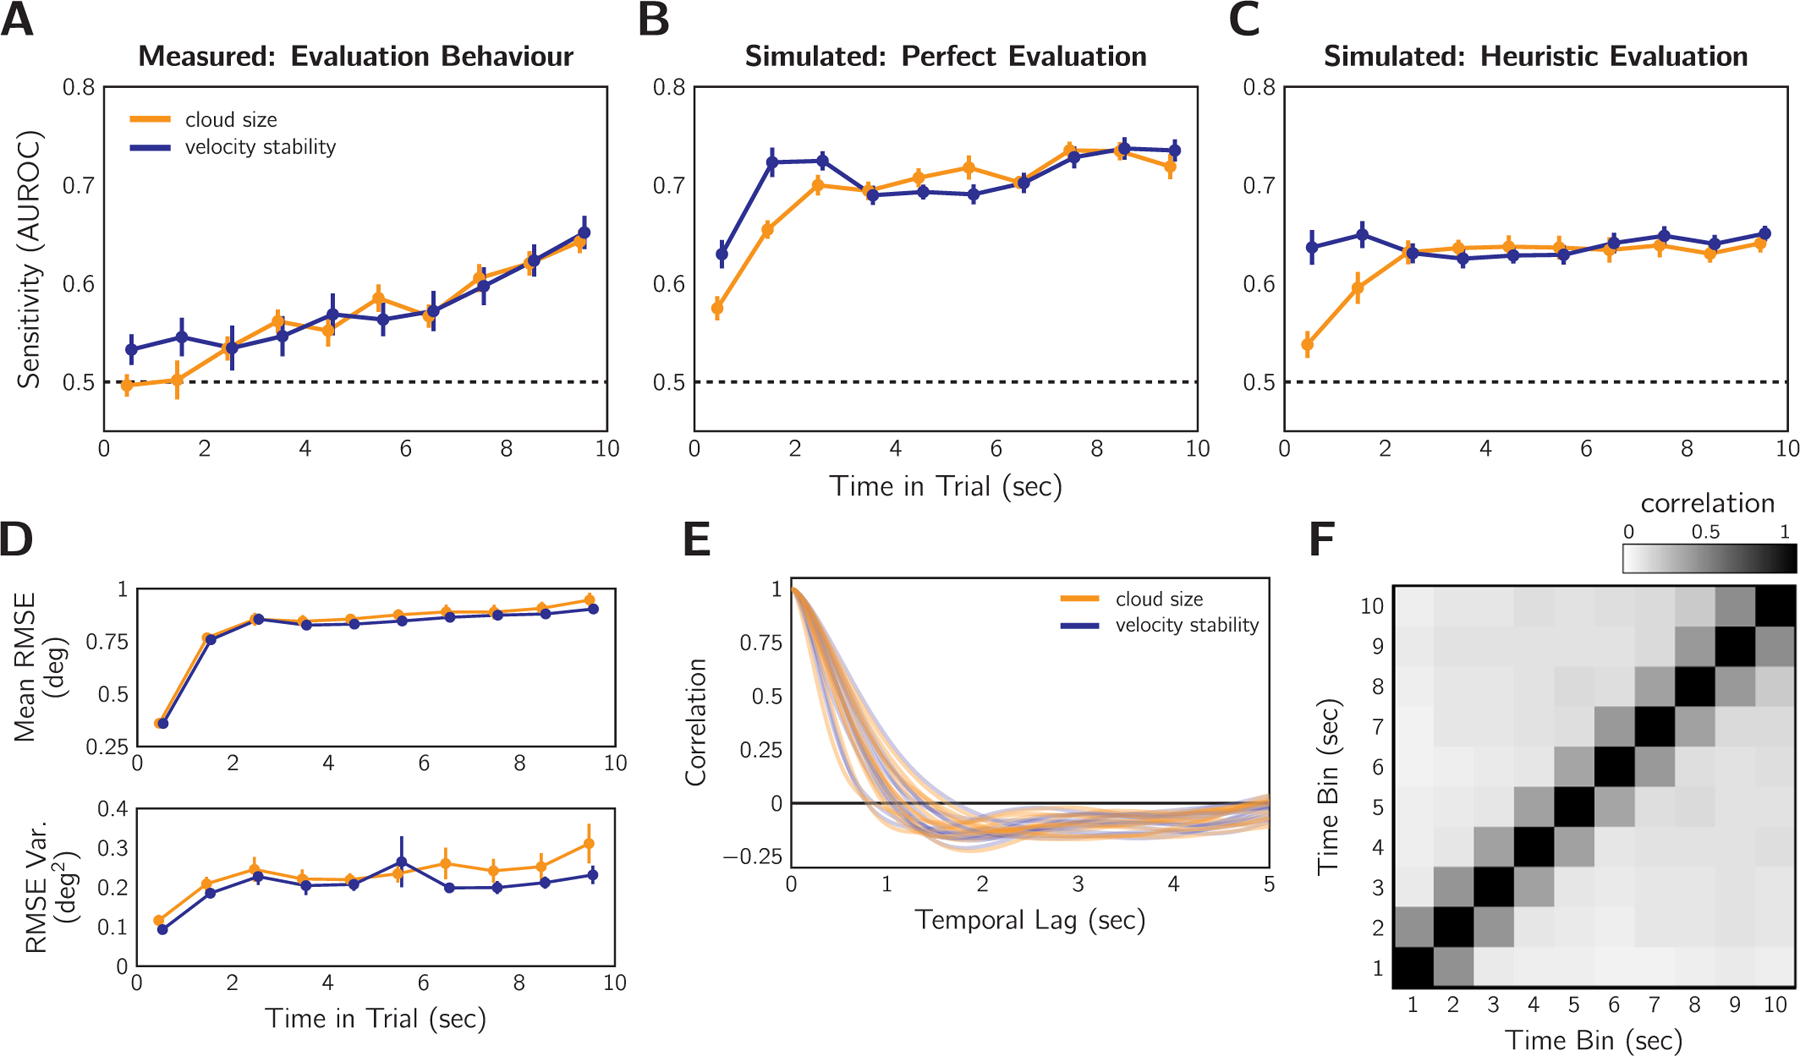
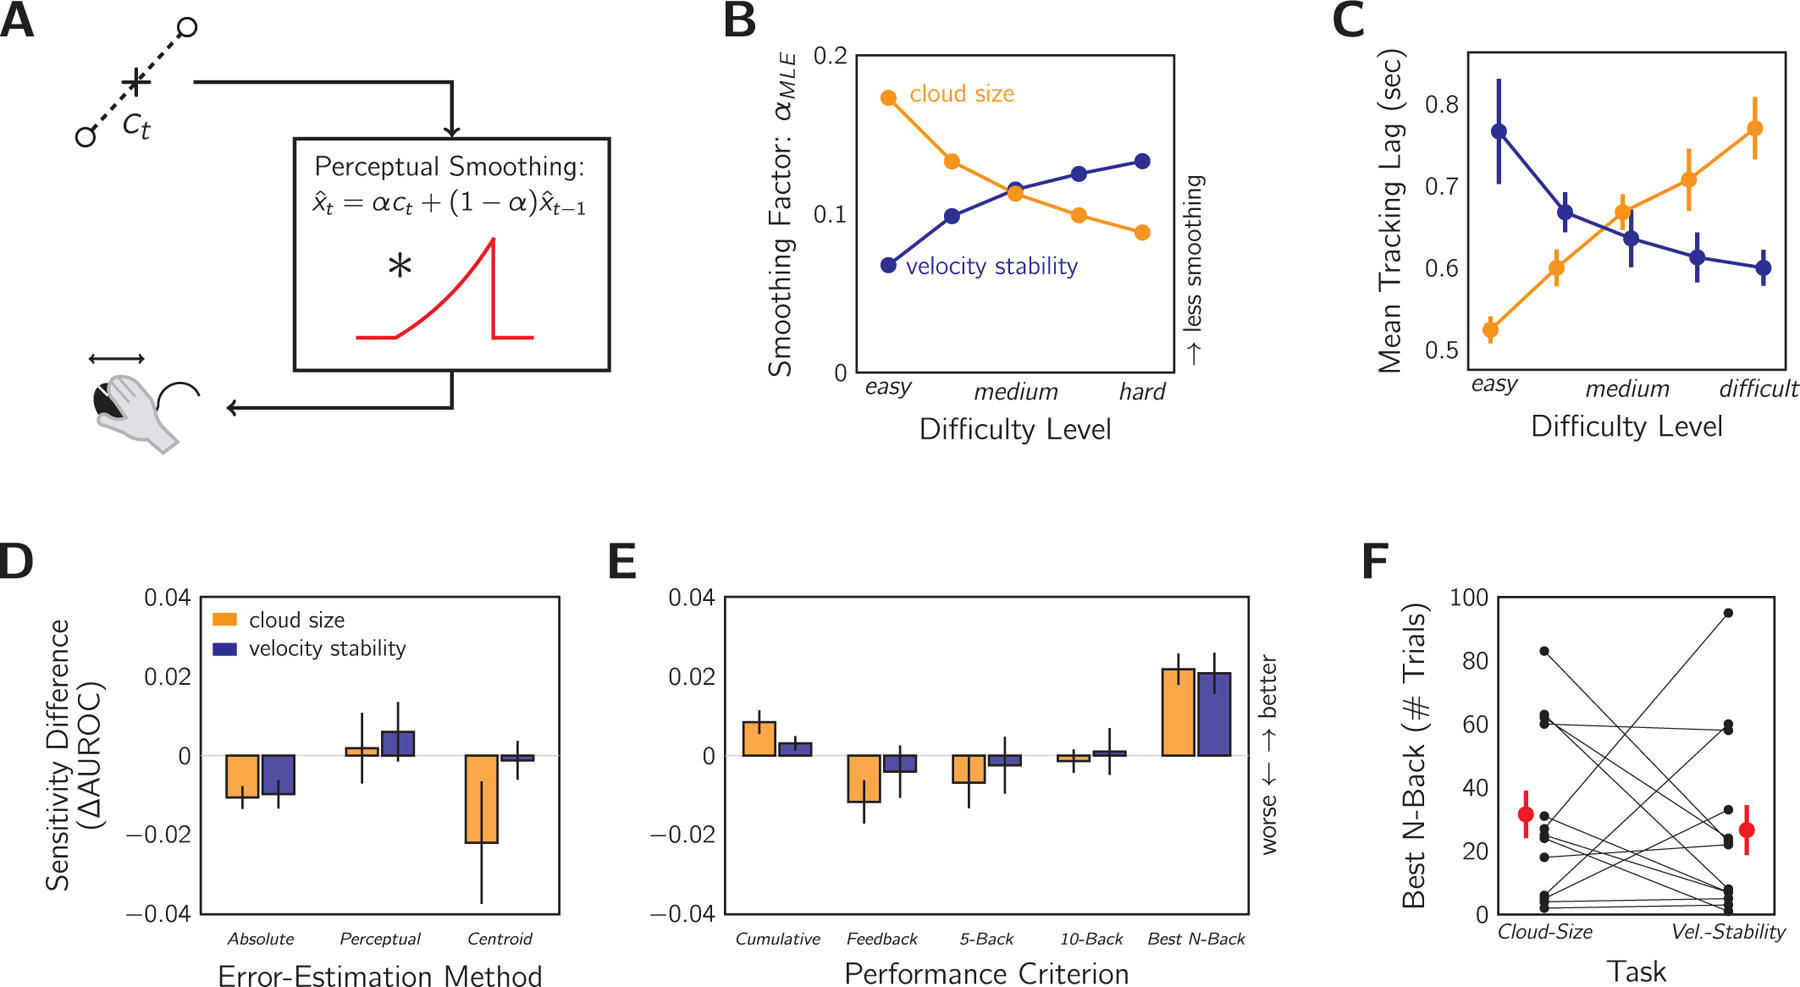
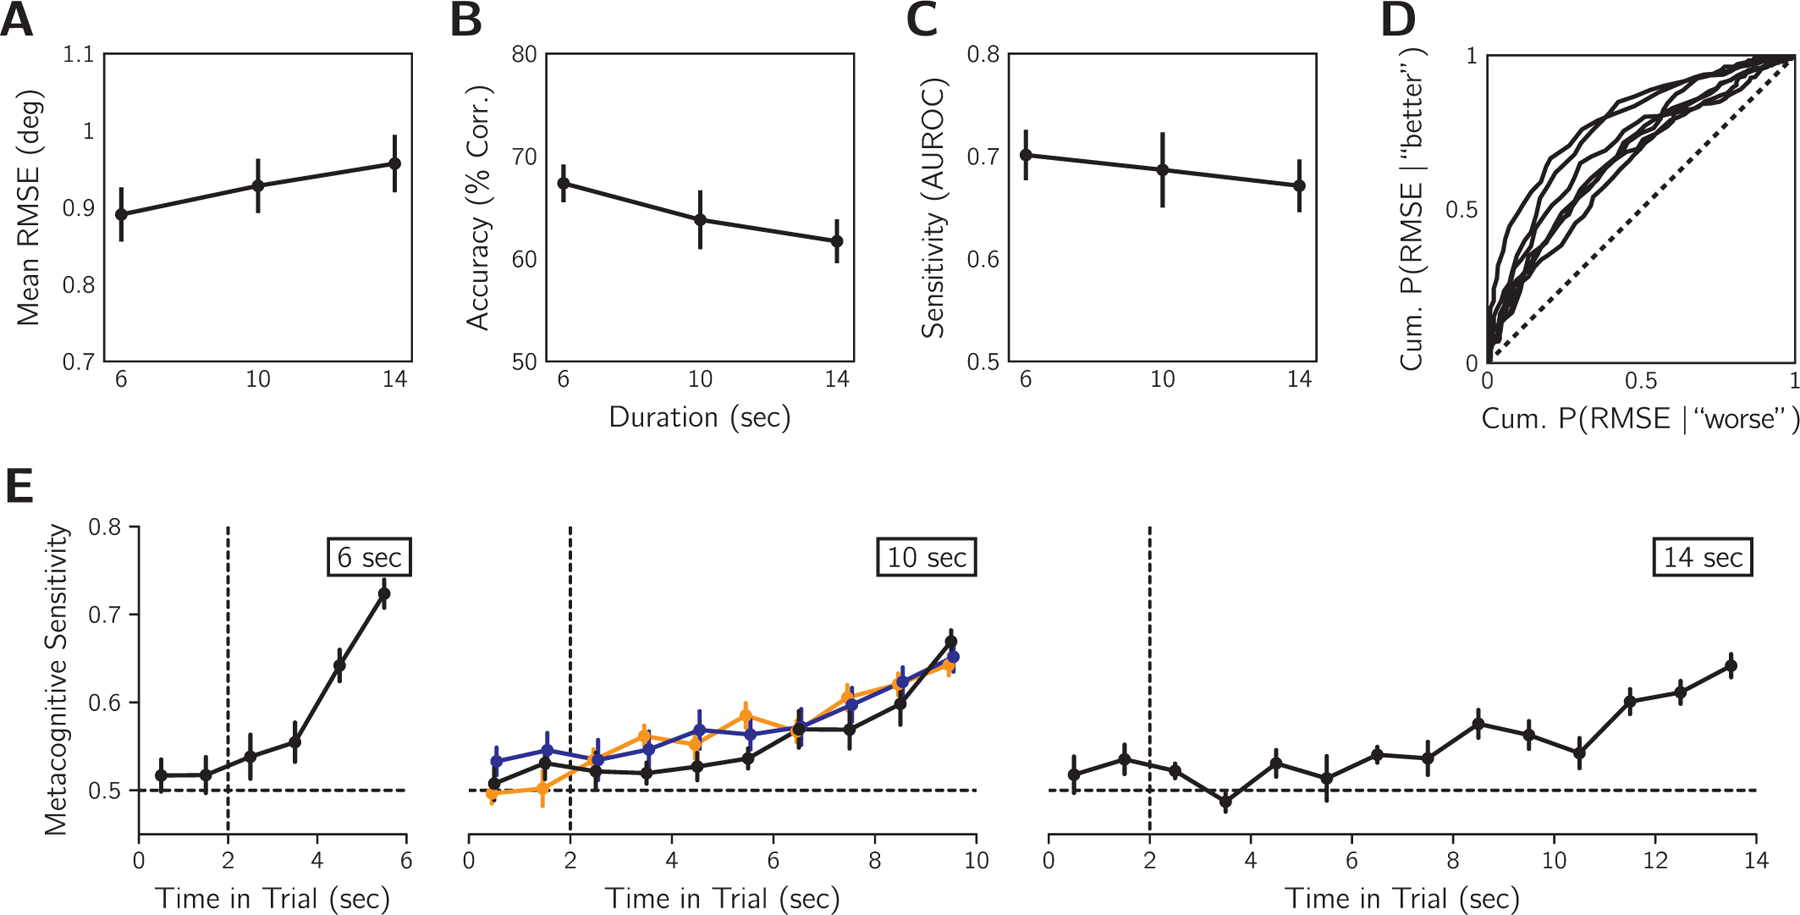
To best interact with the external world, humans are often required to consider the quality of their actions. Sometimes the environment furnishes rewards or punishments to signal action efficacy. However, when such feedback is absent or only partial, we must rely on internally generated signals to evaluate our performance (i.e., metacognition). Yet, very little is known about how humans form such judgements of sensorimotor confidence. Do they monitor their actual performance or do they rely on cues to sensorimotor uncertainty? We investigated sensorimotor metacognition in two visuomotor tracking experiments, where participants followed an unpredictably moving dot cloud with a mouse cursor as it followed a random horizontal trajectory. Their goal was to infer the underlying target generating the dots, track it for several seconds, and then report their confidence in their tracking as better or worse than their average. In Experiment 1, we manipulated task difficulty with two methods: varying the size of the dot cloud and varying the stability of the target's velocity. In Experiment 2, the stimulus statistics were fixed and duration of the stimulus presentation was varied. We found similar levels of metacognitive sensitivity in all experiments, which was evidence against the cue-based strategy. The temporal analysis of metacognitive sensitivity revealed a recency effect, where error later in the trial had a greater influence on the sensorimotor confidence, consistent with a performance-monitoring strategy. From these results, we conclude that humans predominantly monitored their tracking performance, albeit inefficiently, to build a sense of sensorimotor confidence.

Keywords: Action; Confidence; Metacognition; Perception; Sensorimotor; Tracking.


Figures

Fig. 1.
Fig. 1.
Components of sensorimotor control (left) and related topics in the literature (right). Sensorimotor confidence is a subjective evaluation of how well behaviour fulfilled the sensorimotor goal, considering both sensory and motor factors. The topic of sensorimotor confidence is complementary to the discussions of cognitive control, perceptual confidence, motor awareness, uncertainty, and self-generated feedback. It is likely that cues to difficulty and performance, that are responsible for the computation of sensorimotor confidence, originate both from sensory and motor sources. The former cues are prospective as they are related to how well the acting agent can potentially perform, whereas the latter are retrospective, they become available only after the action has occurred.
Fig. 2.
Fig. 2.
Visuomotor tracking task. A: The “twinkling” dot cloud stimulus (white), generated by drawing two dots per frame from a 2D Gaussian generating distribution. Red: mean and 1 SD circle, which were not displayed. Black: mouse cursor. The dots provided sensory evidence of target location (generating distribution mean). As illustrated, more than two dots were perceived at any moment due to temporal averaging in the visual system. B: Example target random-walk trajectory in velocity space. C: The corresponding horizontal trajectory of the target. D: Trial sequence. Trials were initiated by the observer, followed by 10 s of manual tracking of the inferred target with a computer mouse. Then, participants reported their sensorimotor confidence by indicating whether their performance on that trial was better or worse than their average. Objective performance feedback was provided intermittently including average points awarded and a final leaderboard. Difficulty manipulations: cloud size and velocity stability were varied in separate sessions.
Fig. 3.
Fig. 3.
A metacognitive sensitivity metric. A: Example of tracking error within a trial. Root-mean-squared-error (RMSE, dashed line) was the objective performance measure. B: Example participant’s objective-error distributions, conditioned on sensorimotor confidence, for all trials in the variable cloud-size session. True average performance (dashed line) indicates the ideal criterion. Smaller RMSE tended to elicit “better” reports, and larger RMSE “worse”. C: Metacognitive sensitivity was quantified by the separation of the conditional objective-error distributions with a non-parametric calculation of the Area Under the ROC (AUROC) using a quantile-quantile plot. At every point along the objective-performance axis, the cumulative probability of each conditional error distribution was contrasted. D: The area under the resulting curve is the AUROC statistic, with 0.5 indicating no meta-cognitive sensitivity and 1 indicating maximum sensitivity. The greater the separation of the conditional distributions, the more the objective tracking performance was predictive of sensorimotor confidence, and thus the higher the metacognitive sensitivity.
Fig. 4.
Fig. 4.
Comparable above-chance metacognitive sensitivity for cloud-size and velocity-stability difficulty manipulations in Experiment 1 (n = 13). A: Effect of difficulty manipulation on tracking error. Mean RMSE contrasted for equivalent difficulty levels in the variable cloud-size session and the variable velocity-stability session. Colour: difficulty level. Curves: individual participants. Dashed line: equivalent difficulty. B: Comparison of metacognitive accuracy for the two difficulty-manipulation techniques, pooled across difficulty levels. Data points: individual subjects. Dashed line: equivalent accuracy. Error bars: 95% binomial SE. Shaded regions indicate whether metacognitive accuracy was better for the cloud-size or velocity-stability session. C: Same as in (B) but comparing the sensitivity of the sensorimotor confidence judgement. Dashed line: equivalent sensitivity. Error bars: 95% confidence intervals by non-parametric bootstrap. D: ROC-style curves for individual participants in the cloud-size session, pooled across difficulty levels. Shading: AUROC of example observer. Dashed line: the no-sensitivity lower bound. E: Same as (D) for the velocity-stability session. Shading corresponds to the same example observer.
Fig. 5.
Fig. 5.
Performance weighting over time for sensorimotor confidence in Experiment 1 (n = 13). A: AUROC analysis performed based on each 1-s time bin in the tracking period. Error bars: SEM across participants. Error later in the trial is more predictive of sensorimotor confidence as indicated by the higher AUROC. B: The same analysis as in (A) for an ideal observer that has perfect knowledge of the error and compares the RMSE to the average RMSE. C: Temporal analysis performed with simulated responses based on expected performance according to the heuristic of difficulty level for each difficulty manipulation (see text). D: Mean and variance of the RMSE between target and cursor. Mean RMSE plateaus between 1 and 2 s and remains stable for the remainder of the trial. Variance is also quite stable after 2 s. Error bars: SEM across participants. E: Autocorrelation of the tracking error signal for each subject and each session. F: Autocorrelation matrix of the 1 s binned RMSE. Data pooled over trials, conditions, and participants. The correlation between time-bins is relatively low after 1 s.
Fig. 6.
Fig. 6.
Comparing metacognitive sensitivity with different error-estimation methods and performance criteria. A: Diagram of the exponentially-smoothed perceptual model. Input: horizontal position of the dot-cloud centroid, ct (i.e., dot midpoint on a single frame). The perceptual system smooths the signal by convolving with an exponential to produce the target estimate x^. This is equivalent to the weighted sum of current input and previous estimate, x^t1, according to the smoothing parameter, α. Output: perceived error determines the motor response. B: Setting of α that minimises the difference between true and perceived target location for each difficulty level and condition. C: Tracking lag as a measure of perceptual smoothing. As per the expected effects of difficulty level on perceptual smoothing (B), we found the corresponding X pattern in average tracking lags measured by a cross-correlation analysis (see text for details). Note that a larger α means greater weight on the current estimate and therefore less tracking lag. D: Metacognitive sensitivity AUROC as measured under several error-estimation methods compared to the standard RMSE method reported throughout. Absolute: mean absolute error between target and cursor. Perceptual: error according to the perceptual model in (A) with α values from (B). Centroid: RMSE calculated using dot-cloud centroid rather than true target location. Positive values indicate that this method yields higher sensitivity than the standard method. E: Same as in (D) but testing different performance criteria, comparing to the true-average criterion reported throughout. Cumulative: average error on a per-trial basis ignoring future performance. Feedback: last 5-trial performance feedback as criterion. N-back: windowed average of last N trials. Optimal calculated as N between 1 and 100 that maximises the AUROC. F: Computed optimal N for each condition. Black: individual participants. Red: group mean ± SEM.
Fig. 7.
Fig. 7.
Effect of variable stimulus-presentation duration on tracking error and sensorimotor confidence in Experiment 2 (n = 7). A: Mean objective tracking performance for each duration condition averaged across observers. B: Sensorimotor-confidence accuracy for each duration condition. C: Metacognitive sensitivity for each duration condition. D: ROC-style curves for individual participants for AUROC pooled across durations. Dashed line: the no-sensitivity lower bound. Error before 2 s was excluded from the calculations in panels A-D. E: Temporal AUROCs calculated for 1 s time bins for each duration condition averaged across participants for Experiment 2 (black). For comparison, the results in Fig. 4A are replotted (orange: cloud-size session; blue: velocity-stability session). The recency effect found in Experiment 1 is replicated here for Experiment 2. Vertical dashed line at 2 s indicates the timing of cursor colour-change cue to begin evaluating tracking. Horizontal dashed line: the no-sensitivity line. Error bars in all graphs are SEM.

Similar articles

Cited by

References

    1. Adler WT, & Ma WJ (2018). Comparing Bayesian and non-Bayesian accounts of human confidence reports. PLoS Computational Biology, 14(11), Article e1006572. - PMC - PubMed
    1. Alexander WH, & Brown JW (2010). Computational models of performance monitoring and cognitive control. Topics in Cognitive Science, 2(4), 658–677. - PMC - PubMed
    1. Atkinson RC, & Shiffrin RM (1968). Human memory: A proposed system and its control processes. Psychology of Learning and Motivation, 2, 89–195.
    1. Augustyn JS, & Rosenbaum DA (2005). Metacognitive control of action: Preparation for aiming reflects knowledge of Fitts’s law. Psychonomic Bulletin and Review, 12(5), 911–916. - PubMed
    1. Baranski JV, & Petrusic WM (1998). Probing the locus of confidence judgments: Experiments on the time to determine confidence. Journal of Experimental Psychology: Human Perception and Performance, 24(3), 929–945. - PubMed

Publication types

LinkOut - more resources