. 2020 Nov 1:345:108852.
doi: 10.1016/j.jneumeth.2020.108852. Epub 2020 Aug 6.

Out-of-focus brain image detection in serial tissue sections

Affiliations

Out-of-focus brain image detection in serial tissue sections

Angeliki Pollatou et al. J Neurosci Methods. .

Abstract

Background: A large part of image processing workflow in brain imaging is quality control which is typically done visually. One of the most time consuming steps of the quality control process is classifying an image as in-focus or out-of-focus (OOF).

New method: In this paper we introduce an automated way of identifying OOF brain images from serial tissue sections in large datasets (>1.5 PB). The method utilizes steerable filters (STF) to derive a focus value (FV) for each image. The FV combined with an outlier detection that applies a dynamic threshold allows for the focus classification of the images.

Results: The method was tested by comparing the results of our algorithm with a visual inspection of the same images. The results support that the method works extremely well by successfully identifying OOF images within serial tissue sections with a minimal number of false positives.

Comparison with existing methods: Our algorithm was also compared to other methods and metrics and successfully tested in different stacks of images consisting solely of simulated OOF images in order to demonstrate the applicability of the method to other large datasets.

Conclusions: We have presented a practical method to distinguish OOF images from large datasets that include serial tissue sections that can be included in an automated pre-processing image analysis pipeline.

Keywords: Bright-field microscopy; Filters; Fluorescence microscopy; Focus; Image analysis; Image processing; Whole slide imaging.


Conflict of interest statement

Declaration of Competing Interest

None.

Figures

Figure C.12:
Figure C.12:
Flowchart of our proposed method.
Figure 1:
Figure 1:
Examples of different fluorescent (first row), Nissl stained (second row), immunohistochemistry stained images (third row) from our datasets. Images (a), (d), (g) depict an image with an artifact on the sample, air bubbles on the folded sample and a damaged image respectively. OOF images are presented in (b), (e), (h), while in-focus images are shown in (c), (f) and (i). Note that our images and included samples are not all the same size and the samples are not always centered in the image.
Figure 2:
Figure 2:
Example of fluorescent image that is OOF when magnified. The image in full view does not look OOF but once the image is magnified (A and B) the image is clearly OOF. A magnified view of a similar area from a different image that is not OOF is included (C) for comparison.
Figure 3:
Figure 3:
Example of fluorescent image that is partially OOF. We have magnified two regions of interest from the same image. It is shown that, even though both regions are from the same image, the upper region (A) is OOF while the lower region (B) is in-focus.
Figure 4:
Figure 4:
Steerable filter response versus angle for one individual pixel with coordinates x=4500, y=4500
Figure 5:
Figure 5:
Ratio of FV of sharp vs OOF images for different steerable filter kernel sizes from a sample of different brain image datasets. The numbers displayed in the legend indicate the brain dataset. The graphs suggest that 15×15 pixels is the optimal kernel size for the spatial scale of structures in our particular sample.
Figure 6:
Figure 6:
OOF candidate detection using the FV versus slice (or image) ID for different brain image datasets. The black (○) symbol represents all image scores, the straight blue line is the moving median and the OOF candidates are shown as the red (*) symbol. The FV has been normalized to its maximum value for every dataset.
Figure 7:
Figure 7:
Nissl stained sections from stack 3079 identified as OOF from the algorithm (Figure 6b) and confirmed visually. Sections 121 and 142 have to be magnified in order to be visually confirmed as OOF images.
Figure 8:
Figure 8:
Sample image tiles and their classification with different methods (shown in Table 6).
Figure 9:
Figure 9:
Different methods for identifying OOF images in a fluorescent dataset. The red asterisks (*) denote the images that were identified as OOF visually. The STF metric clearly differentiates the OOF and in-focus images while the SML metric places four images close to the main branch so the outlier detection will classify them as in-focus. The middle panel shows the BRISQUE scores for all images in the dataset. We notice that there is no pattern for our visual OOF images, some of them are closer to one and some are close to the smaller values of the dataset. A smaller BRISQUE score indicates a better quality image so we expect the OOF images to be clustered towards the highest values. Therefore this metric would not be appropriate for our dataset since there is no consistency in the location of the OOF images.
Figure 10:
Figure 10:
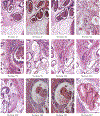
Color images of tissue sections of a mouse prostate (Kartasalo et al., 2018). All images, except sections 21 and 181 that are used for comparison, were artificially blurred with different kernels.
Figure 11:
Figure 11:
Outlier detection plot with our proposed method. The black (◊) symbol represents all the data, the blue line is the moving median and the red (◊) data points are the simulated OOF images which were identified as OOF from our algorithm.

References

    1. Barker J, Hoogi A, Depeursinge A, & Rubin DL (2016). Automated classification of brain tumor type in whole-slide digital pathology images using local representative tiles. Medical image analysis, 30, 60–71. - PubMed
    1. Bohland JW, Wu C, Barbas H, Bokil H, Bota M, Breiter HC, Cline HT, Doyle JC, Freed PJ, Greenspan RJ et al. (2009). A proposal for a coordinated effort for the determination of brainwide neuroanatomical connectivity in model organisms at a mesoscopic scale. PLoS computational biology, 5, e1000334. - PMC - PubMed
    1. Bray M-A, & Carpenter A (2017). Imaging Platform, Broad Institute of MIT and Harvard. Advanced Assay Development Guidelines for Image-Based High Content Screening and Analysis. 2017 Jul 8., In: Sittampalam GS, Grossman A, Brimacombe K, et al., editors. Assay Guidance Manual [Internet]. Bethesda (MD): Eli Lilly and Company and the National Center for Advancing Translational Sciences; 2004-. Available from: https://www.ncbi.nlm.nih.gov/books/NBK126174/. - PubMed
    1. Bray M-A, Fraser AN, Hasaka TP, & Carpenter AE (2012). Workflow and metrics for image quality control in large-scale high-content screens. Journal of biomolecular screening, 17, 266–274. - PMC - PubMed
    1. Campanella G, Rajanna AR, Corsale L, Schüffler PJ, Yagi Y, & Fuchs TJ (2018). Towards machine learned quality control: A benchmark for sharpness quantification in digital pathology. Computerized Medical Imaging and Graphics, 65, 142–151. - PMC - PubMed

Publication types

MeSH terms

LinkOut - more resources