Electrical Stimulation Evokes Rotational Behavior In Tandem with Exocytotic-like Increases in Dopamine Measured by In Vivo Intracerebral Microdialysis
- PMID: 32771372
- PMCID: PMC7606747
- DOI: 10.1016/j.jneumeth.2020.108894
Electrical Stimulation Evokes Rotational Behavior In Tandem with Exocytotic-like Increases in Dopamine Measured by In Vivo Intracerebral Microdialysis
Abstract
Background: Electrical Stimulation is a traditional tool in neuroscience and is commonly used in vivo to evoke behavior and in vitro to study neural mechanisms. In vivo intracerebral microdialysis, also a traditional technique, is used to assay neurotransmitter release. However, the combination of these techniques is highly limited to studies using anesthetized animals; therefore, evoking and measuring exocytotic neurotransmitter release in awake models is lacking. Combining these techniques in an awake animal preparation is presented here with evidence to support the mechanistic action of electrical stimulation in vivo.
New methods: This report presents converging evidence to validate the combination of intracerebral electrical stimulation with microdialysis as a novel procedure to study exocytotic-like dopamine release in behaving animals.
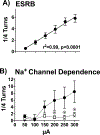
Results: It is shown that electrical stimulation of the medial forebrain bundle can be used to evoke frequency- and intensity-dependent exocytotic-like dopamine overflow and rotational behavior that are sensitive to Na+ channel blockade and Ca++ availability.
Comparison with existing methods: Studies using modern techniques to evoke neurotransmitter release, combined with in vivo intracerebral microdialysis, and measured behavioral output are scarce. In contrast, commonly used pharmacological methods often are less precise and inefficient to evoke exocytotic dopamine release and behavior. Here we demonstrate, the combination of in vivo intracerebral microdialysis with electrical stimulation as a simple approach to simultaneously assess physiologically relevant neurotransmitter 'release' and behavior.
Conclusions: Research that aims to understand how dopamine neurotransmission is altered in behavioral disorders can utilize this innovative combination of electrical stimulation with in vivo intracerebral microdialysis.
Keywords: Electrical stimulation; calcium; exocytosis; nigrostriatal dopamine; rotational behavior; sodium channels.
Published by Elsevier B.V.
Figures


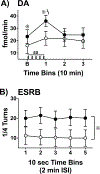
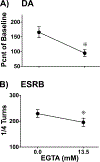
 , p< 0.05) that returned to baseline levels immediately upon termination of ES. In the lidocaine condition, there were no significant differences across time. Na+ channel blockade significantly attenuated ES-evoked extracellular DA compared to control conditions (∗, p< 0.05). B) ESRB (Mean ± SEM) was measured in quarter turns during each 10-sec train of ES applied during the 10-min dialysis interval immediately following baseline measures (see Interval 1 of X-Axis in Fig. 5A). Prior to lidocaine (●) all animals demonstrated vigorous contraversive turning in response to ES. Lidocaine (○) significantly reduced ESRB compared to control conditions (∗, p< 0.05). Note that the rate of turning was sustained across the 5 trains of ES in both conditions.
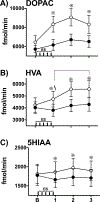
 , p<0.05). After lidocaine, ES increased overall HVA overflow (average of samples 1, 2, 3) compared to baseline levels (planned T test, p < 0.05; data not shown, see Results). Extracellular HVA levels were enhanced by lidocaine during and after ES compared to the control condition (Sidak, ∗, p’s< 0.05, pairwise comparison within each time interval). C) 5HIAA: In the control condition, 5HIAA levels did not change across repeated sampling. In contrast, after lidocaine, ES increased overall 5HIAA overflow (average of samples 1, 2, 3) compared to baseline levels (planned T test, p < 0.05; data not shown, see Results). These statistical analyses reveal a main effect by lidocaine and an interaction effect by lidocaine and ES to enhance extracellular 5HIAA levels compared to the control condition (Sidak, ∗, p’s< 0.05, pairwise comparison within each time interval).
References
-
- Abdi H (2007). The Bonferonni and Šidák corrections for multiple comparisons In Salkind NJ (Ed.), Encyclopedia of measurement and statistics (pp.103–107). Sage; 10.4135/9781412952644 - DOI
-
- Abercrombie ED, & Zigmond MJ (1989). Partial injury to central noradrenergic neurons: reduction of tissue norepinephrine content is greater than reduction of extracellular norepinephrine measured by microdialysis. The Journal of Neuroscience, 9(11), 4062–4067. 10.1523/JNEUROSCI.09-11-04062.1989 - DOI - PMC - PubMed
Publication types
MeSH terms
Substances
Grants and funding
LinkOut - more resources
Full Text Sources

