

Phenotypic and gene expression features associated with variation in chronic ethanol consumption in heterogeneous stock collaborative cross mice
- PMID: 32771621
- PMCID: PMC7749084
- DOI: 10.1016/j.ygeno.2020.08.004
Phenotypic and gene expression features associated with variation in chronic ethanol consumption in heterogeneous stock collaborative cross mice
Abstract
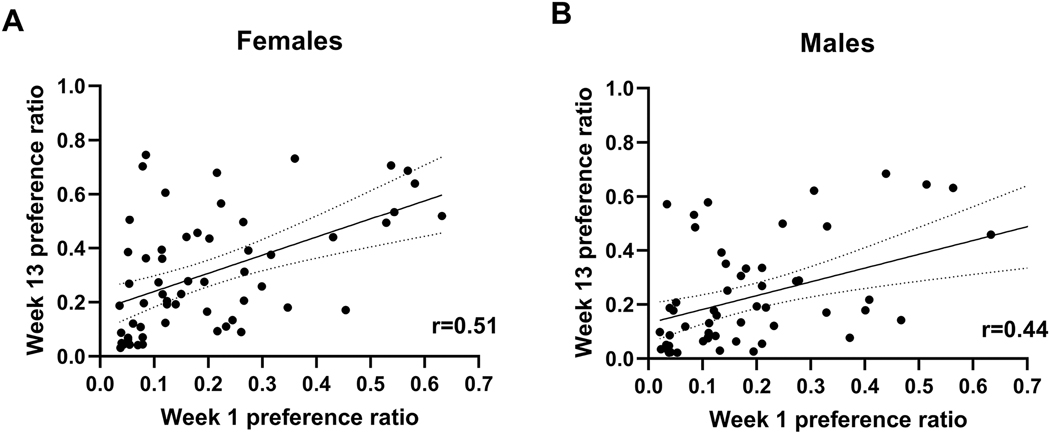
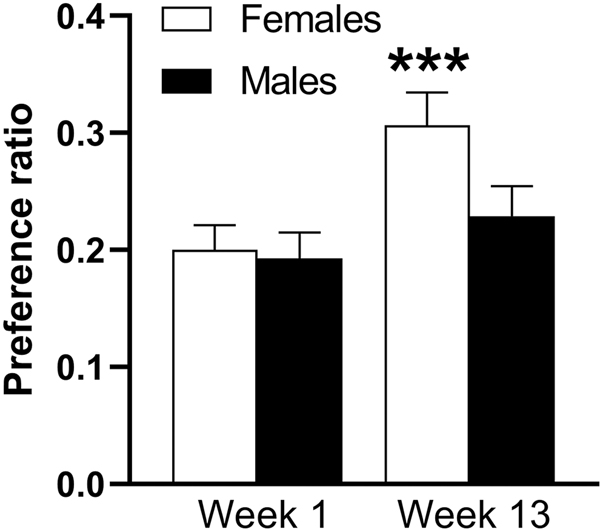
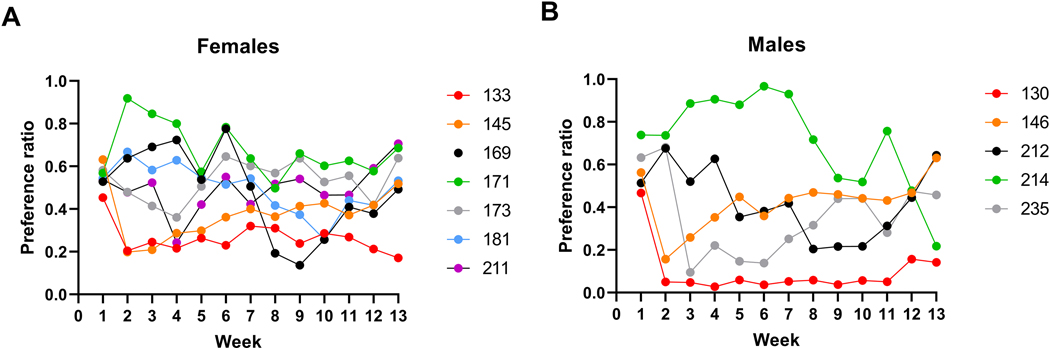
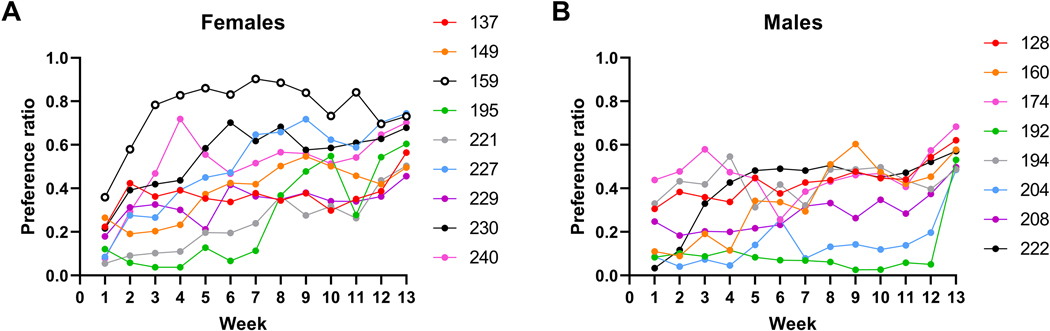
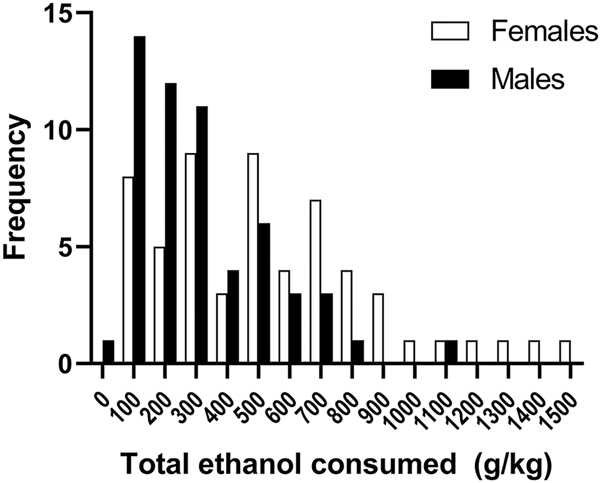
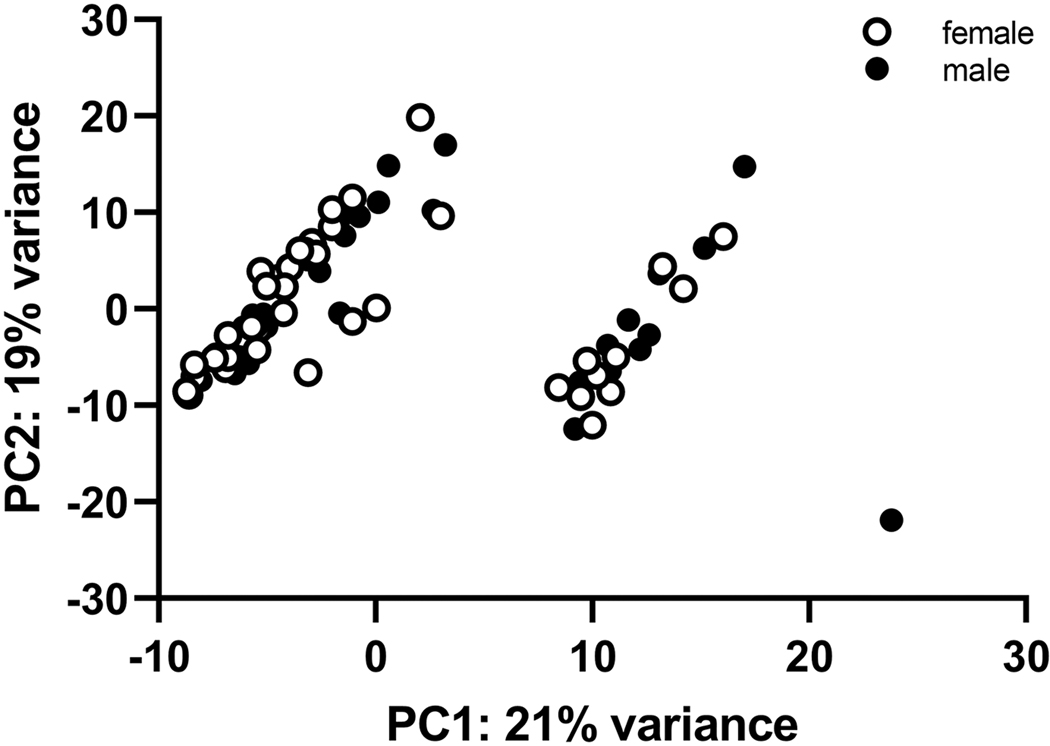
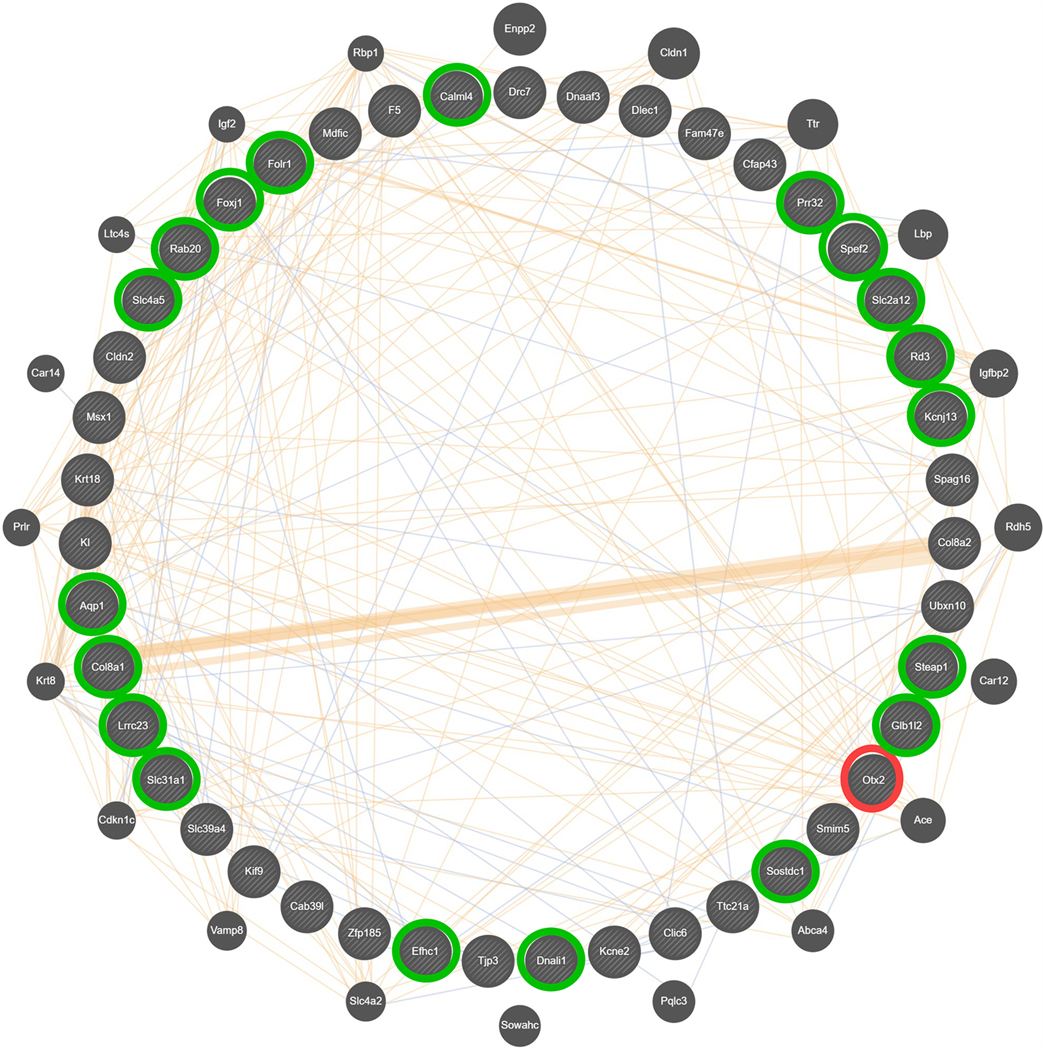
Of the more than 100 studies that have examined relationships between excessive ethanol consumption and the brain transcriptome, few rodent studies have examined chronic consumption. Heterogeneous stock collaborative cross mice freely consumed ethanol vs. water for 3 months. Transcriptional differences were examined for the central nucleus of the amygdala, a brain region known to impact ethanol preference. Early preference was modestly predictive of final preference and there was significant escalation of preference in females only. Genes significantly correlated with female preference were enriched in annotations for the primary cilium and extracellular matrix. A single module in the gene co-expression network was enriched in genes with an astrocyte annotation. The key hub node was the master regulator, orthodenticle homeobox 2 (Otx2). These data support an important role for the extracellular matrix, primary cilium and astrocytes in ethanol preference and consumption differences among individual female mice of a genetically diverse population.
Keywords: Addiction; Alcohol; Drinking; Ethanol preference; RNA-Seq; Sex differences.
Published by Elsevier Inc.
Conflict of interest statement
Conflicts of interest
The authors declare that they have no competing financial interests. The contents of this article do not represent the views of the U.S. Department of Veterans Affairs or the United States government.
Figures
Similar articles
-
Effects of selection for ethanol preference on gene expression in the nucleus accumbens of HS-CC mice.Genes Brain Behav. 2017 Apr;16(4):462-471. doi: 10.1111/gbb.12367. Epub 2017 Feb 9. Genes Brain Behav. 2017. PMID: 28058793 Free PMC article.
-
On the relationships in rhesus macaques between chronic ethanol consumption and the brain transcriptome.Addict Biol. 2018 Jan;23(1):196-205. doi: 10.1111/adb.12501. Epub 2017 Feb 28. Addict Biol. 2018. PMID: 28247455 Free PMC article.
-
RNA-Seq Analysis of Genetic and Transcriptome Network Effects of Dual-Trait Selection for Ethanol Preference and Withdrawal Using SOT and NOT Genetic Models.Alcohol Clin Exp Res. 2020 Apr;44(4):820-830. doi: 10.1111/acer.14312. Epub 2020 Mar 16. Alcohol Clin Exp Res. 2020. PMID: 32090358 Free PMC article.
-
Sex Differences in the Brain Transcriptome Related to Alcohol Effects and Alcohol Use Disorder.Biol Psychiatry. 2022 Jan 1;91(1):43-52. doi: 10.1016/j.biopsych.2021.04.016. Epub 2021 May 1. Biol Psychiatry. 2022. PMID: 34274109 Free PMC article. Review.
-
On the Use of Heterogeneous Stock Mice to Map Transcriptomes Associated With Excessive Ethanol Consumption.Front Psychiatry. 2021 Oct 12;12:725819. doi: 10.3389/fpsyt.2021.725819. eCollection 2021. Front Psychiatry. 2021. PMID: 34712155 Free PMC article. Review.
Cited by
-
Unveiling Sex-Based Differences in the Effects of Alcohol Abuse: A Comprehensive Functional Meta-Analysis of Transcriptomic Studies.Genes (Basel). 2020 Sep 21;11(9):1106. doi: 10.3390/genes11091106. Genes (Basel). 2020. PMID: 32967293 Free PMC article.
-
Cilia loss on distinct neuron populations differentially alters cocaine-induced locomotion and reward.J Psychopharmacol. 2024 Feb;38(2):200-212. doi: 10.1177/02698811231219058. Epub 2023 Dec 27. J Psychopharmacol. 2024. PMID: 38151883 Free PMC article.
-
Low bone mass and impaired fracture healing in mouse models of Trisomy21 (Down syndrome).Bone. 2022 Sep;162:116471. doi: 10.1016/j.bone.2022.116471. Epub 2022 Jun 15. Bone. 2022. PMID: 35716916 Free PMC article.
-
Heritability of ethanol consumption and pharmacokinetics in a genetically diverse panel of collaborative cross mouse strains and their inbred founders.Alcohol Clin Exp Res. 2021 Apr;45(4):697-708. doi: 10.1111/acer.14582. Epub 2021 Apr 7. Alcohol Clin Exp Res. 2021. PMID: 33619752 Free PMC article.
-
Adolescent binge ethanol impacts H3K36me3 regulation of synaptic genes.Front Mol Neurosci. 2023 Mar 3;16:1082104. doi: 10.3389/fnmol.2023.1082104. eCollection 2023. Front Mol Neurosci. 2023. PMID: 36937047 Free PMC article.
References
Publication types
MeSH terms
Grants and funding
LinkOut - more resources
Full Text Sources
Medical
Research Materials
