

Transmission onset distribution of COVID-19
- PMID: 32771633
- PMCID: PMC7409940
- DOI: 10.1016/j.ijid.2020.07.075
Transmission onset distribution of COVID-19
Erratum in
-
Corrigendum to "Transmission onset distribution of COVID-19" [Int. J. Infect. Dis. 99(October) (2020) 403-407].Int J Infect Dis. 2021 Feb;103:645. doi: 10.1016/j.ijid.2020.11.186. Epub 2020 Dec 14. Int J Infect Dis. 2021. PMID: 33358478 Free PMC article. No abstract available.
Abstract
Objectives: The distribution of the transmission onset of COVID-19 relative to the symptom onset is a key parameter for infection control. It is often not easy to study the transmission onset time, as it is difficult to know who infected whom exactly when.
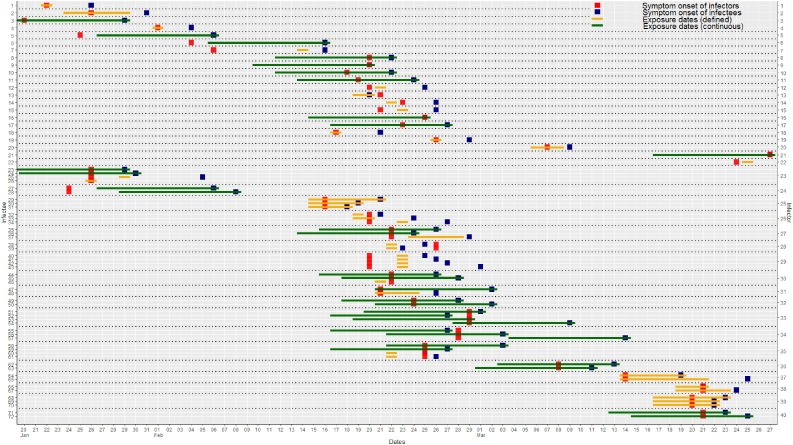
Methods: We inferred transmission onset time from 72 infector-infectee pairs in South Korea, either with known or inferred contact dates, utilizing the incubation period. Combining this data with known information of the infector's symptom onset, we could generate the transmission onset distribution of COVID-19, using Bayesian methods. Serial interval distribution could be automatically estimated from our data.
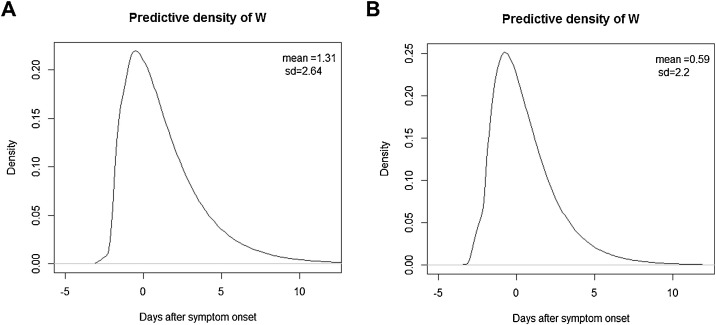
Results: We estimated the median transmission onset to be 1.31 days (standard deviation, 2.64 days) after symptom onset with a peak at 0.72 days before symptom onset. The pre-symptomatic transmission proportion was 37% (95% credible interval [CI], 16-52%). The median incubation period was estimated to be 2.87 days (95% CI, 2.33-3.50 days), and the median serial interval to be 3.56 days (95% CI, 2.72-4.44 days).
Conclusions: Considering that the transmission onset distribution peaked with the symptom onset and the pre-symptomatic transmission proportion is substantial, the usual preventive measures might be too late to prevent SARS-CoV-2 transmission.
Keywords: COVID-19; Infectious disease incubation period; Infectious disease transmission; SARS-CoV-2.
Copyright © 2020 The Author(s). Published by Elsevier Ltd.. All rights reserved.
Figures
References
-
- Coronavirus Disease-19, Republic of Korea; Available from: http://ncov.mohw.go.kr/. [Accessed 12 April 2020].
-
- Coronavirus disease 2019 (COVID-19) Situation Report–52; Available from: https://www.who.int/docs/default-source/coronaviruse/situation-reports/2.... [Accessed 30 March 2020].
-
- https://www.who.int/emergencies/diseases/novel-coronavirus-2019Coronavirus disease (COVID-19) Pandemic; Available from: . [Accessed 7 May 2020].
-
- COVID-19 Response Status; Available from: https://blog.naver.com/gyeonggi_gov/221856148207. [Accessed 10 April 2020].
-
- COVID-19 Situation Report (Gyeonggi); Available from: https://www.gg.go.kr/bbs/board.do?bsIdx=722&menuId=2903#page=21. [Accessed 10 April 2020].
MeSH terms
LinkOut - more resources
Full Text Sources
Miscellaneous
