. 2020 Dec:42:101059.
doi: 10.1016/j.molmet.2020.101059. Epub 2020 Aug 7.

Overexpression of the vitamin D receptor (VDR) induces skeletal muscle hypertrophy

Affiliations

Overexpression of the vitamin D receptor (VDR) induces skeletal muscle hypertrophy

Joseph J Bass et al. Mol Metab. 2020 Dec.

Abstract

Objective: The Vitamin D receptor (VDR) has been positively associated with skeletal muscle mass, function and regeneration. Mechanistic studies have focused on the loss of the receptor, with in vivo whole-body knockout models demonstrating reduced myofibre size and function and impaired muscle development. To understand the mechanistic role upregulation of the VDR elicits in muscle mass/health, we studied the impact of VDR over-expression (OE) in vivo before exploring the importance of VDR expression upon muscle hypertrophy in humans.

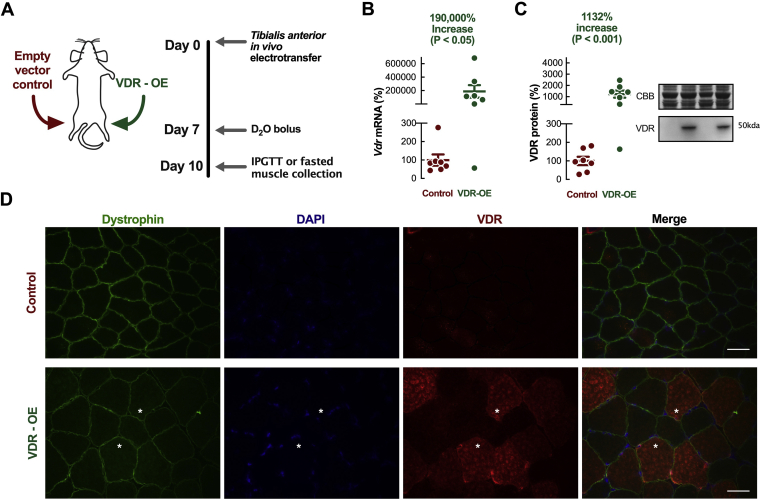
Methods: Wistar rats underwent in vivo electrotransfer (IVE) to overexpress the VDR in the Tibialis anterior (TA) muscle for 10 days, before comprehensive physiological and metabolic profiling to characterise the influence of VDR-OE on muscle protein synthesis (MPS), anabolic signalling and satellite cell activity. Stable isotope tracer (D2O) techniques were used to assess sub-fraction protein synthesis, alongside RNA-Seq analysis. Finally, human participants underwent 20 wks of resistance exercise training, with body composition and transcriptomic analysis.

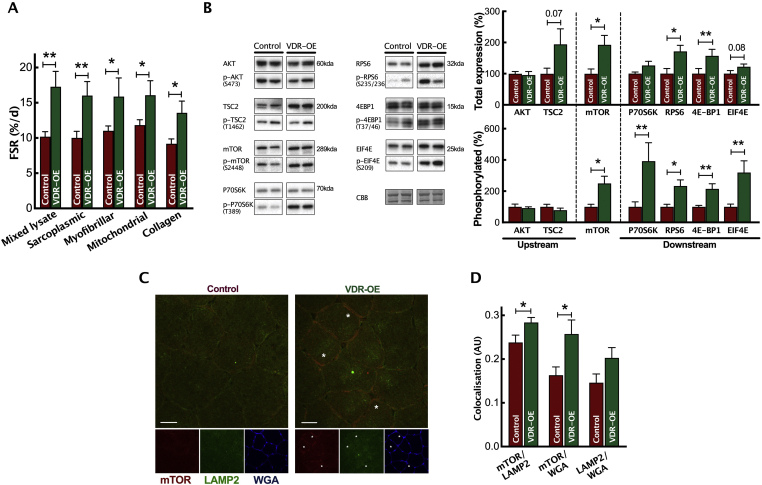
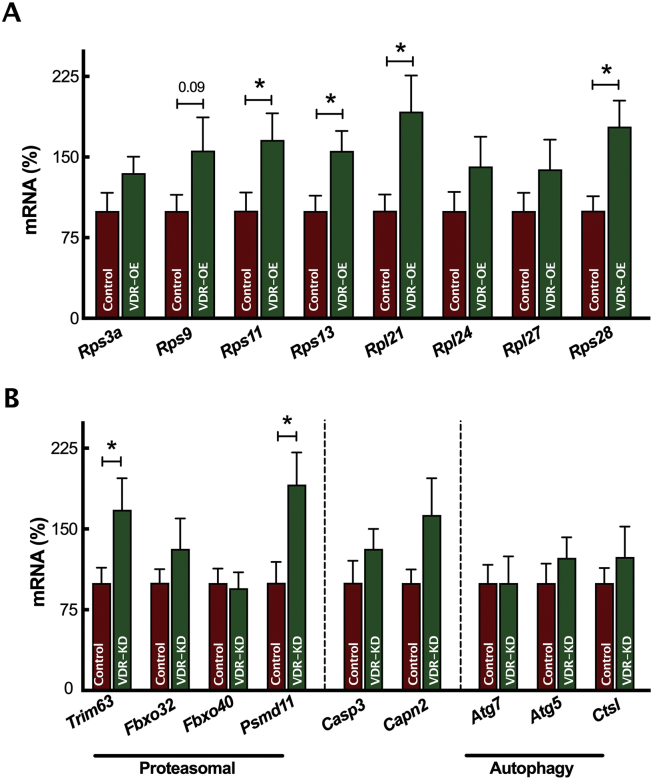
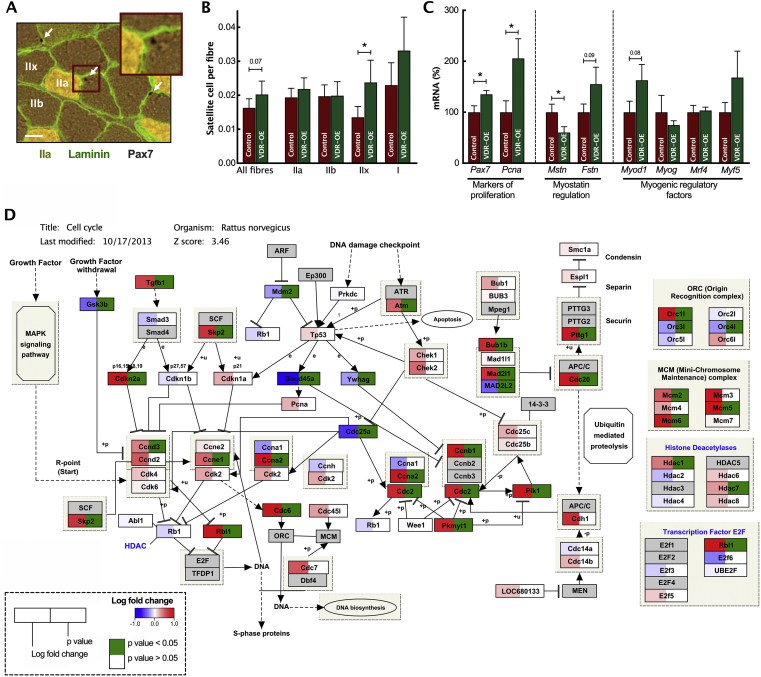
Results: Muscle VDR-OE yielded total protein and RNA accretion, manifesting in increased myofibre area, i.e., hypertrophy. The observed increases in MPS were associated with enhanced anabolic signalling, reflecting translational efficiency (e.g., mammalian target of rapamycin (mTOR-signalling), with no effects upon protein breakdown markers being observed. Additionally, RNA-Seq illustrated marked extracellular matrix (ECM) remodelling, while satellite cell content, markers of proliferation and associated cell-cycled related gene-sets were upregulated. Finally, induction of VDR mRNA correlated with muscle hypertrophy in humans following long-term resistance exercise type training.

Conclusion: VDR-OE stimulates muscle hypertrophy ostensibly via heightened protein synthesis, translational efficiency, ribosomal expansion and upregulation of ECM remodelling-related gene-sets. Furthermore, VDR expression is a robust marker of the hypertrophic response to resistance exercise in humans. The VDR is a viable target of muscle maintenance through testable Vitamin D molecules, as active molecules and analogues.

Keywords: Exercise; Metabolism; Skeletal muscle; Vitamin D.


Figures

Figure 1
Figure 1
In vivo experimental design and grouping. (A) Schematic design of in vivo paired contralateral experiments. (B) Confirmation of contralateral VDR-OE by qRT-PCR (n = 7). (C) Representative western blot and quantification of VDR-OE (=7n). (D) Representative images of muscle fibres stained for dystrophin (green), DAPI (blue) and VDR (red). Scale bars represent 200 μm. Data are mean ± SEM. Significance indicated measured by paired t-test. (For interpretation of the references to color in this figure legend, the reader is referred to the Web version of this article.)
Figure 2
Figure 2
In vivo VDR-OE results in muscle fibre hypertrophy. (A) All fibre CSA analysis, (B) Type IIa and (C) IIb fibre CSA distribution. Three random fields of view were measured per section in both L and R TA muscles in each animal (n = 7), with CSA measured for all intact fibres. (D) Alkaline soluble protein measures, (E) RNA and (F) DNA quantification per mg of dried muscle (n = 7). (G) Glucose uptake measured by 3H—2-deoxyglucose tracer uptake (n = 9). (H) Muscle glycogen content (n = 5). Data are mean ± SEM. Significance by paired t-test.
Figure 3
Figure 3
In vivo VDR-OE increases anabolic signalling and translational efficiency. (A) Measurement of MPS rates of mixed lysate, sarcoplasmic, myofibrillar, mitochondrial and collagen protein subfractions by D2O incorporation (n = 7). (B) Representative western blots and quantification of phosphorylated and total protein anabolic signalling intermediates (n = 7). CBB, Coomassie Brillian Blue. (C) Representative images of mTOR and LAMP2 co-localisation. (D) Quantification of mTOR and LAMP2 co-localisation (n = 7). Data are mean ± SEM. ∗p < 0.05, ∗∗p < 0.01 between indicated groups. (For interpretation of the references to color in this figure legend, the reader is referred to the Web version of this article.)
Figure 4
Figure 4
In vivo VDR-OE enhances ribosomal biogenesis. qRT-PCR measurement of (A) ribosomal and (B) proteolytic related gene expression (n = 7). Data are mean ± SEM. ∗p < 0.05 between indicated groups.
Figure 5
Figure 5
VDR-OE upregulates hypertrophy and extracellular remodelling related gene-sets. (A) Volcano plot of p < 0.05 statistically significant up-/downregulated genes. (B) Top five upregulated and downregulated gene-sets from the molecular signatures database in VDR-OE muscles (n = 7). See also Supplemental File 1.
Figure 6
Figure 6
In vivo VDR-OE results in increased satellite cell content. (A) Representative image of muscle fibres stained for Pax7 (Black), Laminin (Green) and IIa fibres (Yellow). Arrows signify Pax7+ nuclei of satellite cells and subsequent quantification (B). (C) qRT-PCR measurement for markers of proliferation and MRFs (n = 7). (D) RNA-Seq pathway analysis of Rattus norvegicus cell cycle gene expression. Log fold changes are shown as a gradient from red (upregulated) to blue (downregulated). P-values <0.05 are displayed as green. Scale bars represent 200 μm. Data are mean ± SEM. ∗p < 0.05, ∗∗p < 0.01 between indicated groups. (For interpretation of the references to color in this figure legend, the reader is referred to the Web version of this article.)
Figure 7
Figure 7
VDR expression in humans correlated with increases in lean mass from RET. (A) % Δ 1-RM vs. % Δ Vdr (n = 37). (B) % Δ Lean mass vs. % Δ Vdr (n = 37). (C) VDR expression in quartile groups of changes in lean mass. (D) % Δ 1-RM vs. Δ Plasma Vitamin D (n = 37). (E) % Δ Lean mass vs. Δ Plasma Vitamin D (VitD) (n = 37). (F) % Δ Cyp27b1 vs. % Δ Vdr (n = 37). (G) % Δ Cyp24a1 vs. % Δ Vdr (n = 37). (H) Post training HOMA-IR vs. Δ Plasma VitD (n = 37). (H) Post training HOMA-IR vs. % Δ Vdr (n = 37). (J) Representation of VitD metabolism. All % Δ changes are between pre- and post-training. Column data are mean ± SEM. ∗p < 0.05 between indicated groups.

Similar articles

Cited by

References

    1. Arthur W., Ham M.D.L. Hypervitaminosis D rickets: the action of vitamin D. British Journal of Experimental Pathology. 1934;228
    1. Rizzoli R., Boonen S., Brandi M.L., Burlet N., Delmas P., Reginster J.Y. The role of calcium and vitamin D in the management of osteoporosis. Bone. 2008;42(2):246–249. doi: 10.1016/j.bone.2007.10.005. - DOI - PubMed
    1. Norman A.W. From vitamin D to hormone D: fundamentals of the vitamin D endocrine system essential for good health. American Journal of Clinical Nutrition. 2008;88(2):491S–499S. doi: 10.1093/ajcn/88.2.491S. - DOI - PubMed
    1. van der Meijden K., Bravenboer N., Dirks N.F., Heijboer A.C., den Heijer M., de Wit G.M.J. Effects of 1,25(OH)2D3 and 25(OH)D3 on C2C12 myoblast proliferation, differentiation, and myotube hypertrophy. Journal of Cellular Physiology. 2016;25(March) - PMC - PubMed
    1. Dhanwal D.K., Dharmshaktu P., Gautam V.K., Gupta N., Saxena A. Hand grip strength and its correlation with vitamin D in Indian patients with hip fracture. Archives of Osteoporosis. 2013;8(1–2):158. doi: 10.1007/s11657-013-0158-8. - DOI - PubMed

Publication types

MeSH terms