

Comparative infection modeling and control of COVID-19 transmission patterns in China, South Korea, Italy and Iran
- PMID: 32771775
- PMCID: PMC7397934
- DOI: 10.1016/j.scitotenv.2020.141447
Comparative infection modeling and control of COVID-19 transmission patterns in China, South Korea, Italy and Iran
Abstract
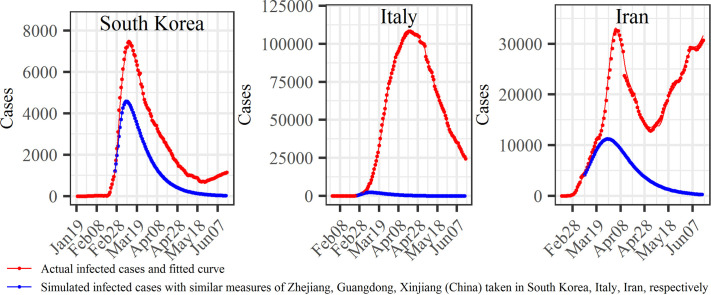
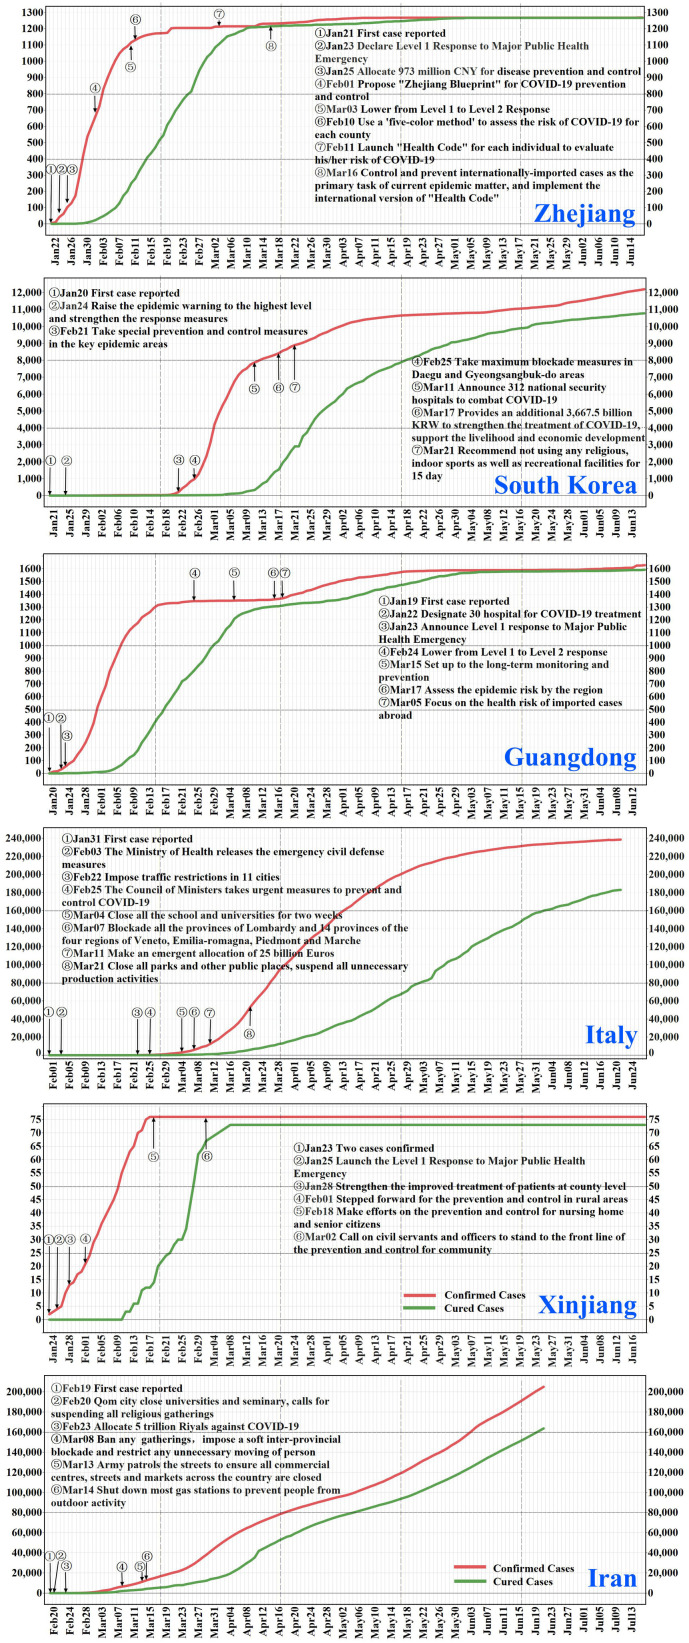
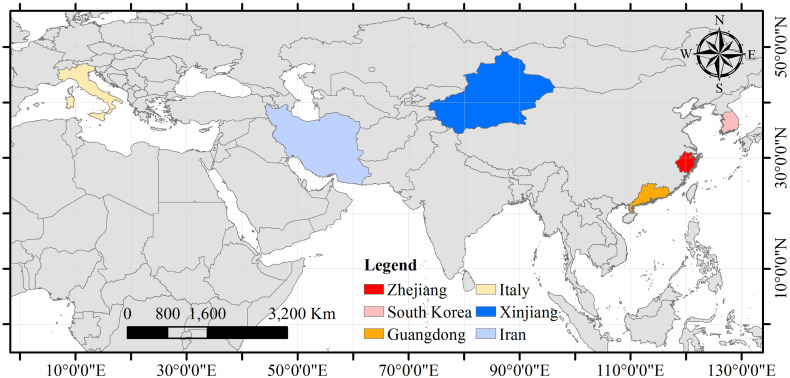
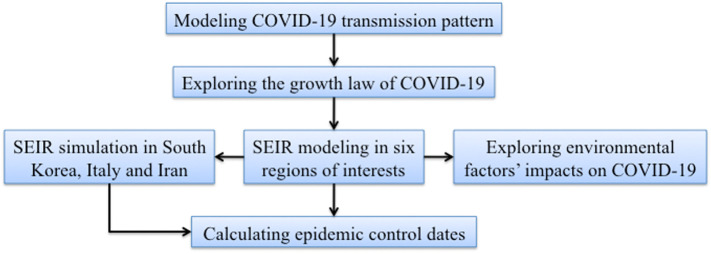
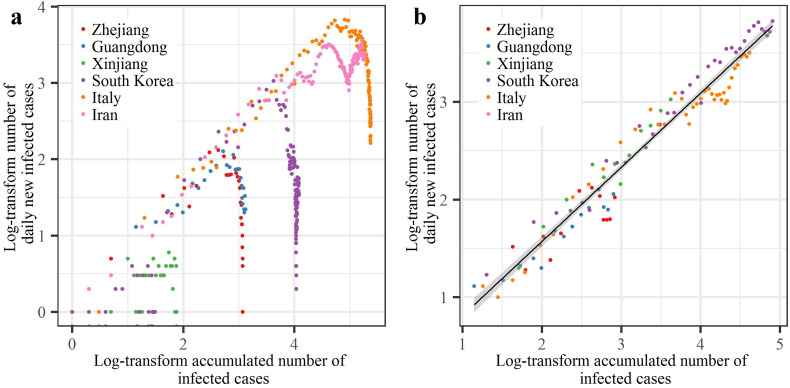
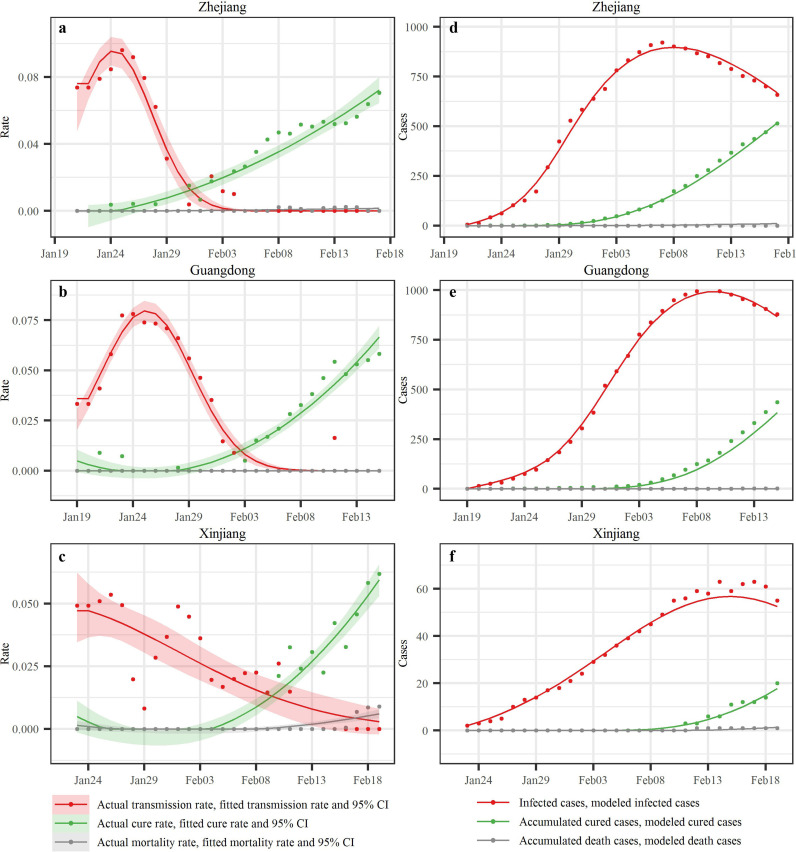
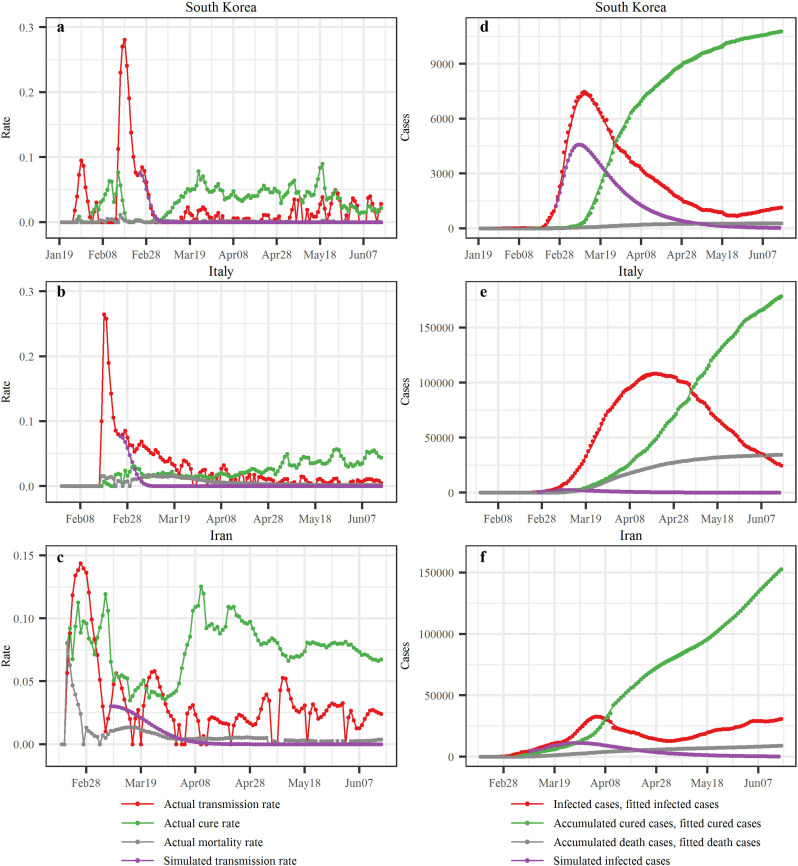
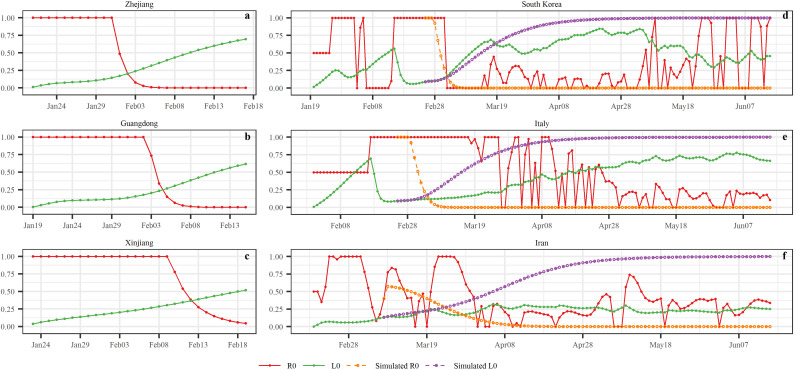
The COVID-19 has become a pandemic. The timing and nature of the COVID-19 pandemic response and control varied among the regions and from one country to the other, and their role in affecting the spread of the disease has been debated. The focus of this work is on the early phase of the disease when control measures can be most effective. We proposed a modified susceptible-exposed-infected-removed model (SEIR) model based on temporal moving windows to quantify COVID-19 transmission patterns and compare the temporal progress of disease spread in six representative regions worldwide: three Chinese regions (Zhejiang, Guangdong and Xinjiang) vs. three countries (South Korea, Italy and Iran). It was found that in the early phase of COVID-19 spread the disease follows a certain empirical law that is common in all regions considered. Simulations of the imposition of strong social distancing measures were used to evaluate the impact that these measures might have had on the duration and severity of COVID-19 outbreaks in the three countries. Measure-dependent transmission rates followed a modified normal distribution (empirical law) in the three Chinese regions. These rates responded quickly to the launch of the 1st-level Response to Major Public Health Emergency in each region, peaking after 1-2 days, reaching their inflection points after 10-19 days, and dropping to zero after 11-18 days since the 1st-level response was launched. By March 29th, the mortality rates were 0.08% (Zhejiang), 0.54% (Guangdong) and 3.95% (Xinjiang). Subsequent modeling simulations were based on the working assumption that similar infection transmission control measures were taken in South Korea as in Zhejiang on February 25th, in Italy as in Guangdong on February 25th, and in Iran as in Xinjiang on March 8th. The results showed that by June 15th the accumulated infection cases could have been reduced by 32.49% (South Korea), 98.16% (Italy) and 85.73% (Iran). The surface air temperature showed stronger association with transmission rate of COVID-19 than surface relative humidity. On the basis of these findings, disease control measures were shown to be particularly effective in flattening and shrinking the COVID-10 case curve, which could effectively reduce the severity of the disease and mitigate medical burden. The proposed empirical law and the SEIR-temporal moving window model can also be used to study infectious disease outbreaks worldwide.
Keywords: COVID-19; Climatic factors; Distancing measures; Dynamic; SEIR; Transmission rate.
Copyright © 2020 Elsevier B.V. All rights reserved.
Conflict of interest statement
Declaration of competing interest The authors declare that they have no known competing financial interests or personal relationships that could have appeared to influence the work reported in this paper.
Figures
Similar articles
-
Mathematical models for devising the optimal SARS-CoV-2 strategy for eradication in China, South Korea, and Italy.J Transl Med. 2020 Sep 5;18(1):345. doi: 10.1186/s12967-020-02513-7. J Transl Med. 2020. PMID: 32891155 Free PMC article.
-
The prediction for development of COVID-19 in global major epidemic areas through empirical trends in China by utilizing state transition matrix model.BMC Infect Dis. 2020 Sep 29;20(1):710. doi: 10.1186/s12879-020-05417-5. BMC Infect Dis. 2020. PMID: 32993524 Free PMC article.
-
Prediction of COVID-19 spreading profiles in South Korea, Italy and Iran by data-driven coding.PLoS One. 2020 Jul 6;15(7):e0234763. doi: 10.1371/journal.pone.0234763. eCollection 2020. PLoS One. 2020. PMID: 32628673 Free PMC article.
-
The Coronavirus Disease 2019 (COVID-19) Pandemic.Tohoku J Exp Med. 2020 Apr;250(4):271-278. doi: 10.1620/tjem.250.271. Tohoku J Exp Med. 2020. PMID: 32321874 Review.
-
COVID-19 and Italy: what next?Lancet. 2020 Apr 11;395(10231):1225-1228. doi: 10.1016/S0140-6736(20)30627-9. Epub 2020 Mar 13. Lancet. 2020. PMID: 32178769 Free PMC article. Review.
Cited by
-
Willingness of Chinese, Studying in Germany to Fly Back to China Due to Their Risk Perception About COVID-19.Risk Manag Healthc Policy. 2021 May 24;14:2111-2117. doi: 10.2147/RMHP.S308741. eCollection 2021. Risk Manag Healthc Policy. 2021. PMID: 34079398 Free PMC article.
-
Monitoring and Forecasting COVID-19: Heuristic Regression, Susceptible-Infected-Removed Model and, Spatial Stochastic.Front Appl Math Stat. 2021 May 21;7:650716. doi: 10.3389/fams.2021.650716. eCollection 2021. Front Appl Math Stat. 2021. PMID: 34336986 Free PMC article.
-
An AHP-based regional COVID-19 vulnerability model and its application in China.Model Earth Syst Environ. 2022;8(2):2525-2538. doi: 10.1007/s40808-021-01244-y. Epub 2021 Jul 28. Model Earth Syst Environ. 2022. PMID: 34341768 Free PMC article.
-
Parameter estimation of the COVID-19 transmission model using an improved quantum-behaved particle swarm optimization algorithm.Digit Signal Process. 2022 Jul;127:103577. doi: 10.1016/j.dsp.2022.103577. Epub 2022 May 4. Digit Signal Process. 2022. PMID: 35529477 Free PMC article.
-
Mathematical modeling of the impact of Omicron variant on the COVID-19 situation in South Korea.Genomics Inform. 2022 Jun;20(2):e22. doi: 10.5808/gi.22025. Epub 2022 Jun 22. Genomics Inform. 2022. PMID: 35794702 Free PMC article.
References
-
- Anderson R.M., Anderson B., May R.M. Oxford university press; 1992. Infectious Diseases of Humans: Dynamics and Control.
-
- Angulo J.M., Yu H.L., Langousis A., Madrid A.E., Christakos G. Modeling of space–time infectious disease spread under conditions of uncertainty. Int. J. Geogr. Inf. Sci. 2012;26:1751–1772. doi: 10.1080/13658816.2011.648642. - DOI
-
- Banks A., Vincent J., Anyakoha C. A review of particle swarm optimization. Part I: background and development. Nat. Comput. 2007;6:467–484. doi: 10.1007/s11047-007-9049-5. - DOI
MeSH terms
LinkOut - more resources
Full Text Sources
