

Particulate matter (PM10) enhances RNA virus infection through modulation of innate immune responses
- PMID: 32771845
- PMCID: PMC7357538
- DOI: 10.1016/j.envpol.2020.115148
Particulate matter (PM10) enhances RNA virus infection through modulation of innate immune responses
Abstract
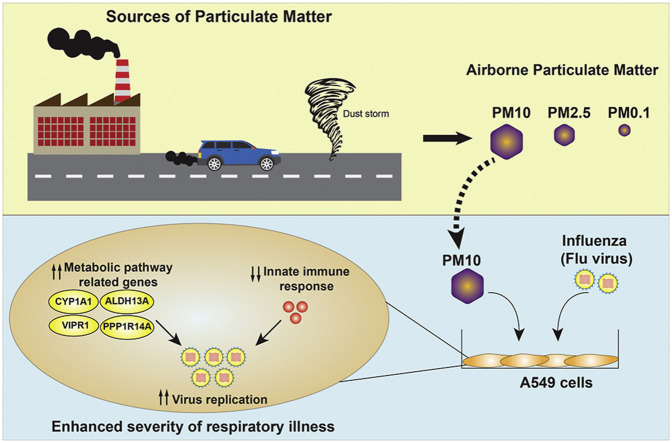
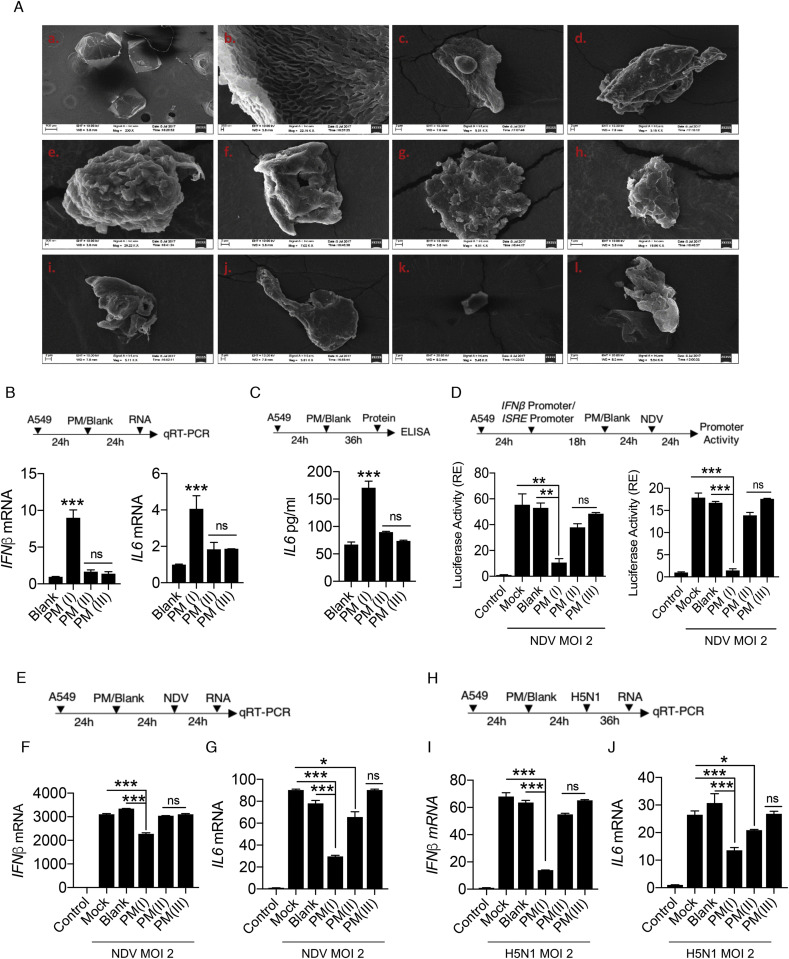
Sensing of pathogens by specialized receptors is the hallmark of the innate immunity. Innate immune response also mounts a defense response against various allergens and pollutants including particulate matter present in the atmosphere. Air pollution has been included as the top threat to global health declared by WHO which aims to cover more than three billion people against health emergencies from 2019 to 2023. Particulate matter (PM), one of the major components of air pollution, is a significant risk factor for many human diseases and its adverse effects include morbidity and premature deaths throughout the world. Several clinical and epidemiological studies have identified a key link between the PM existence and the prevalence of respiratory and inflammatory disorders. However, the underlying molecular mechanism is not well understood. Here, we investigated the influence of air pollutant, PM10 (particles with aerodynamic diameter less than 10 μm) during RNA virus infections using Highly Pathogenic Avian Influenza (HPAI) - H5N1 virus. We thus characterized the transcriptomic profile of lung epithelial cell line, A549 treated with PM10 prior to H5N1infection, which is known to cause severe lung damage and respiratory disease. We found that PM10 enhances vulnerability (by cellular damage) and regulates virus infectivity to enhance overall pathogenic burden in the lung cells. Additionally, the transcriptomic profile highlights the connection of host factors related to various metabolic pathways and immune responses which were dysregulated during virus infection. Collectively, our findings suggest a strong link between the prevalence of respiratory illness and its association with the air quality.
Keywords: Air pollution; Anti-viral innate immunity; Metabolic pathways genes; PM(10); Viral infection.
Copyright © 2020 Elsevier Ltd. All rights reserved.
Conflict of interest statement
Declaration of competing interest The authors declare no conflict of interests.
Figures
Similar articles
-
The London low emission zone baseline study.Res Rep Health Eff Inst. 2011 Nov;(163):3-79. Res Rep Health Eff Inst. 2011. PMID: 22315924
-
Multicity study of air pollution and mortality in Latin America (the ESCALA study).Res Rep Health Eff Inst. 2012 Oct;(171):5-86. Res Rep Health Eff Inst. 2012. PMID: 23311234
-
Air pollution particulate matter alters antimycobacterial respiratory epithelium innate immunity.Infect Immun. 2015 Jun;83(6):2507-17. doi: 10.1128/IAI.03018-14. Epub 2015 Apr 6. Infect Immun. 2015. PMID: 25847963 Free PMC article.
-
Inflammatory effects of particulate matter air pollution.Environ Sci Pollut Res Int. 2020 Dec;27(34):42390-42404. doi: 10.1007/s11356-020-10574-w. Epub 2020 Sep 1. Environ Sci Pollut Res Int. 2020. PMID: 32870429 Review.
-
Particulate matter and ultrafine particles in urban air pollution and their effect on the nervous system.Environ Sci Process Impacts. 2023 Apr 26;25(4):704-726. doi: 10.1039/d2em00276k. Environ Sci Process Impacts. 2023. PMID: 36752881 Review.
Cited by
-
Effects of Scutellaria baicalensis Extract-Induced Exosomes on the Periodontal Stem Cells and Immune Cells under Fine Dust.Nanomaterials (Basel). 2024 Aug 27;14(17):1396. doi: 10.3390/nano14171396. Nanomaterials (Basel). 2024. PMID: 39269058 Free PMC article.
-
Effects of PM2.5 Exposure on the ACE/ACE2 Pathway: Possible Implication in COVID-19 Pandemic.Int J Environ Res Public Health. 2023 Mar 1;20(5):4393. doi: 10.3390/ijerph20054393. Int J Environ Res Public Health. 2023. PMID: 36901403 Free PMC article.
-
Mass spectrometry analysis of PM2.5 in poultry farms and the cytotoxicity and metabolism perturbation of BEAS-2B cells.Anal Bioanal Chem. 2025 Jun;417(15):3371-3382. doi: 10.1007/s00216-025-05871-7. Epub 2025 Apr 23. Anal Bioanal Chem. 2025. PMID: 40266321
-
Severe Acute Respiratory Syndrome and Particulate Matter Exposure: A Systematic Review.Life (Basel). 2023 Feb 15;13(2):538. doi: 10.3390/life13020538. Life (Basel). 2023. PMID: 36836898 Free PMC article. Review.
-
A correlational analysis of COVID-19 incidence and mortality and urban determinants of vitamin D status across the London boroughs.Sci Rep. 2022 Jul 11;12(1):11741. doi: 10.1038/s41598-022-15664-y. Sci Rep. 2022. PMID: 35817805 Free PMC article.
References
-
- Anake W.U., Ana G.R., Benson N.U. Study of surface morphology, elemental composition and sources of airborne fine particulate matter in Agbara industrial estate, Nigeria. Int. J. Appl. Environ. Sci. 2016;11:881–890.
-
- Andrews S., Krueger F., Segonds-Pichon A., Biggins L., Krueger C., Wingett S., Montgomery J. FastQ: a Quality Control Tool for High Throughput Sequence Data. Babraham Bioinformatics: A bioinformatic Tool. 2010 https://www.bioinformatics.babraham.ac.uk/projects/fastqc/
-
- Arai T. Ministry of Heavy Industries and Public Enterprises; New Delhi: 2018. Source Apportionment of PM2.5 & PM10 of Delhi NCR for Identification of Major Sources Department of Heavy Industry.
MeSH terms
Substances
LinkOut - more resources
Full Text Sources
Medical
Molecular Biology Databases
