Network structures and temporal stability of self- and informant-rated affective symptoms in Alzheimer's disease
- PMID: 32771860
- PMCID: PMC7484410
- DOI: 10.1016/j.jad.2020.07.100
Network structures and temporal stability of self- and informant-rated affective symptoms in Alzheimer's disease
Abstract
Background: Affective symptoms in Alzheimer's disease (AD) can be rated with both informant- and self-ratings. Information from these two modalities may not converge. We estimated network structures of affective symptoms in AD with both rating modalities and assessed the longitudinal stability of the networks.
Methods: Network analyses combining self-rated and informant-rated affective symptoms were conducted in 3198 individuals with AD at two time points (mean follow-up 387 days), drawn from the NACC database. Self-rated symptoms were assessed by Geriatric Depression Scale, and informant-rated symptoms included depression, apathy and anxiety questions from Neuropsychiatric Inventory Questionnaire.
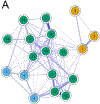
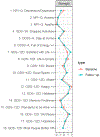
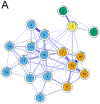
Results: Informant-rated symptoms were mainly connected to symptoms expressing lack of positive affect, but not to the more central symptoms of self-rated worthlessness and helplessness. Networks did not differ in structure (p = .71), or connectivity (p = .92) between visits. Symptoms formed four clinically meaningful clusters of depressive symptoms and decline, lack of positive affect, informant-rated apathy and anxiety and informant-rated depression.
Limitations: The symptom dynamics in our study could have been present before AD diagnosis. The lack of positive affect cluster may represent a methodological artefact rather than a theoretically meaningful subgroup. Requiring follow-up lead to a selection of patients with less cognitive decline.
Conclusions: Informant rating may only capture the more visible affective symptoms, such as not being in good spirits, instead of more central and severe symptoms, such as hopelessness and worthlessness. Future research should continue to be mindful of differences between self- and informant-rated symptoms even in earlier stages of AD.
Keywords: Alzheimer's disease; Anxiety; Apathy; Depression; Network analysis; Neuropsychiatric symptoms.
Copyright © 2020. Published by Elsevier B.V.
Figures


References
-
- Beck AT, Brown G, Berchick RJ, Stewart BL, & Steer RA (1990). Relationship Between Hopelessness and Ultimate Suicide: A Replication with Psychiatric Outpatients. The American Journal of Psychiatry, 147(2), 190–195. - PubMed
-
- Besser L, Kukull W, Knopman DS, Chui H, Galasko D, Weintraub S, Jicha G, Carlsson C, Burns J, Quinn J, Sweet RA, Rascovsky K, Teylan M, Beekly D, Thomas G, Bollenbeck M, Monsell S, Mock C, Zhou XH, … Morris JC (2018). Version 3 of the National Alzheimer’s Coordinating Center’s Uniform Data Set. Alzheimer Disease & Associated Disorders, 1–8. 10.1097/WAD.0000000000000279 - DOI - PMC - PubMed
Publication types
MeSH terms
Grants and funding
- P50 AG005142/AG/NIA NIH HHS/United States
- P30 AG066515/AG/NIA NIH HHS/United States
- P30 AG066519/AG/NIA NIH HHS/United States
- P50 AG016573/AG/NIA NIH HHS/United States
- P50 AG047266/AG/NIA NIH HHS/United States
- P30 AG010161/AG/NIA NIH HHS/United States
- P50 AG025688/AG/NIA NIH HHS/United States
- P50 AG005138/AG/NIA NIH HHS/United States
- P50 AG047366/AG/NIA NIH HHS/United States
- P30 AG019610/AG/NIA NIH HHS/United States
- P50 AG033514/AG/NIA NIH HHS/United States
- P30 AG013854/AG/NIA NIH HHS/United States
- P30 AG053760/AG/NIA NIH HHS/United States
- P30 AG066444/AG/NIA NIH HHS/United States
- P30 AG010124/AG/NIA NIH HHS/United States
- P50 AG023501/AG/NIA NIH HHS/United States
- P50 AG005131/AG/NIA NIH HHS/United States
- P30 AG010133/AG/NIA NIH HHS/United States
- P50 AG016574/AG/NIA NIH HHS/United States
- P30 AG066511/AG/NIA NIH HHS/United States
- P50 AG005146/AG/NIA NIH HHS/United States
- U24 AG072122/AG/NIA NIH HHS/United States
- P30 AG035982/AG/NIA NIH HHS/United States
- P50 AG008702/AG/NIA NIH HHS/United States
- U01 AG016976/AG/NIA NIH HHS/United States
- P30 AG008051/AG/NIA NIH HHS/United States
- P50 AG005681/AG/NIA NIH HHS/United States
- P30 AG013846/AG/NIA NIH HHS/United States
- P50 AG047270/AG/NIA NIH HHS/United States
- P30 AG062429/AG/NIA NIH HHS/United States
- P50 AG005136/AG/NIA NIH HHS/United States
- P30 AG072973/AG/NIA NIH HHS/United States
- P30 AG049638/AG/NIA NIH HHS/United States
- P30 AG012300/AG/NIA NIH HHS/United States
- P50 AG005134/AG/NIA NIH HHS/United States
- P30 AG008017/AG/NIA NIH HHS/United States
- P50 AG005133/AG/NIA NIH HHS/United States
- P30 AG066509/AG/NIA NIH HHS/United States
- P30 AG066506/AG/NIA NIH HHS/United States
- P30 AG066468/AG/NIA NIH HHS/United States
- P30 AG010129/AG/NIA NIH HHS/United States
- P30 AG066514/AG/NIA NIH HHS/United States
- P30 AG028383/AG/NIA NIH HHS/United States
LinkOut - more resources
Full Text Sources
Medical

