

Serological detection of 2019-nCoV respond to the epidemic: A useful complement to nucleic acid testing
- PMID: 32771946
- PMCID: PMC7391978
- DOI: 10.1016/j.intimp.2020.106861
Serological detection of 2019-nCoV respond to the epidemic: A useful complement to nucleic acid testing
Abstract
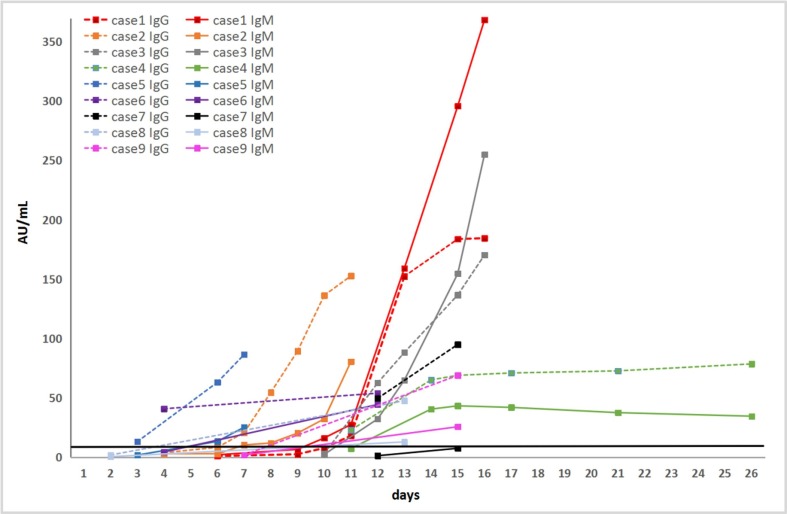
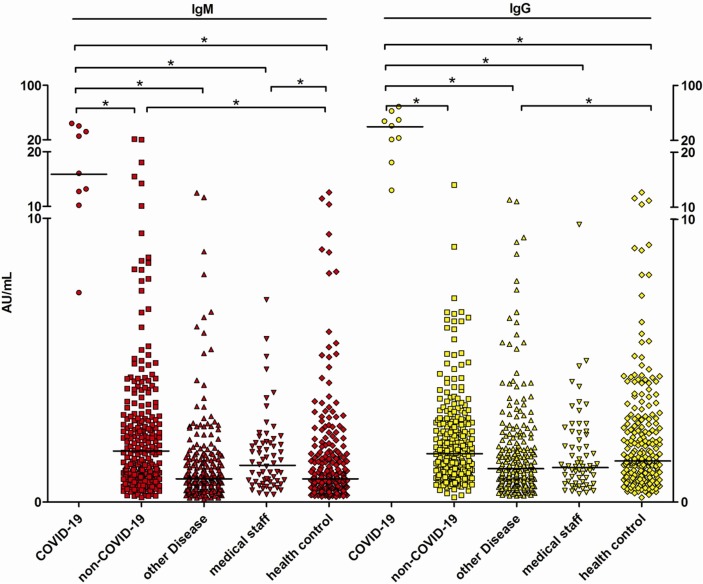
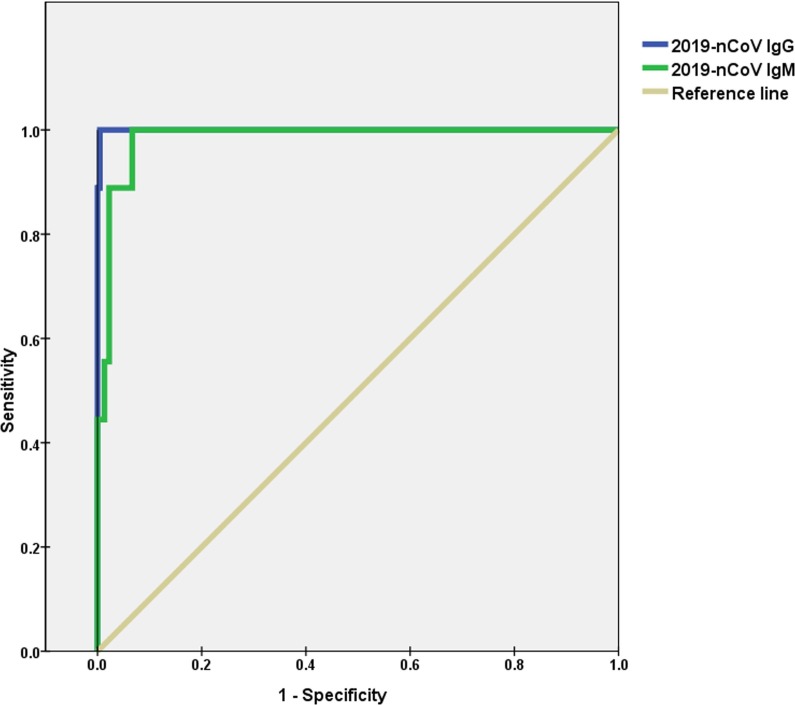
Corona Virus Disease 2019 (COVID-19) has spread rapidly to more than 215 countries, with over 11.91 million reported cases and more than 540,000 deaths. Rapid diagnosis remains a bottleneck for containing the epidemic. We used an automated chemiluminescent immunoassay to detect serum IgM and IgG antibodies to the 2019-nCoV in 742 subjects, so as to observe the dynamic process of antibody production in COVID-19 disease and seroepidemiology in different populations. Patients with COVID-19 were reactive (positive) for specific antibodies within 3-15 days after onset of symptoms. Specific IgM and IgG levels increased with the progression of the disease. The areas under the receiver operating characteristic curves for IgM and IgG were 0.984 and 1.000, respectively. This antibody detection assay had good sensitivity and specificity. The understanding of the dynamic serological changes of COVID-19 patients and the seroepidemiological situation of the population will be helpful to further control the epidemic of COVID-19.
Keywords: Antibody; Coronavirus; Nucleic acid; Serology.
Copyright © 2020 Elsevier B.V. All rights reserved.
Conflict of interest statement
Declaration of Competing Interest The authors declare that they have no known competing financial interests or personal relationships that could have appeared to influence the work reported in this paper.
Figures
References
-
- Ksiazek T.G., Erdman D., Goldsmith C.S. A novel coronavirus associated with severe acute respiratory syndrome. N. Engl. J. Med. 2003;348:1953–1966. - PubMed
-
- Rota P.A., Oberste M.S., Monroe S.S. Characterization of a novel coronavirus associated with severe acute respiratory syndrome. Science. 2003;300:1394–1399. - PubMed
-
- Zaki A.M., van Boheemen S., Bestebroer T.M. Isolation of a novel coronavirus from a man with pneumonia in Saudi Arabia. N. Engl. J. Med. 2012;367:1814–1820. - PubMed
-
- China National Health Commission. Novel coronavirus pneumonia Diagnosis and Treatment Program (Trial Third Edition). http://www.nhc.gov.cn/yzygj/s7653p/202001/f492c9153ea9437bb587ce2ffcbee1....
MeSH terms
Substances
LinkOut - more resources
Full Text Sources
Other Literature Sources
Medical
