. 2020 Oct;140(4):513-534.
doi: 10.1007/s00401-020-02193-z. Epub 2020 Aug 9.

TREM2 activation on microglia promotes myelin debris clearance and remyelination in a model of multiple sclerosis

Affiliations

TREM2 activation on microglia promotes myelin debris clearance and remyelination in a model of multiple sclerosis

Francesca Cignarella et al. Acta Neuropathol. 2020 Oct.

Abstract

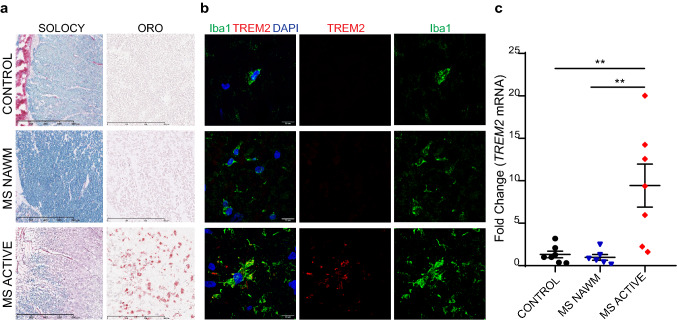
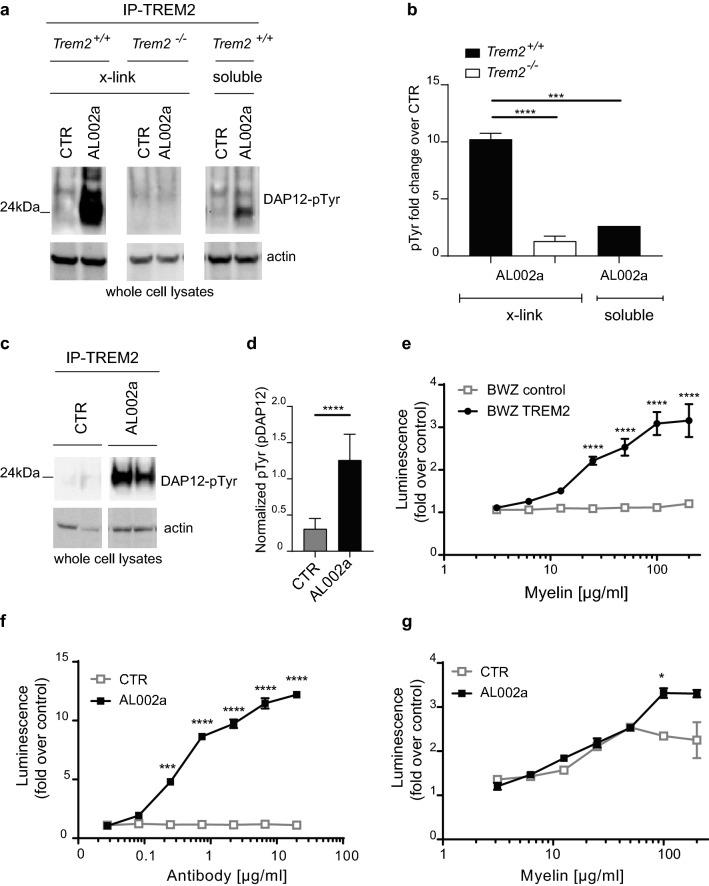
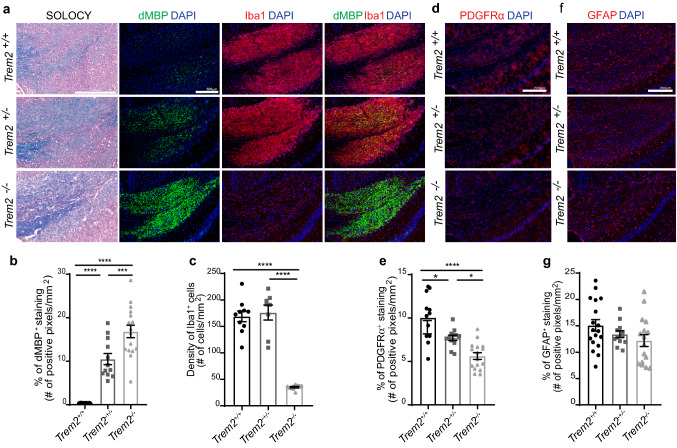
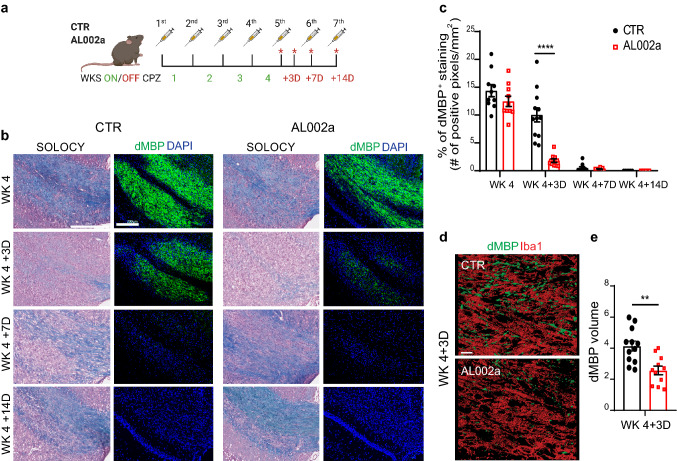
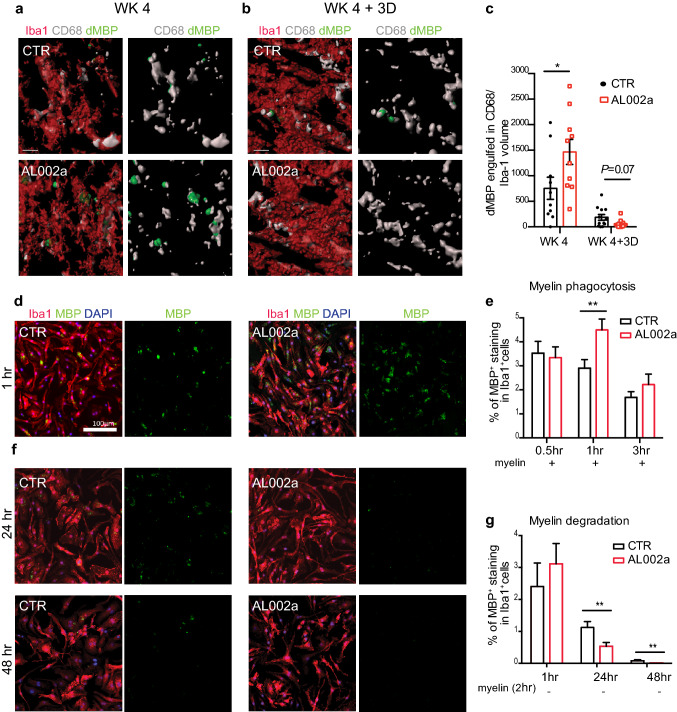
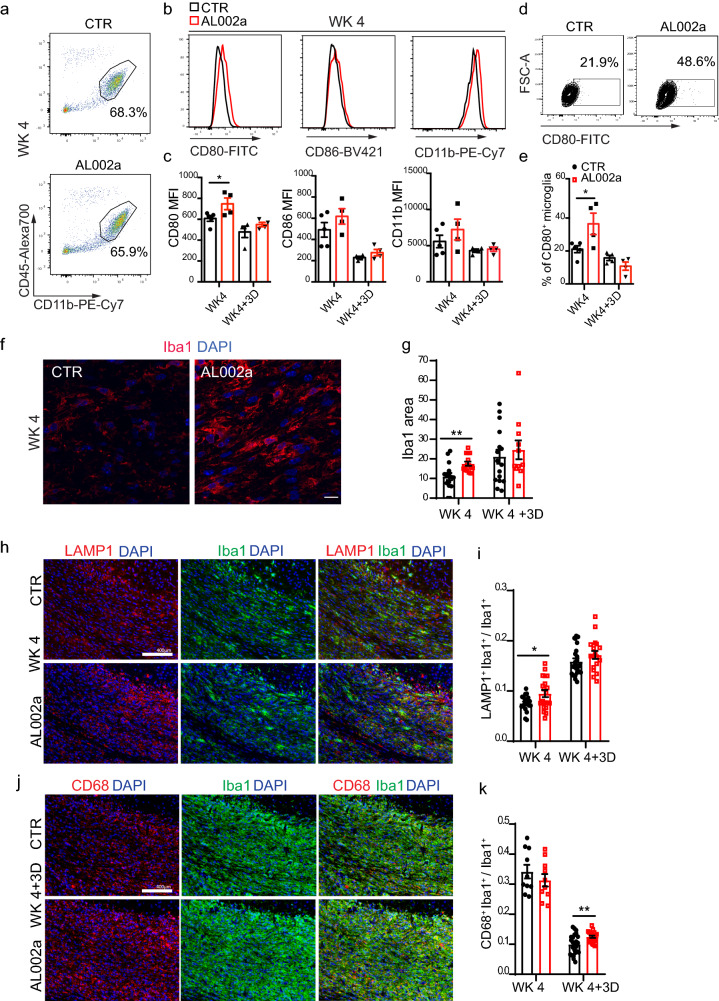
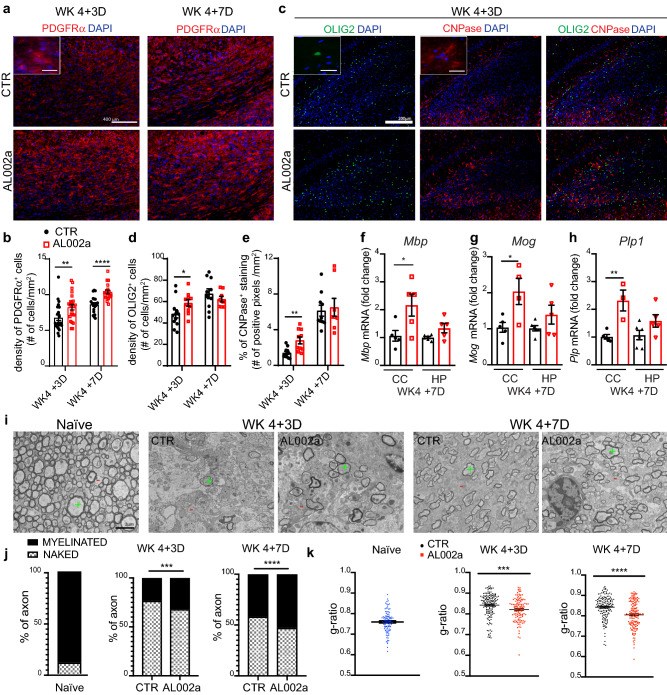
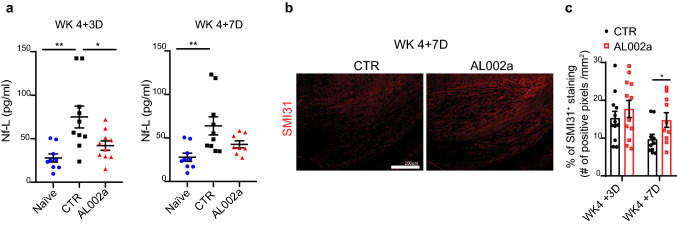
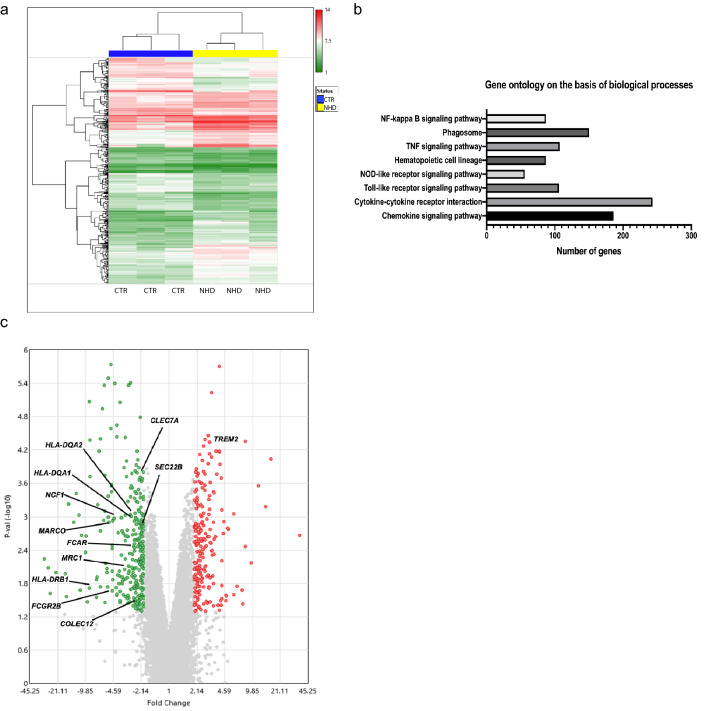
Multiple sclerosis (MS) is an inflammatory, demyelinating, and neurodegenerative disease of the central nervous system (CNS) triggered by autoimmune mechanisms. Microglia are critical for the clearance of myelin debris in areas of demyelination, a key step to allow remyelination. TREM2 is expressed by microglia and promotes microglial survival, proliferation, and phagocytic activity. Herein we demonstrate that TREM2 was highly expressed on myelin-laden phagocytes in active demyelinating lesions in the CNS of subjects with MS. In gene expression studies, macrophages from subjects with TREM2 genetic deficiency displayed a defect in phagocytic pathways. Treatment with a new TREM2 agonistic antibody promoted the clearance of myelin debris in the cuprizone model of CNS demyelination. Effects included enhancement of myelin uptake and degradation, resulting in accelerated myelin debris removal by microglia. Most importantly, antibody-dependent TREM2 activation on microglia increased density of oligodendrocyte precursors in areas of demyelination, as well as the formation of mature oligodendrocytes thus enhancing remyelination and axonal integrity. These results are relevant as they propose TREM2 on microglia as a potential new target to promote remyelination.


Conflict of interest statement

IT., T.S., F.C., A.R. and A.I. are Alector employees. L.P. receives research support from Alector. D.M.H. is listed as an inventor on a provisional patent from Washington University on TREM2 antibodies. D.M.H. co-founded and is on the scientific advisory board of C2N Diagnostics. Washington University receives research support from C2N Diagnostics on the use of TREM2 antibodies.

Figures

Fig. 1
Fig. 1
TREM2 is highly expressed in active MS lesions. a Top to bottom: white matter with no pathology in control non-MS individuals (CONTROL), normal appearing white matter of MS subjects (MS NAWM) and MS active lesions in the white matter (MS ACTIVE) are stained with solochrome cyanine staining (SOLOCY) and with Oil Red O staining (ORO). Original magnification SOLOCY: × 10; scale bar: 800 µm; ORO: × 20; scale bar: 300 µm. b Representative confocal images of Iba1 (green), TREM2 (red), and DAPI (blue) in CONTROL, MS NAWM, and MS ACTIVE lesions. Original magnification, × 63. Scale bar, 10 µm. c Relative TREM2 mRNA expression by qPCR of the previously described tissue types. 7 samples from 4 CONTROLS, 6 NAWM samples from 3 MS patients, and 7 ACTIVE lesion samples from 5 MS patients. **P < 0.01, One-way ANOVA with Tukey’s post hoc test
Fig. 2
Fig. 2
In vitro and in vivo effects of a TREM2-specific antibody on TREM2 signaling. a WB analysis of Trem2+/+ or Trem2/ BMDM stimulated with a TREM2-specific antibody (AL002a) or with a control antibody, by cross-linking with a secondary antibody (x-link) or in solution (soluble; for Trem2+/+ only). Cells were immunoprecipitated with a rat anti-h/m-TREM2 antibody and fractionated by SDS-PAGE in non-reducing conditions. Phopho DAP12 (pTyr) is shown here as a dimer. b Quantification of DAP12-pTyr normalized on actin is shown as fold change over control. ***P < 0.001, ****P < 0.0001, One-way ANOVA with Tukey’s post hoc test. c Peritoneal cells isolated from Trem2+/+ mice after thyoglicollate treatment, immunoprecipitated with an anti-TREM2 antibody (clone 237920), and analyzed by WB. d Quantification of DAP12- pTyr normalized on actin. ****P < 0.0001, two-tailed unpaired Student’s t test. e Activation of TREM2 signaling in the BWZ reporter cell assay with different concentrations of plate-bound myelin. BWZ cells express either NFAT:luciferase alone (BWZ control) or in combination with mouse TREM2 and DAP12 (BWZ TREM2). ****P < 0.0001, Two-way ANOVA with Sidak’s post hoc test. f TREM2 signaling in the BWZ Trem2 reporter cell assay at different concentrations of AL002a antibody. ***P < 0.001, ****P < 0.0001, Two-way ANOVA with Dunnett’s post hoc test. g Myelin-induced signaling by AL002a (10 µg/ml) in the BWZ Trem2 reporter cell assay at different concentrations of plate-bound myelin. *P < 0.05, Two-way ANOVA with Dunnett’s post hoc test. CTR control
Fig. 3
Fig. 3
Trem2+/- mice show defective myelin debris clearence after CPZ-induced demyelination. a Representative images of the corpus callosum (CC) of Trem2+/+, Trem2+/ and Trem2/ mice fed with cuprizone (CPZ) for 4 weeks and then analyzed. Myelin was studied histologically by solochrome cyanine (SOLOCY) staining (intact myelin is stained in dark blue). Scale bar, 300 µm. dMBP (green) was used to assess myelin debris; microglia were analyzed as density of Iba1+ cells (red); DAPI (blue). Original magnification, × 10. Scale bar, 200 µm. Quantification of b dMBP fluorescent staining and c microglia density in the CC after 4 weeks on CPZ. dMBP quantification: Trem2+/+ N = 8 mice, n = 16 fields; Trem2+/ N = 6, n = 12; Trem2/ N = 8, n = 16. Iba1 quantification: Trem2+/+ N = 5, n = 10; Trem2+/ N = 4, n = 8; Trem2/ N = 5, n = 10. ***P < 0.001, ****P < 0.0001, One-way ANOVA with Tukey’s post hoc test. Representative images of PDGFRα (red) (d) and GFAP (red) (f) in the CC of Trem2+/+, Trem2+/ and Trem2/ mice after 4 weeks on CPZ. Original magnification, × 10. Scale bar, 200 µm. Quantification of e PDGFRα and g GFAP fluorescent staining in the CC after 4 weeks on CPZ. PDGFRα quantification: Trem2+/+ N = 6, n = 12; Trem2+/ N = 6, n = 12; Trem2/ N = 8, n = 16. GFAP quantification: Trem2+/+ N = 9, n = 18; Trem2+/ N = 6, n = 12; Trem2/ N = 8, n = 16. *P < 0.05, ****P < 0.0001, One-way ANOVA with Tukey’s post hoc test
Fig. 4
Fig. 4
Treatment with the AL002a antibody during CPZ-induced CNS demyelination in Trem2+/ mice promotes myelin debris clearance in the corpus callosum. a Timeline of antibody treatment during cuprizone experiment. Weeks on CPZ = WKS ON (green numbers); days after CPZ withdrawal = OFF (red numbers). Mice were sacrificed after 4 weeks on CPZ (WK 4), 4 weeks on CPZ followed by 3 days (+ 3D), 7 days (+ 7D) or 14 days (+ 14D) of recovery (red asterisks correspond to the time points in which the tissues were collected). b Representative images of solochrome cyanine (SOLOCY) staining and of dMBP (green) and DAPI (blue) immunostaining in the CC of Trem2+/ mice at the different time points. Original magnification, × 10. Scale bar, SOLOCY, 300 µm; dMBP, 200 µm. c Quantification of dMBP debris at the different time points. CTR group: WK 4 N = 5 mice, n = 10 fields; WK 4 + 3D N = 6, n = 12; WK 4 + 7D N = 5, n = 10; WK 4 + 14D N = 5, n = 5; AL002a-treated group: WK 4 N = 5, n = 10; WK 4 + 3D N = 5, n = 10; WK 4 + 7D N = 4, n = 8; WK 4 + 14D N = 6, n = 6. ****P < 0.0001, two-tailed unpaired Student’s t test. d 3D reconstruction by Imaris of Iba1+ cells (red) and dMBP (green) immunostaining in the CC at WK 4 + 3D. Original magnification, × 63. Scale bar, 10 µm. e Quantification of dMBP total volume per field in mice treated with AL002a or CTR. CTR group: N = 6, n = 12; AL002a treated group: N = 6, n = 11. **P < 0.01, two-tailed unpaired Student’s t test
Fig. 5
Fig. 5
AL002a treatment enhances myelin uptake and processing by Trem2+/ microglia in vivo and by BMDM in vitro. Representative confocal z-stack and relative 3D surface rendering showing volume reconstruction of microglia (red), CD68 (gray) and dMBP (green), detected within microglial CD68+ structures at WK 4 (a) and WK 4 + 3D (b) in the CC of Trem2+/ mice. Original magnification, × 63. Scale bar, 3 µm. c Quantification of engulfed dMBP within CD68 per microglia at WK 4 and WK 4 + 3D. CTR group: WK 4 N = 5 mice, n = 10 fields; WK 4 + 3D N = 6, n = 12. AL002a-treated group: WK 4 N = 5, n = 10; WK 4 + 3D N = 6, n = 11; *P < 0.05, two-tailed unpaired Student’s t test. d Representative images and e relative quantification of Trem2+/ BMDM pre-stimulated in vitro with AL002a and control antibodies (10 µg/ml) and treated with myelin for 0.5, 1 and 3 h. Iba1 (red), MBP (green), DAPI (blue). Original magnification, × 10. Scale bar, 100 µm. CTR group: 30’ n = 80; 1 h n = 100; 3 h n = 80; AL002a group: 30’ n = 80; 1 h n = 100; 3 h n = 80. **P < 0.01, two-tailed unpaired Student’s t test. f Representative images and g relative quantification of Trem2+/ BMDM assayed for their degradative capacity. Trem2+/ BMDM were pre-stimulated with AL002a or control antibodies (10 µg/ml), then incubated with human myelin for 2 h and washed. MBP content in Iba1+ cells was quantified after 1, 24, and 48 h. CTR group: 1 h n = 42; 24 h n = 104; 48 h n = 80; AL002a group: 1 h n = 48; 24 h n = 110; 48 h n = 80. **P < 0.01, two-tailed unpaired Student’s t test. dg Three independent experiments were performed
Fig. 6
Fig. 6
Increased Trem2+/ microglia activation following AL002a antibody treatment in vivo. a FACS analysis of Trem2+/ microglia isolated from the CC at WK 4. Microglia were identified as CD11b+CD45int cells upon doublet discrimination and death cell exclusion. Values indicated in FACS plots represent the relative frequency of live cells after duplets exclusion. b Histograms showing the mean fluorescence intensities (MFIs) of surface CD80, CD86, and CD11b at WK 4 and c their relative quantification at WK 4 and WK 4 + 3D. d Example plots of flow cytometric analysis of CD80 positive microglia at WK 4 and e quantification of the microglia percentage expressing CD80 molecule at WK 4 and WK 4 + 3D. CTR group N = 5 and AL002a treated group N = 4; *P < 0.05, two-tailed unpaired Student’s t test. f Representative confocal images of Iba1 (red) and DAPI (blue) in the CC at WK 4. Original magnification, × 63. Scale bar, 10 µm. g Quantification of Iba1 intensity (measured as area) at WK 4 and WK 4 + 3D. CTR group: WK 4 N = 5 mice, n = 15 fields; WK 4 + 3D N = 6, n = 16; AL002a-treated group: WK 4 N = 5, n = 15; WK 4 + 3D N = 6, n = 11; **P < 0.01 two-tailed unpaired Student’s t test. h Representative images of LAMP1 (red), Iba1(green) and DAPI (blue) at WK 4. Original magnification, × 20. Scale bar, 400 µm. i Quantification of LAMP1+ signal colocalizing with Iba1+ cells. CTR group: WK 4 N = 5, n = 20; WK 4 + 3D N = 6, n = 23; AL002a treated group: WK 4 N = 5, n = 20; WK 4 + 3D N = 5, n = 18; *P < 0.05, two-tailed unpaired Student’s t test. j Representative images of CD68 (red), Iba1 (green) and DAPI (blue) at WK 4. Original magnification, × 20. Scale bar, 400 µm. k Quantification of CD68+ signal colocalizing with Iba1+ cells. CTR group: WK 4 N = 5, n = 10; WK 4 + 3D N = 6, n = 24; AL002a-treated group: WK 4 N = 5, n = 10; WK 4 + 3D N = 5, n = 20; **P < 0.01 two-tailed unpaired Student’s t test
Fig. 7
Fig. 7
AL002a -treated mice show increased OPC density, mature myelin and remyelination after CPZ-induced demyelination. a Representative images of PDGFRα+ (red) and DAPI (blue) in the CC at WK 4 + 3D and WK 4 + 7D. Original magnification, × 20. Scale bar, 400 µm. Insert magnification, × 60. Scale bar, 25 µm. b Quantification of PDGFRα+ cell density. CTR group: WK 4 + 3D N = 6 mice, n = 24 fields; WK 4 + 7D N = 5, n = 20; AL002a-treated group: WK 4 + 3D N = 6, n = 24; WK 4 + 7D N = 5, n = 20; **P ≤ 0.01; ****P ≤ 0.0001; WK 4 + 3D two-tailed Mann–Whitney test; WK 4 + 7D two-tailed unpaired Student’s t test. c Representative images of OLIG2 (green), CNPase (red) and DAPI (blue) in the CC at WK 4 + 3Ds and WK 4 + 7D. Original magnification, × 10. Scale bar, 200 µm. Insert magnification, × 60. Scale bar, 25 µm. d Quantification of the density of OLIG2+ cells at both the time points. e Quantification of the percentage of CNPase+ staining in the CC. CTR group: WK 4 + 3D N = 6, n = 12; WK 4 + 7D N = 5, n = 10; AL002a-treated group: WK 4 + 3D N = 5, n = 10; WK 4 + 7D N = 4, n = 8; *P < 0.05, **P ≤ 0.01; two-tailed unpaired Student’s t test. RT-qPCR quantification of mRNA levels of myelin basic protein (Mbp) (f), myelin oligodendrocyte glycoprotein (Mog) (g) and proteolipid protein 1 (Plp1) (h) in the corpus callosum (CC) and the hippocampus (HP) of Trem2+/ mice treated with AL002a antibody or CTR. Tissues were collected at WK 4 + 7D. CTR group: N = 5, AL002a-treated group: N = 5 (Mpb); N = 4 (Mog); N = 3 (Plp1). *P < 0.05, two-tailed unpaired Student’s t test. i Electron microscopy (EM) of a naïve mouse and mice treated with AL002a or isotype control antibody at WK 4 + 3D and WK 4 + 7D. Green plus sign indicates myelinated axons and red minus sign indicates naked axons. Original image = × 5000. Scale bar = 2 µm. j Percentage of myelinated axons (MA) and naked axons (NA) in naïve mice, and in CTR and AL200a-treated mice at WK 4 +3D and WK 4 + 7D. ***P < 0.001 at WK 4 + 3D and ****P < 0.0001 at WK 4 + 7D, two-tailed Mann–Whitney test. k G-ratio of myelinated fibers in naïve mice, and in CTR and AL002a-treated mice at WK 4 + 3D and WK 4 + 7D. Each dot represents one axon. Naïve mice N = 2, CTR treated mice at WK 4 + 3D N = 5 and at WK 4 + 7D N = 5; AL002a-treated mice at WK 4 + 3D N = 4 and at WK 4 + 7D N = 5. ***P < 0.001 at WK 4 + 3D and ****P < 0.0001 at WK 4 + 7D, two-tailed unpaired Student’s t test
Fig. 8
Fig. 8
AL002a positively impacts axonal health after CPZ-induced demyelination. a Neurofilament light chain (Nf-L) levels were measured in plasma samples collected from Trem2+/ naïve mice and Trem2+/ mice treated with AL002a antibody or CTR at WK 4 +3D and WK 4 + 7D after CPZ-induced CNS demyelination. Naïve mice, N = 9; CTR group: WK 4 + 3D N = 10; WK 4 + 7D N = 10; AL002a-treated group: WK 4 + 3D N = 10; WK 4 + 7D N = 8. *P < 0.05, **P ≤ 0.01; one-way ANOVA with Tukey’s post hoc test. b Representative images and c quantification of SMI31 (red) fluorescent staining at WK 4 + 3D and WK 4 + 7D in the CC. CTR group: WK 4 + 3D N = 6 mice, n = 12 fields; 4 + 7D N = 5, n = 10; AL002a-treated group: WK 4 + 3D N = 6, n = 12; WK 4 + 7D N = 5, n = 10 fields; *P < 0.05; two-tailed unpaired Student’s t test
Fig. 9
Fig. 9
Phagocytic pathways dysregulation in macrophages derived from individuals affected by Nasu–Hakola disease. a Heat map showing different expression patterns of genes in Nasu–Hakola (NHD) patients and healthy controls (CTR). The heat map indicates up-regulation (red) and down-regulation (green). b Gene ontology analysis of the differentially expressed genes in NHD patients. c Volcano plots showing the distribution of gene expression fold changes in genes of the phagosome pathway. Genes with fold change > 2 and P value < 0.05 are indicated in red, and genes with fold change < − 2 and P value < 0.05 are indicated in green

Comment in

References

    1. Atagi Y, Liu CC, Painter MM, Chen XF, Verbeeck C, Zheng H, et al. Apolipoprotein E is a ligand for triggering receptor expressed on myeloid cells 2 (TREM2) J Biol Chem. 2015;290:26043–26050. doi: 10.1074/jbc.M115.679043. - DOI - PMC - PubMed
    1. Bailey CC, DeVaux LB, Farzan M. The triggering receptor expressed on myeloid cells 2 binds apolipoprotein E. J Biol Chem. 2015;290:26033–26042. doi: 10.1074/jbc.M115.677286. - DOI - PMC - PubMed
    1. Bennett ML, Bennett FC, Liddelow SA, Ajami B, Zamanian JL, Fernhoff NB, et al. New tools for studying microglia in the mouse and human CNS. Proc Natl Acad Sci USA. 2016;113:E1738–E1746. doi: 10.1073/pnas.1525528113. - DOI - PMC - PubMed
    1. Bock V, Botturi A, Gaviani P, Lamperti E, Maccagnano C, Piccio L, et al. Polycystic lipomembranous osteodysplasia with sclerosing leukoencephalopathy (PLOSL): a new report of an Italian woman and review of the literature. J Neurol Sci. 2013;326:115–119. doi: 10.1016/j.jns.2013.01.021. - DOI - PubMed
    1. Boven LA, Van Meurs M, Van Zwam M, Wierenga-Wolf A, Hintzen RQ, Boot RG, et al. Myelin-laden macrophages are anti-inflammatory, consistent with foam cells in multiple sclerosis. Brain. 2006;129:517–526. doi: 10.1093/brain/awh707. - DOI - PubMed

Publication types