

Testosterone treatment is associated with reduced adipose tissue dysfunction and nonalcoholic fatty liver disease in obese hypogonadal men
- PMID: 32772323
- PMCID: PMC7946690
- DOI: 10.1007/s40618-020-01381-8
Testosterone treatment is associated with reduced adipose tissue dysfunction and nonalcoholic fatty liver disease in obese hypogonadal men
Abstract
Purpose: In both preclinical and clinical settings, testosterone treatment (TTh) of hypogonadism has shown beneficial effects on insulin sensitivity and visceral and liver fat accumulation. This prospective, observational study was aimed at assessing the change in markers of fat and liver functioning in obese men scheduled for bariatric surgery.
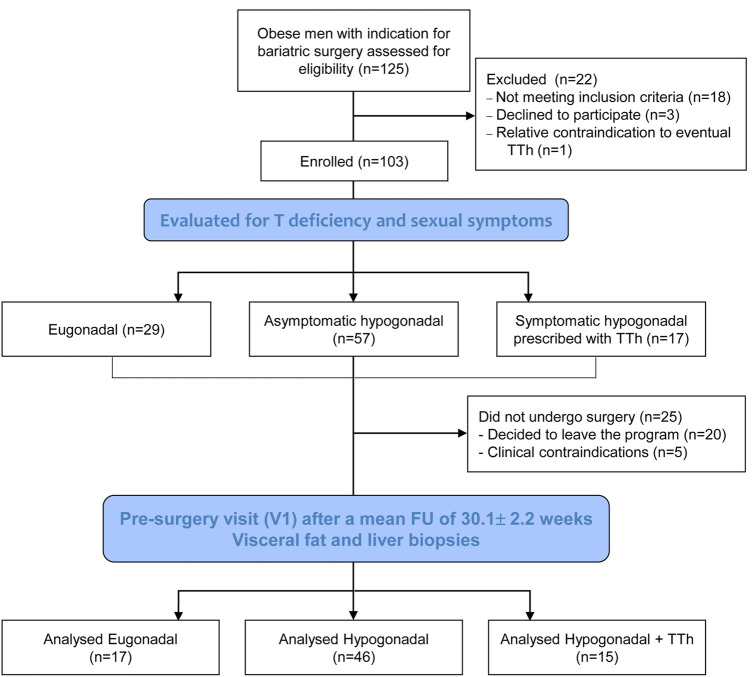
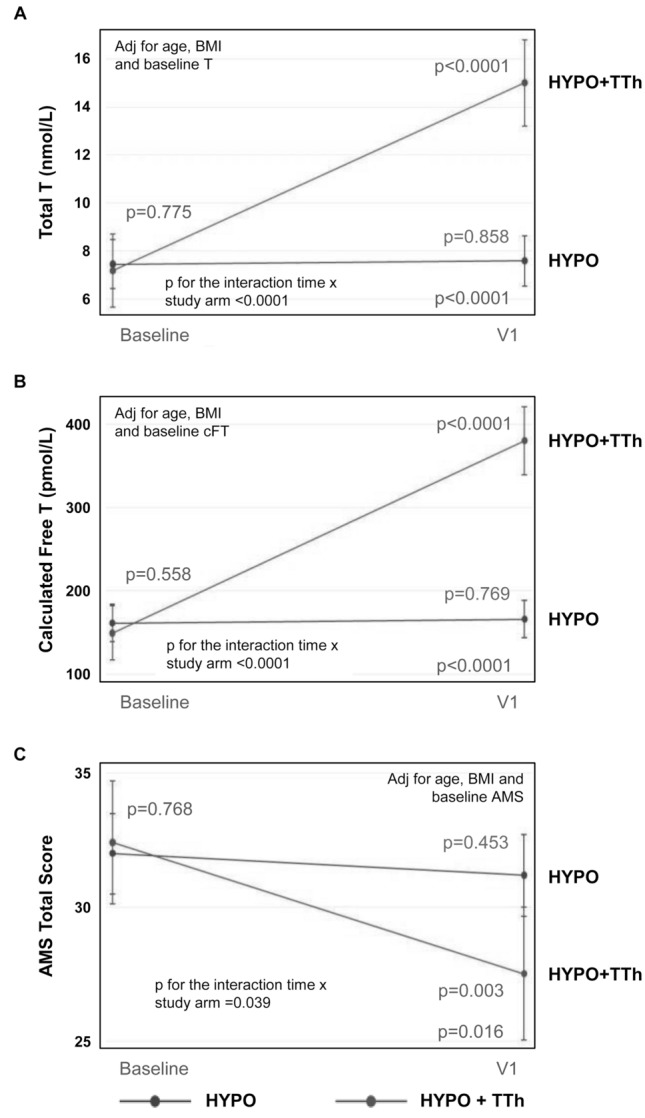
Methods: Hypogonadal patients with consistent symptoms (n = 15) undergoing 27.63 ± 3.64 weeks of TTh were compared to untreated eugonadal (n = 17) or asymptomatic hypogonadal (n = 46) men. A cross-sectional analysis among the different groups was also performed, especially for data derived from liver and fat biopsies. Preadipocytes isolated from adipose tissue biopsies were used to evaluate insulin sensitivity, adipogenic potential and mitochondrial function. NAFLD was evaluated by triglyceride assay and by calculating NAFLD activity score in liver biopsies.
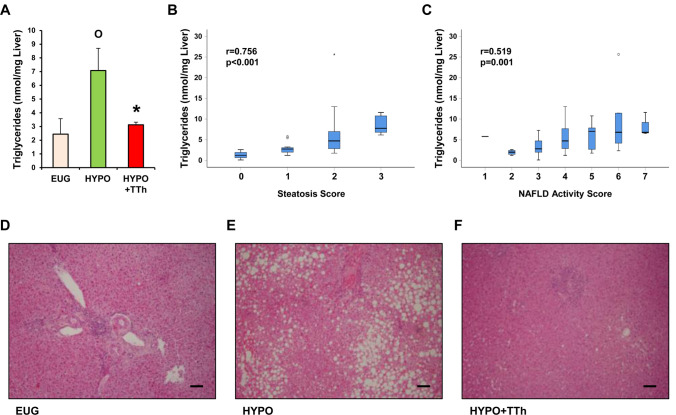
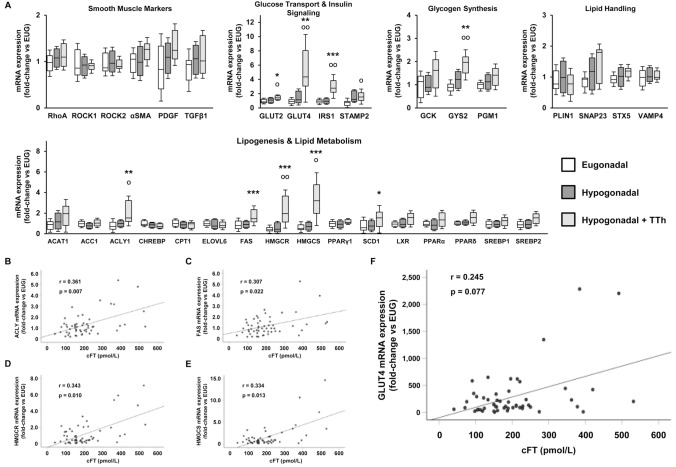
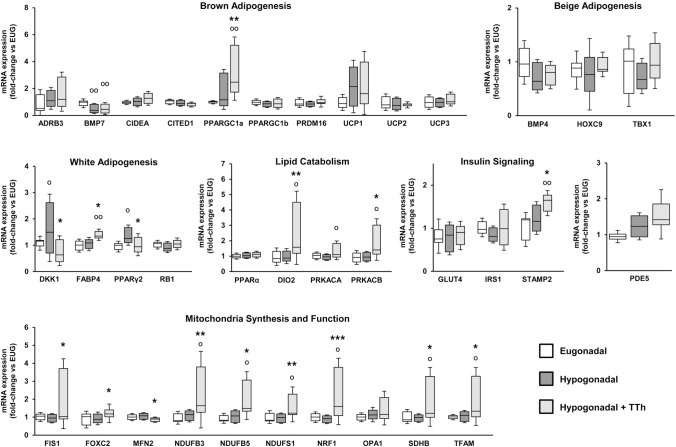
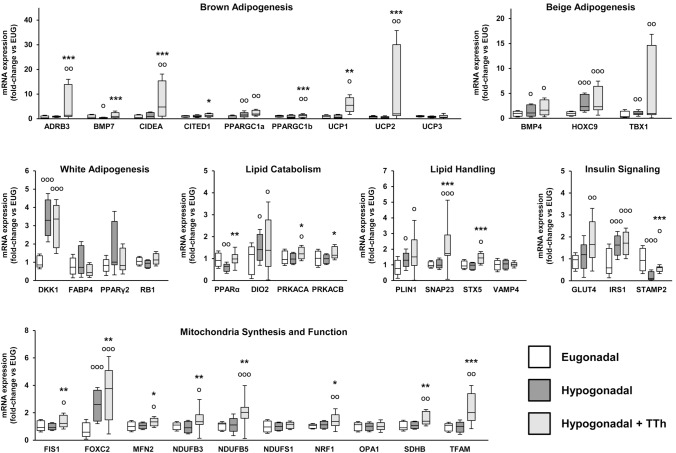
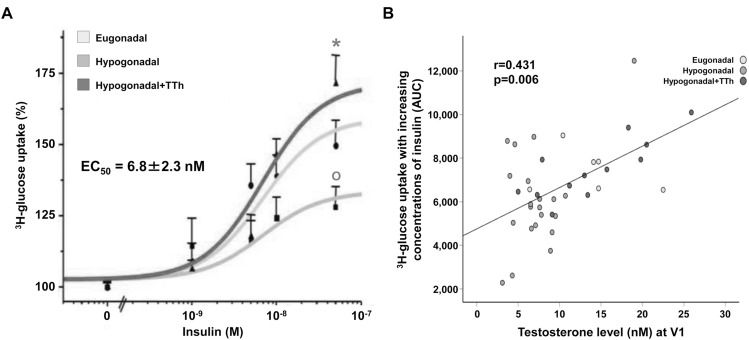
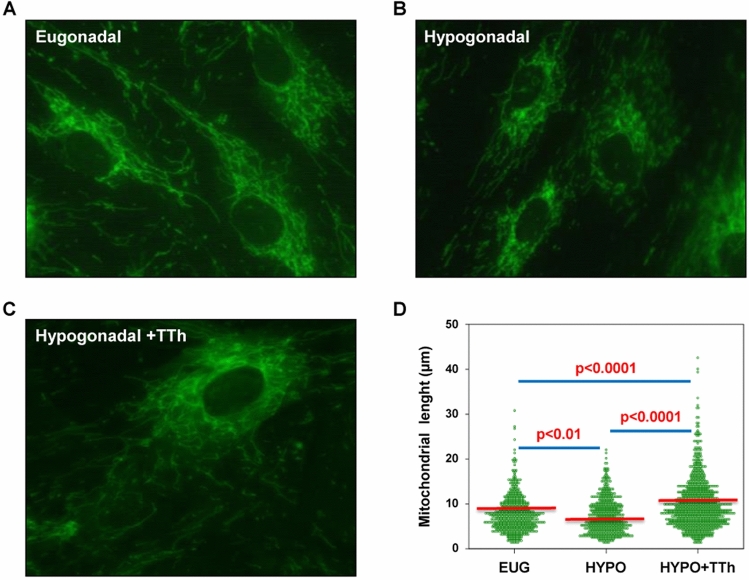
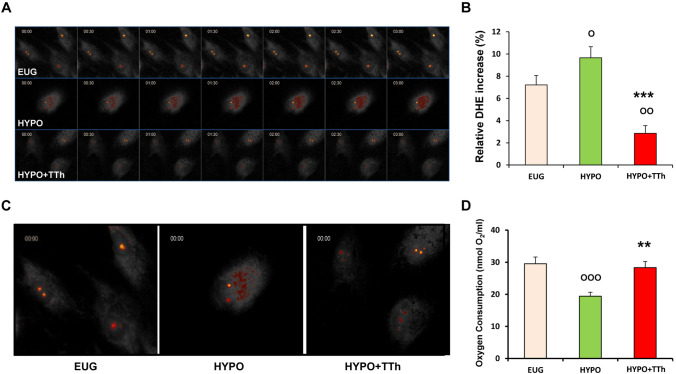
Results: In TTh-hypogonadal men, histopathological NAFLD activity and steatosis scores, as well as liver triglyceride content were lower than in untreated-hypogonadal men and comparable to eugonadal ones. TTh was also associated with a favorable hepatic expression of lipid handling-related genes. In visceral adipose tissue and preadipocytes, TTh was associated with an increased expression of lipid catabolism and mitochondrial bio-functionality markers. Preadipocytes from TTh men also exhibited a healthier morpho-functional phenotype of mitochondria and higher insulin-sensitivity compared to untreated-hypogonadal ones.
Conclusions: The present data suggest that TTh in severely obese, hypogonadal individuals induces metabolically healthier preadipocytes, improving insulin sensitivity, mitochondrial functioning and lipid handling. A potentially protective role for testosterone on the progression of NAFLD, improving hepatic steatosis and reducing intrahepatic triglyceride content, was also envisaged.
Clinical trial registration: ClinicalTrials.gov Identifier: NCT02248467, September 25th 2014.
Keywords: Adipose tissue; Hypogonadism; Liver; NAFLD; Obesity; Testosterone.
Conflict of interest statement
FS is a consultant for Bayer AG, manufacturer of testosterone-containing products. EM, PC, CC, IC, SF, TM, AG, ER, LP, MT, EF, BB, ML, GR, MM and LV have nothing to declare.
Figures

Similar articles
-
INT-767 prevents NASH and promotes visceral fat brown adipogenesis and mitochondrial function.J Endocrinol. 2018 Aug;238(2):107-127. doi: 10.1530/JOE-17-0557. J Endocrinol. 2018. PMID: 29945982
-
The Effect of Testosterone Replacement Therapy on Nonalcoholic Fatty Liver Disease in Older Hypogonadal Men.J Clin Endocrinol Metab. 2024 Jan 18;109(2):e757-e764. doi: 10.1210/clinem/dgad511. J Clin Endocrinol Metab. 2024. PMID: 37656011
-
Transcriptomic differences in intra-abdominal adipose tissue in extremely obese adolescents with different stages of NAFLD.Physiol Genomics. 2016 Dec 1;48(12):897-911. doi: 10.1152/physiolgenomics.00020.2016. Epub 2016 Oct 7. Physiol Genomics. 2016. PMID: 27764764 Free PMC article.
-
Cardiovascular Morbidity and Mortality in Men - Findings From a Meta-analysis on the Time-related Measure of Risk of Exogenous Testosterone.J Sex Med. 2022 Aug;19(8):1243-1254. doi: 10.1016/j.jsxm.2022.05.145. Epub 2022 Jun 23. J Sex Med. 2022. PMID: 35753891 Review.
-
Nonalcoholic fatty liver disease (NAFLD) from pathogenesis to treatment concepts in humans.Mol Metab. 2021 Aug;50:101122. doi: 10.1016/j.molmet.2020.101122. Epub 2020 Nov 19. Mol Metab. 2021. PMID: 33220492 Free PMC article. Review.
Cited by
-
The association of serum testosterone with dyslipidemia is mediated by obesity: the Henan Rural Cohort Study.J Endocrinol Invest. 2023 Apr;46(4):679-686. doi: 10.1007/s40618-022-01911-6. Epub 2022 Oct 11. J Endocrinol Invest. 2023. PMID: 36219315
-
Associations of Sex Steroids and Sex Hormone-Binding Globulin with Non-Alcoholic Fatty Liver Disease: A Population-Based Study and Meta-Analysis.Genes (Basel). 2022 May 27;13(6):966. doi: 10.3390/genes13060966. Genes (Basel). 2022. PMID: 35741728 Free PMC article.
-
Metabolic Effects of Testosterone Added to Intensive Lifestyle Intervention in Older Men With Obesity and Hypogonadism.J Clin Endocrinol Metab. 2025 Feb 18;110(3):e814-e826. doi: 10.1210/clinem/dgae249. J Clin Endocrinol Metab. 2025. PMID: 38606934 Clinical Trial.
-
A cross-sectional analysis of the association between testosterone and biopsy-proven non-alcoholic fatty liver disease in men with obesity.Endocrine. 2023 Apr;80(1):54-63. doi: 10.1007/s12020-022-03245-y. Epub 2023 Mar 1. Endocrine. 2023. PMID: 36857008
-
Association of non-alcoholic fatty liver disease with total testosterone in non-overweight/obese men with type 2 diabetes mellitus.J Endocrinol Invest. 2023 Aug;46(8):1565-1572. doi: 10.1007/s40618-023-02006-6. Epub 2023 Feb 1. J Endocrinol Invest. 2023. PMID: 36725809
References
-
- Anderson EJ, Lustig ME, Boyle KE, Woodlief TL, Kane DA, Lin CT, Price JW, 3rd, Kang L, Rabinovitch PS, Szeto HH, Houmard JA, Cortright RN, Wasserman DH, Neufer PD. Mitochondrial H2O2 emission and cellular redox state link excess fat intake to insulin resistance in both rodents and humans. J Clin Investig. 2009;119(3):573–581. doi: 10.1172/JCI37048. - DOI - PMC - PubMed
-
- Boudina S, Sena S, Sloan C, Tebbi A, Han YH, O’Neill BT, Cooksey RC, Jones D, Holland WL, McClain DA, Abel ED. Early mitochondrial adaptations in skeletal muscle to diet-induced obesity are strain dependent and determine oxidative stress and energy expenditure but not insulin sensitivity. Endocrinology. 2012;153(6):2677–2688. doi: 10.1210/en.2011-2147. - DOI - PMC - PubMed
Publication types
MeSH terms
Substances
Associated data
LinkOut - more resources
Full Text Sources
Medical
