. 2020 Oct 9;127(9):e184-e209.
doi: 10.1161/CIRCRESAHA.120.316704. Epub 2020 Aug 9.

Epigenomic and Transcriptomic Dynamics During Human Heart Organogenesis

Affiliations

Epigenomic and Transcriptomic Dynamics During Human Heart Organogenesis

Jennifer VanOudenhove et al. Circ Res. .

Abstract

Rationale: There is growing evidence that common variants and rare sequence alterations in regulatory sequences can result in birth defects or predisposition to disease. Congenital heart defects are the most common birth defect and have a clear genetic component, yet only a third of cases can be attributed to structural variation in the genome or a mutation in a gene. The remaining unknown cases could be caused by alterations in regulatory sequences.

Objective: Identify regulatory sequences and gene expression networks that are active during organogenesis of the human heart. Determine whether these sites and networks are enriched for disease-relevant genes and associated genetic variation.

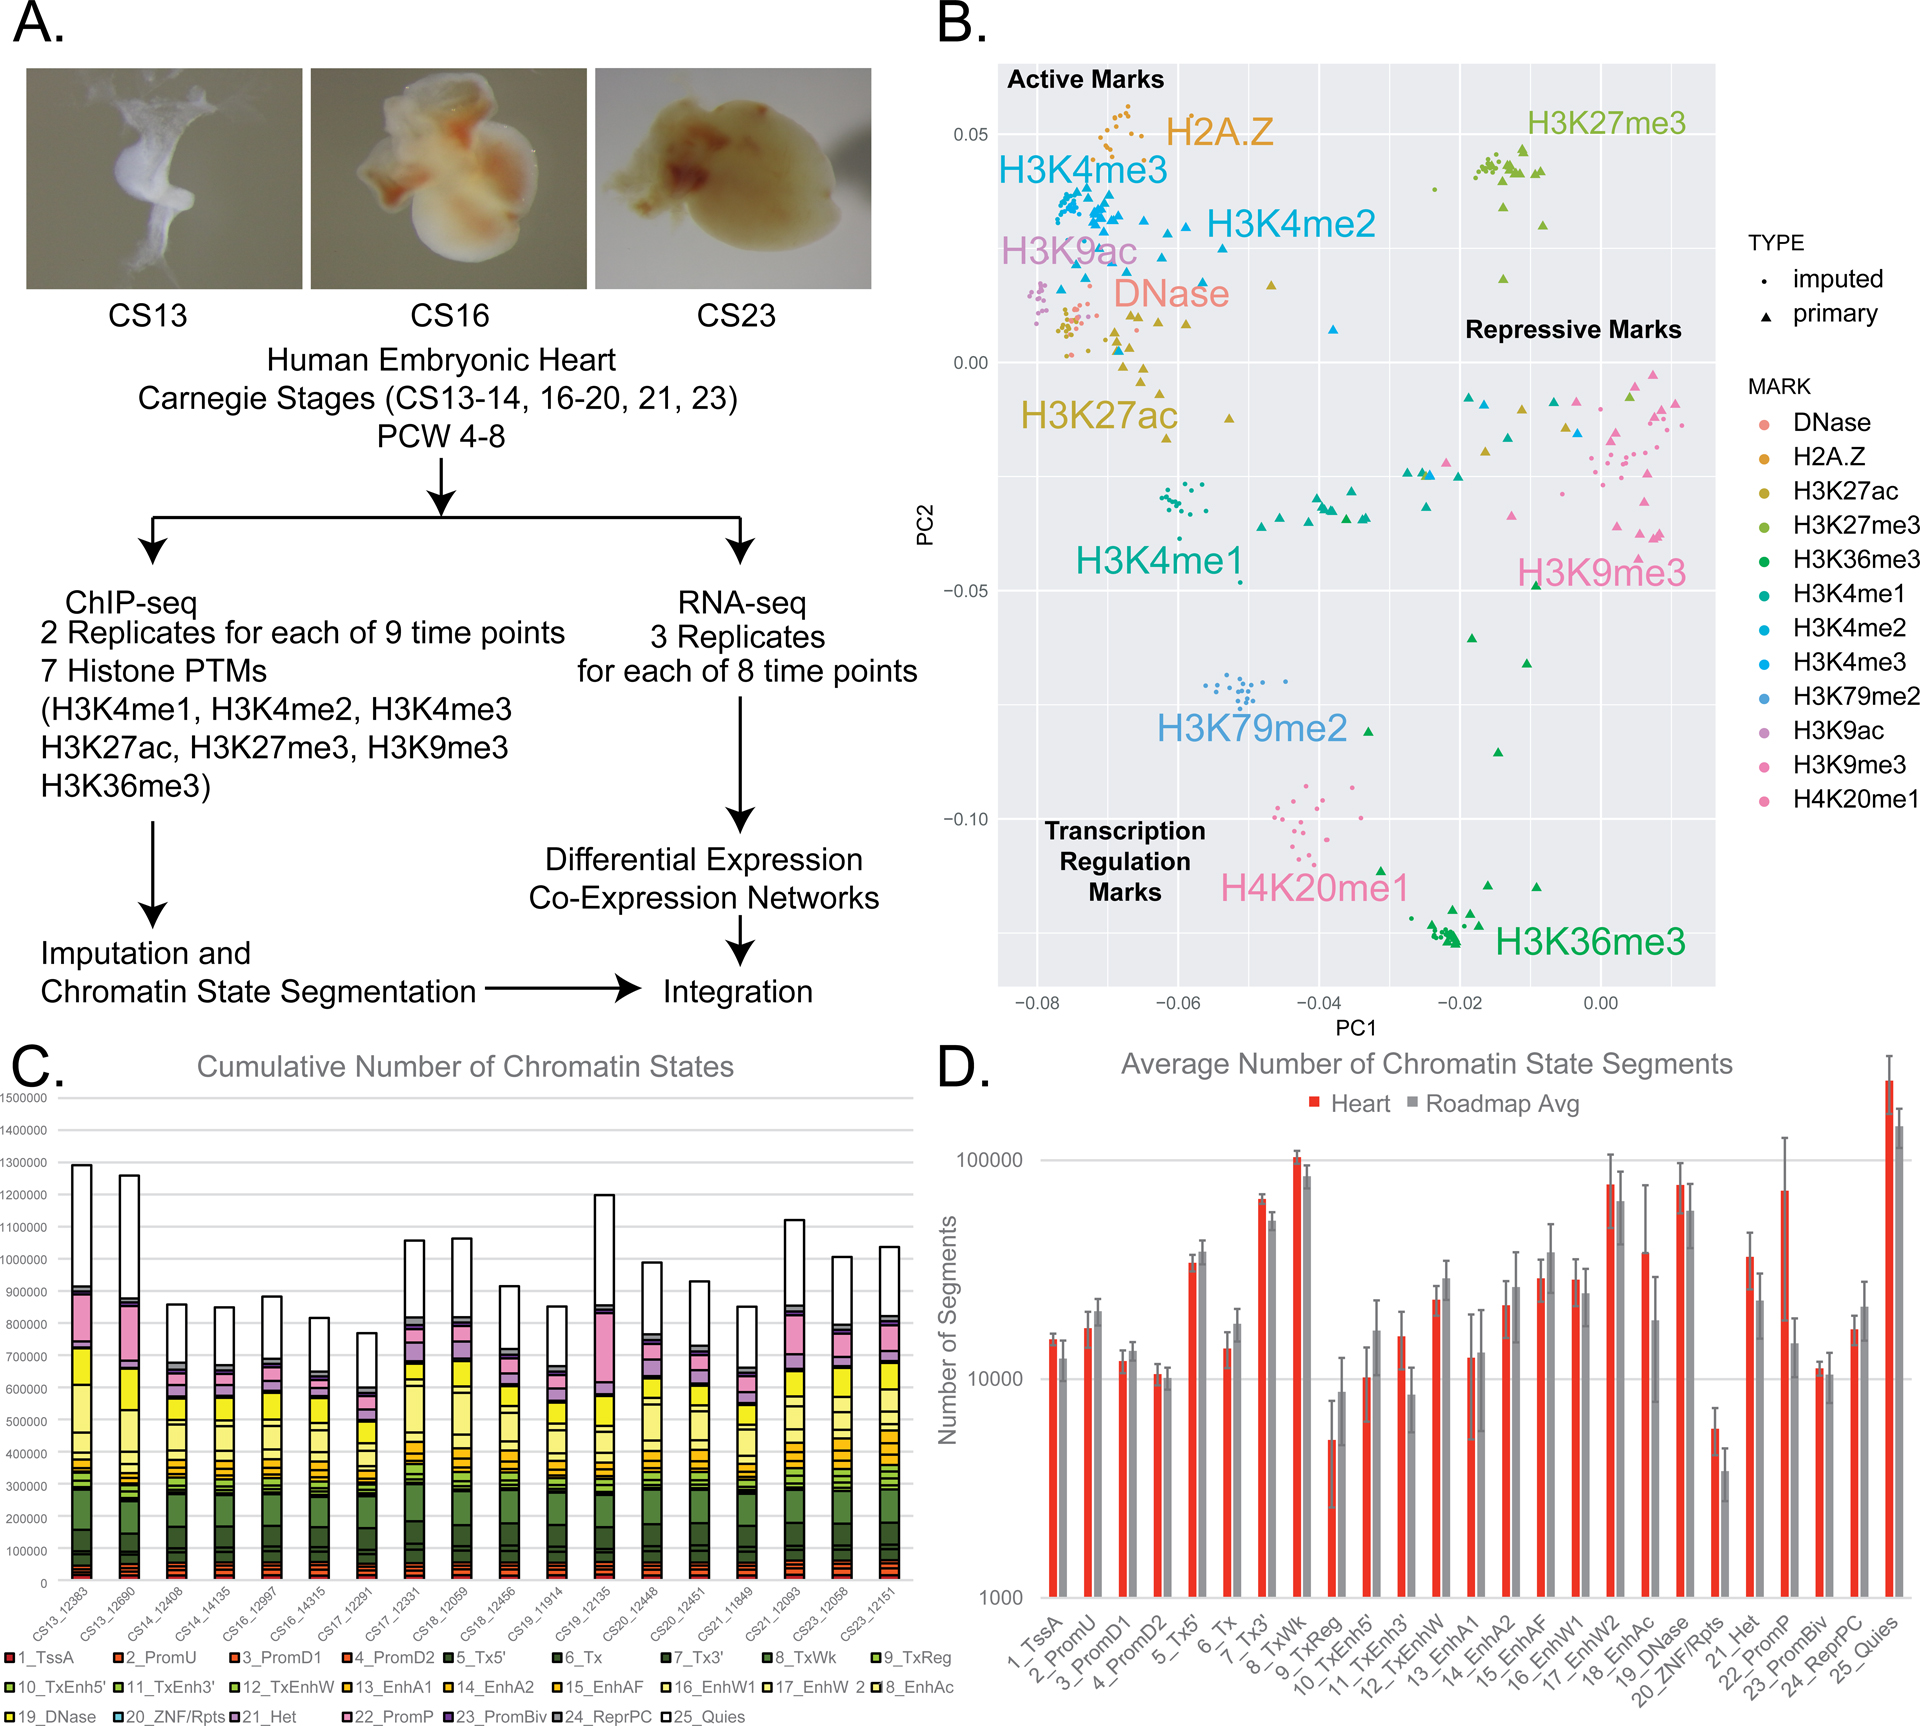
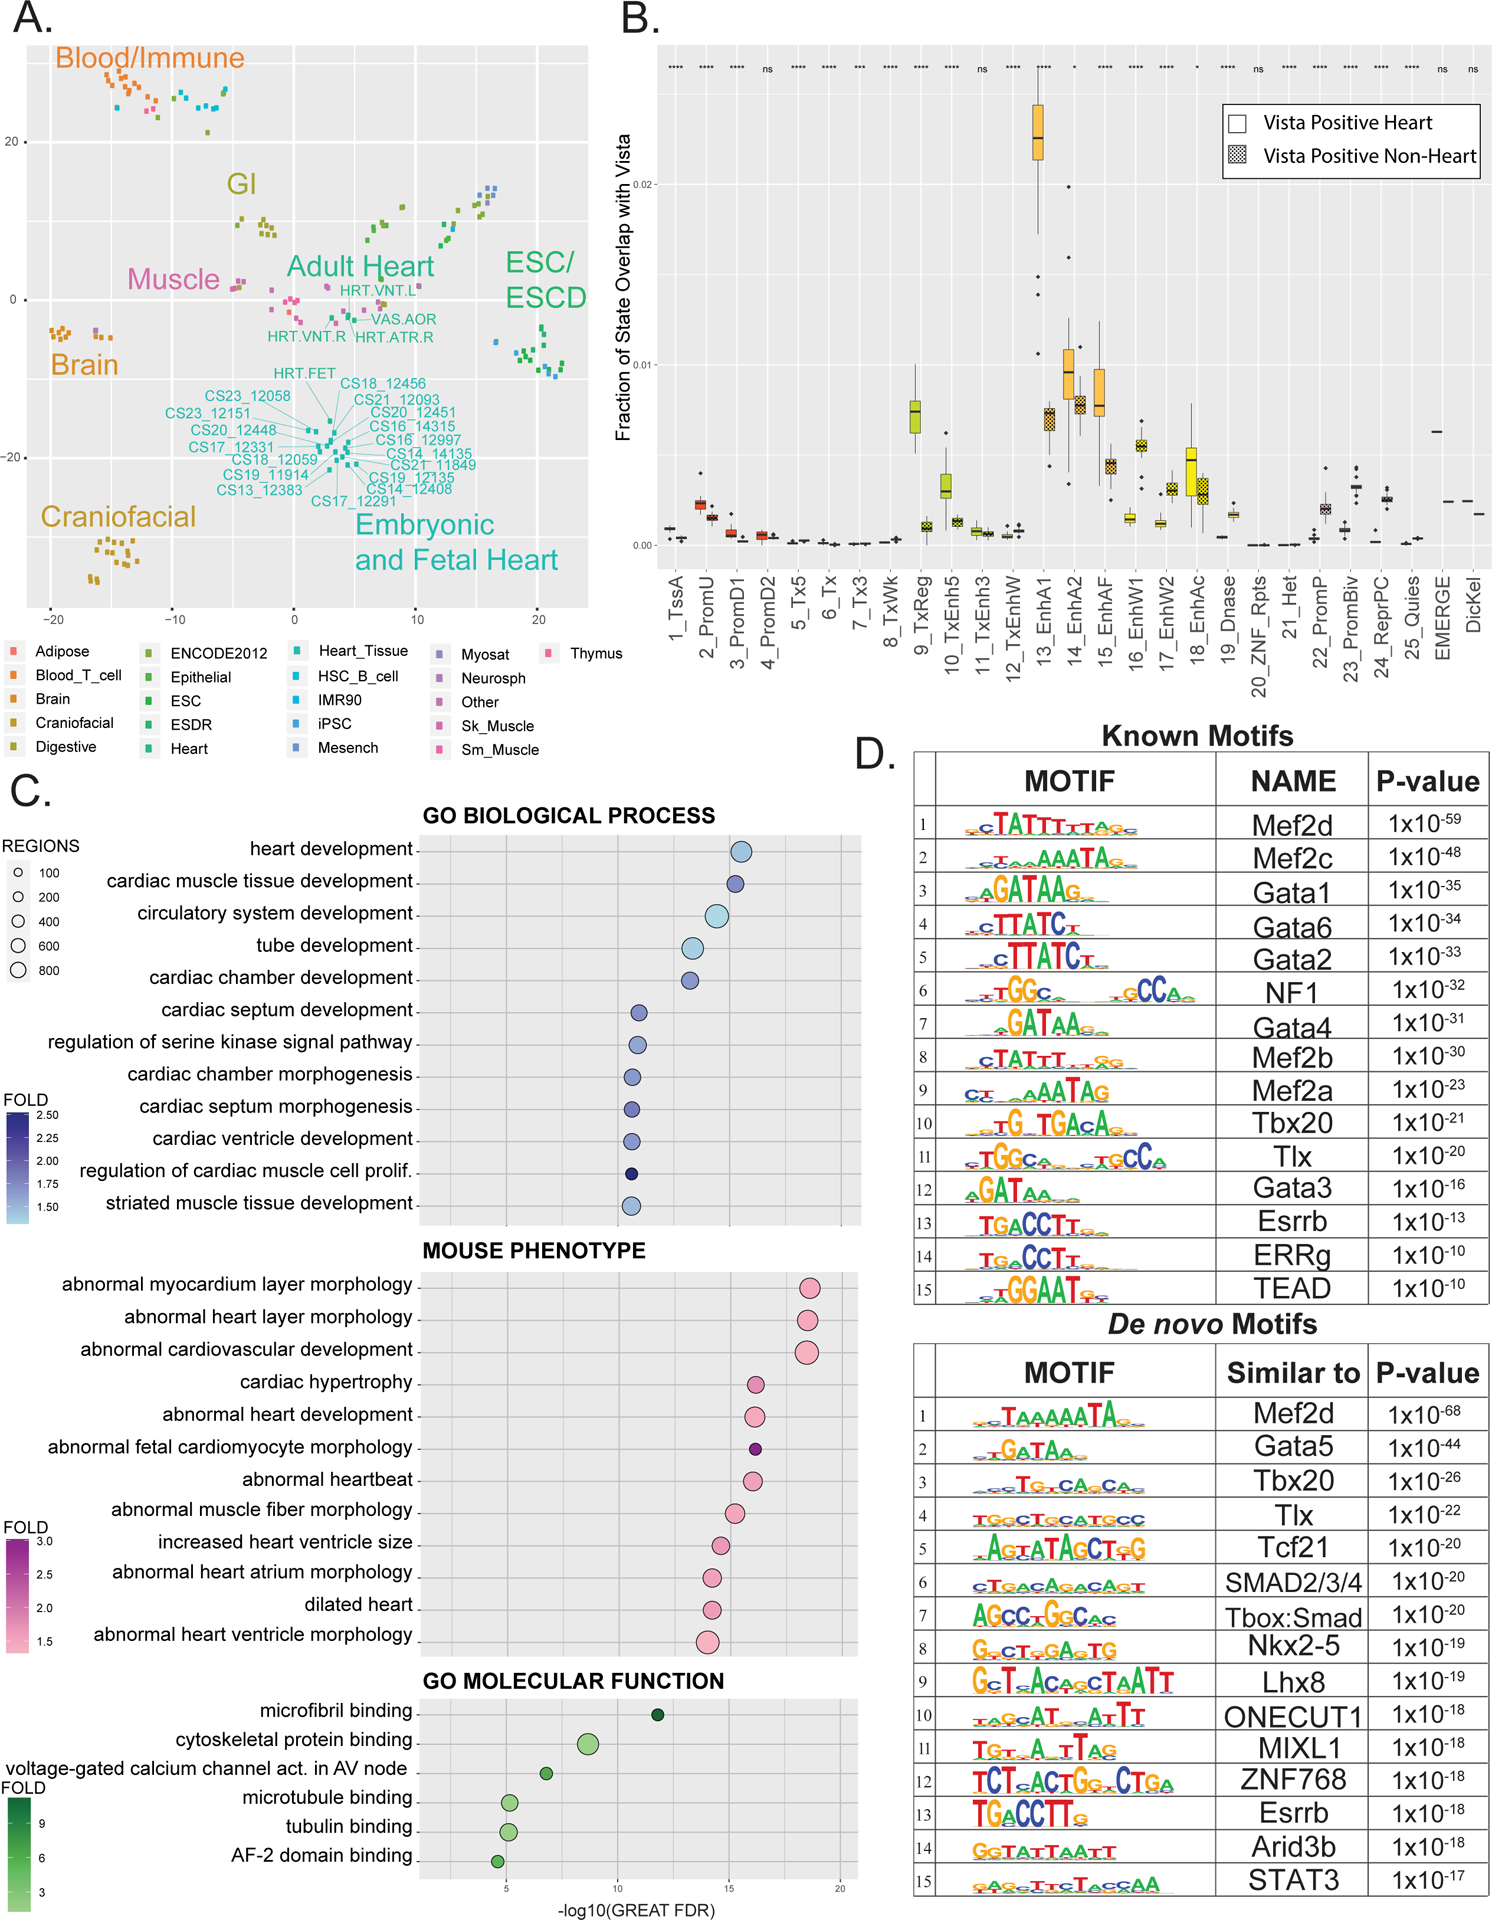
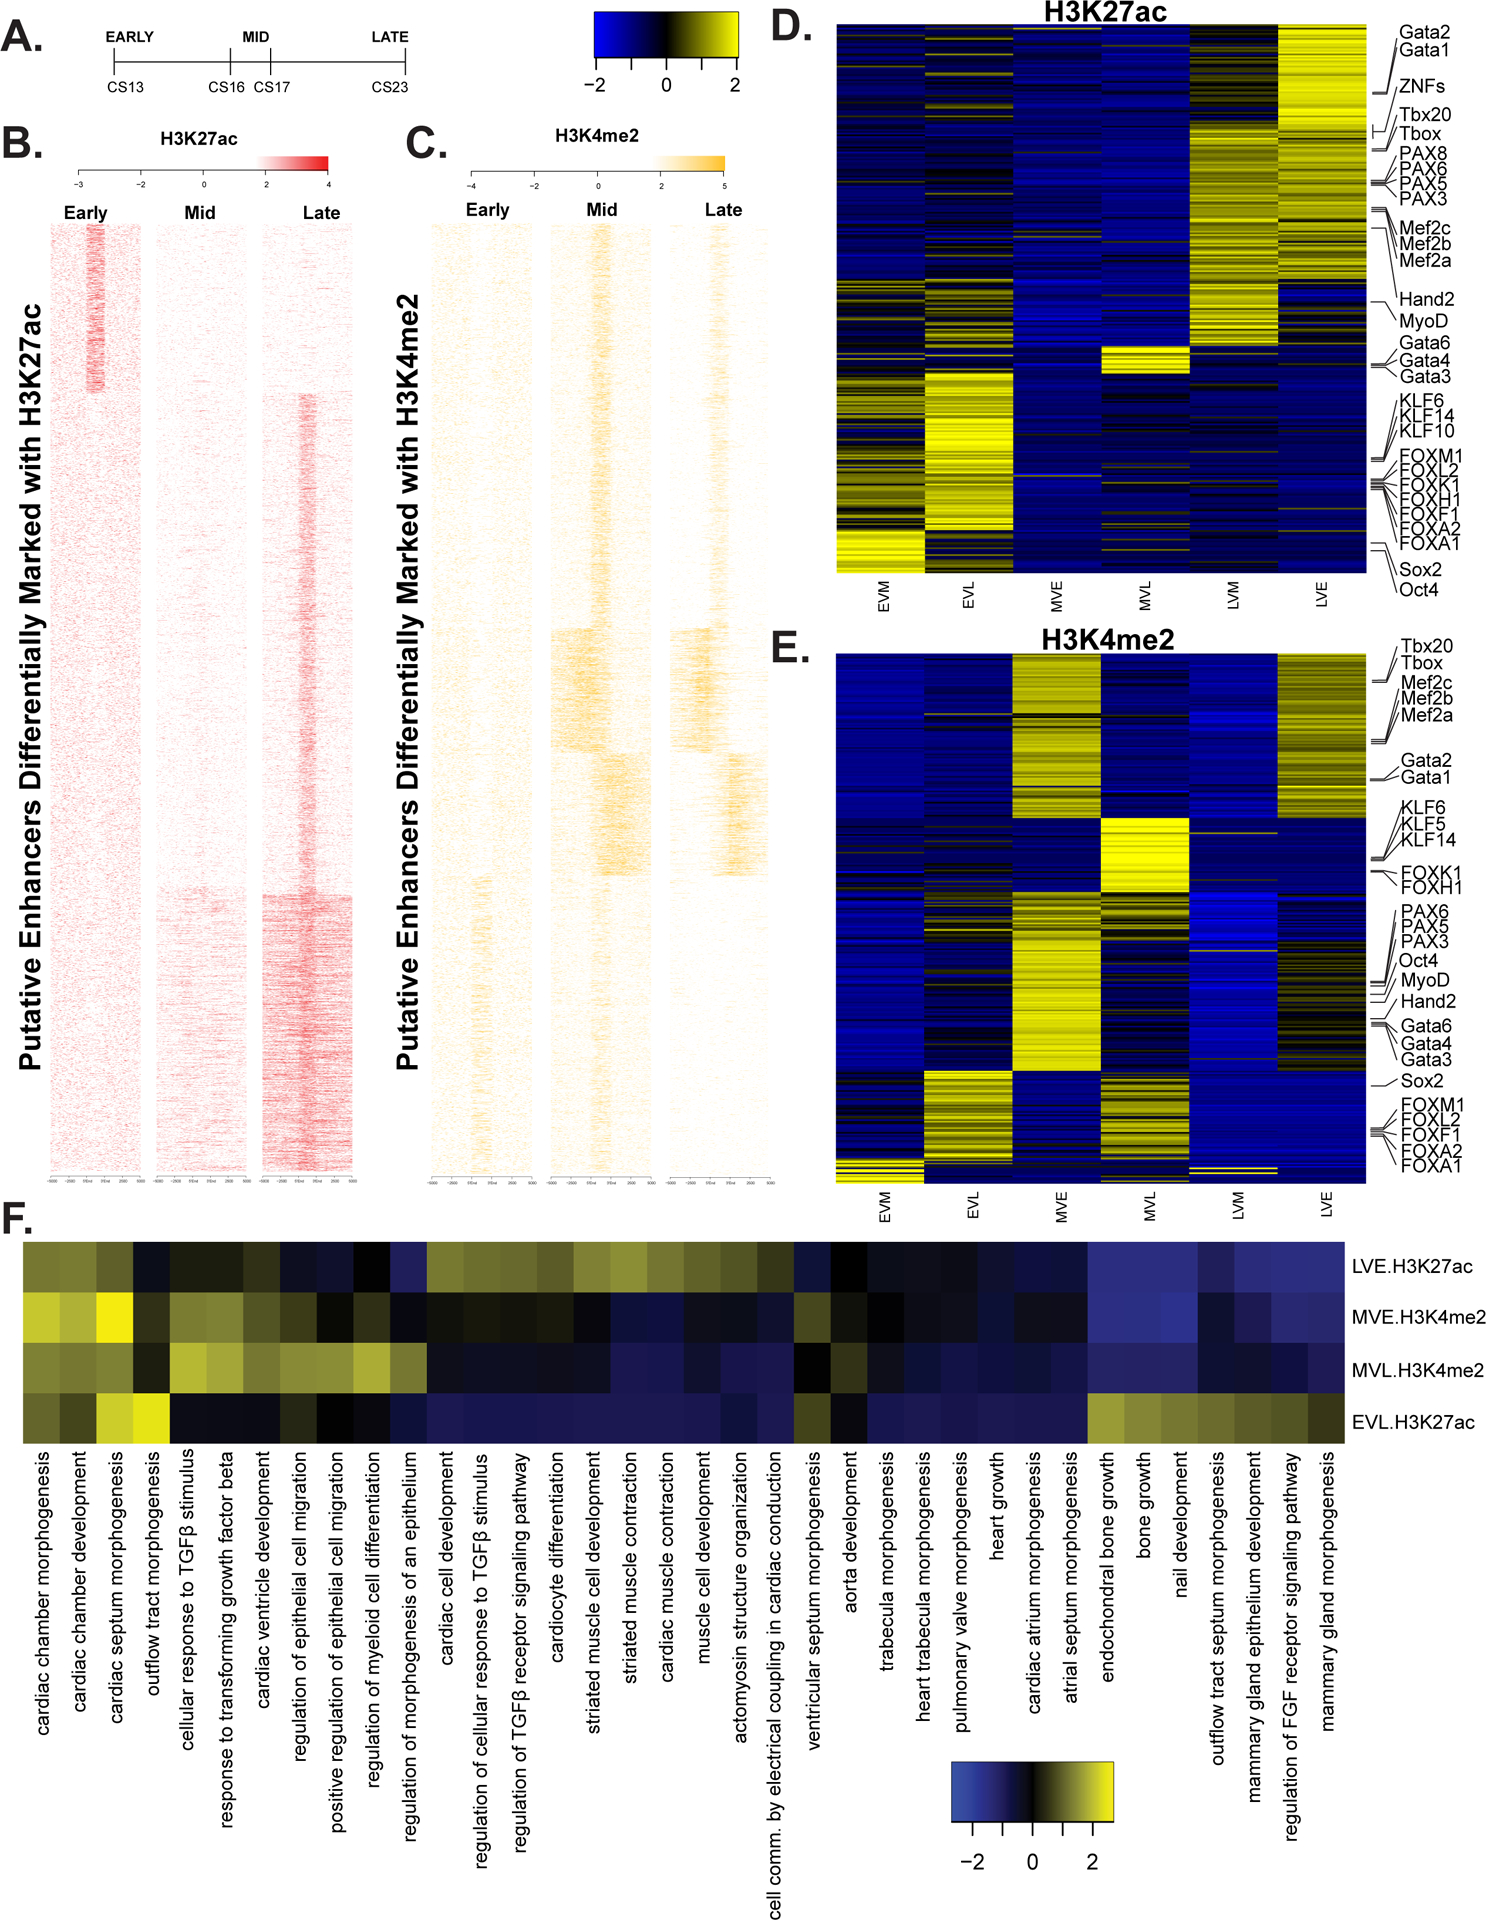
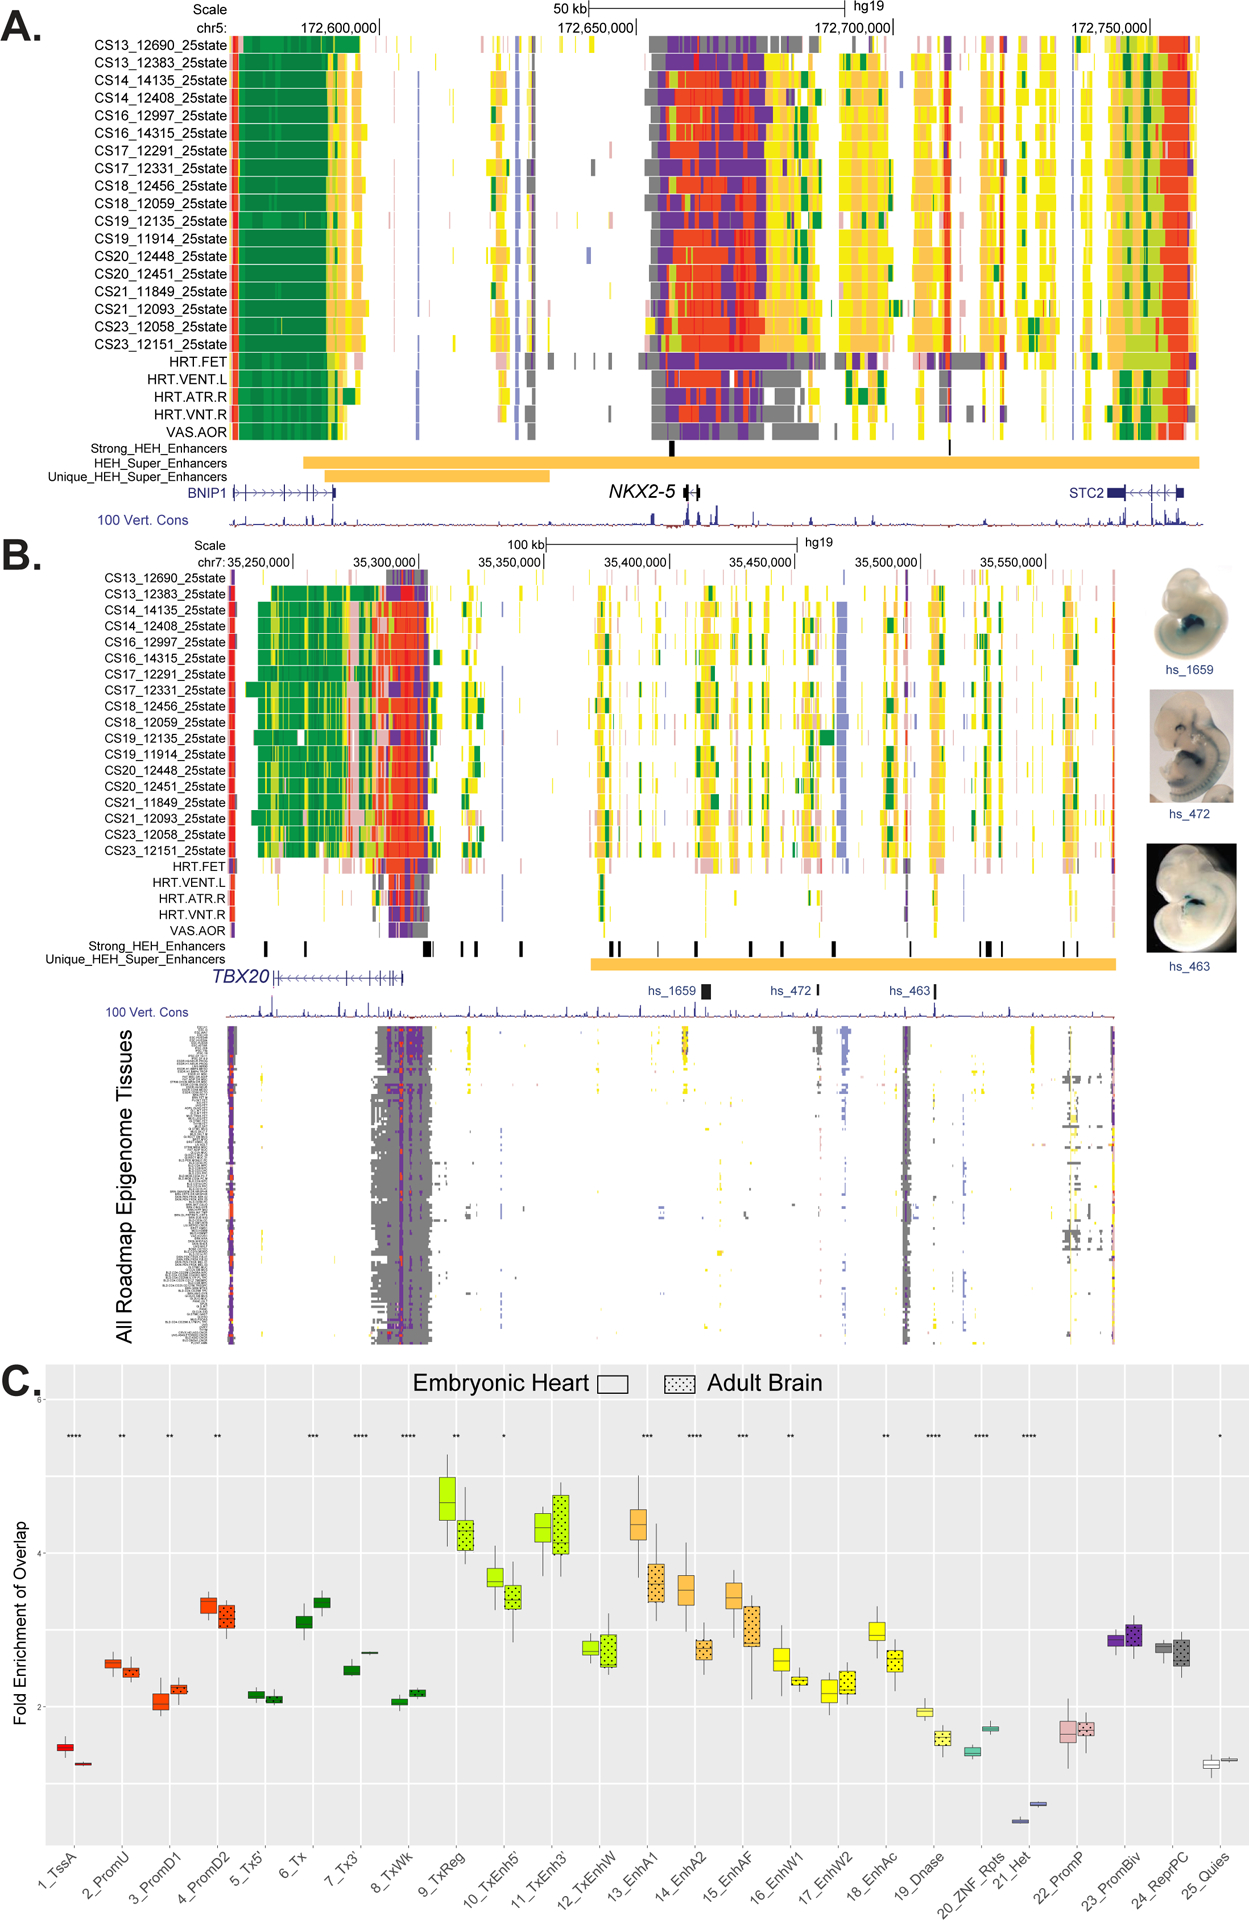
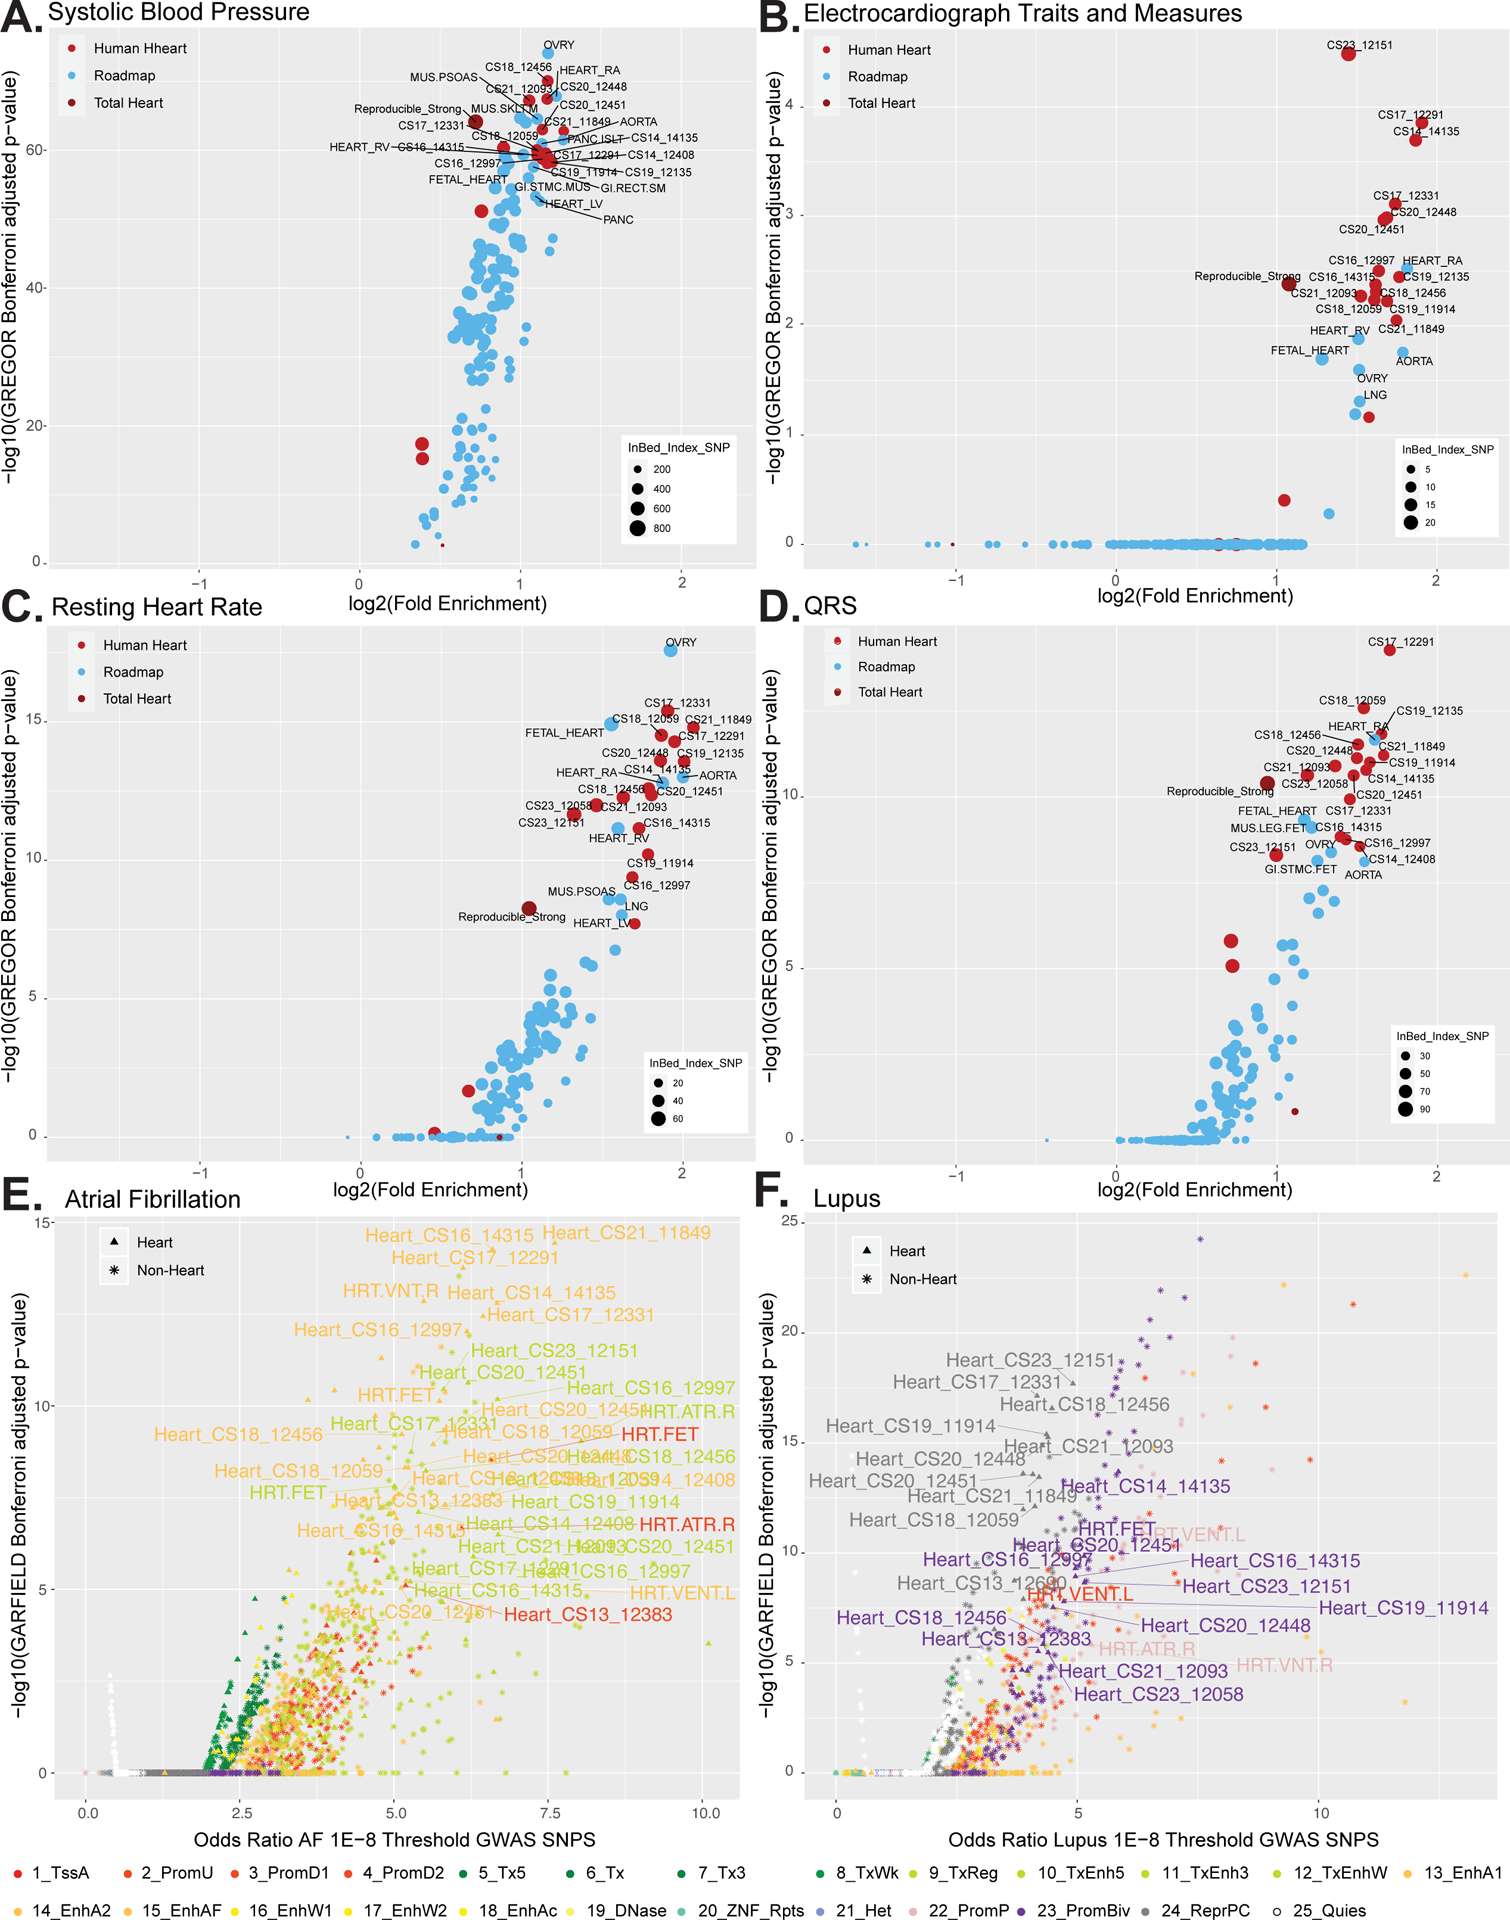
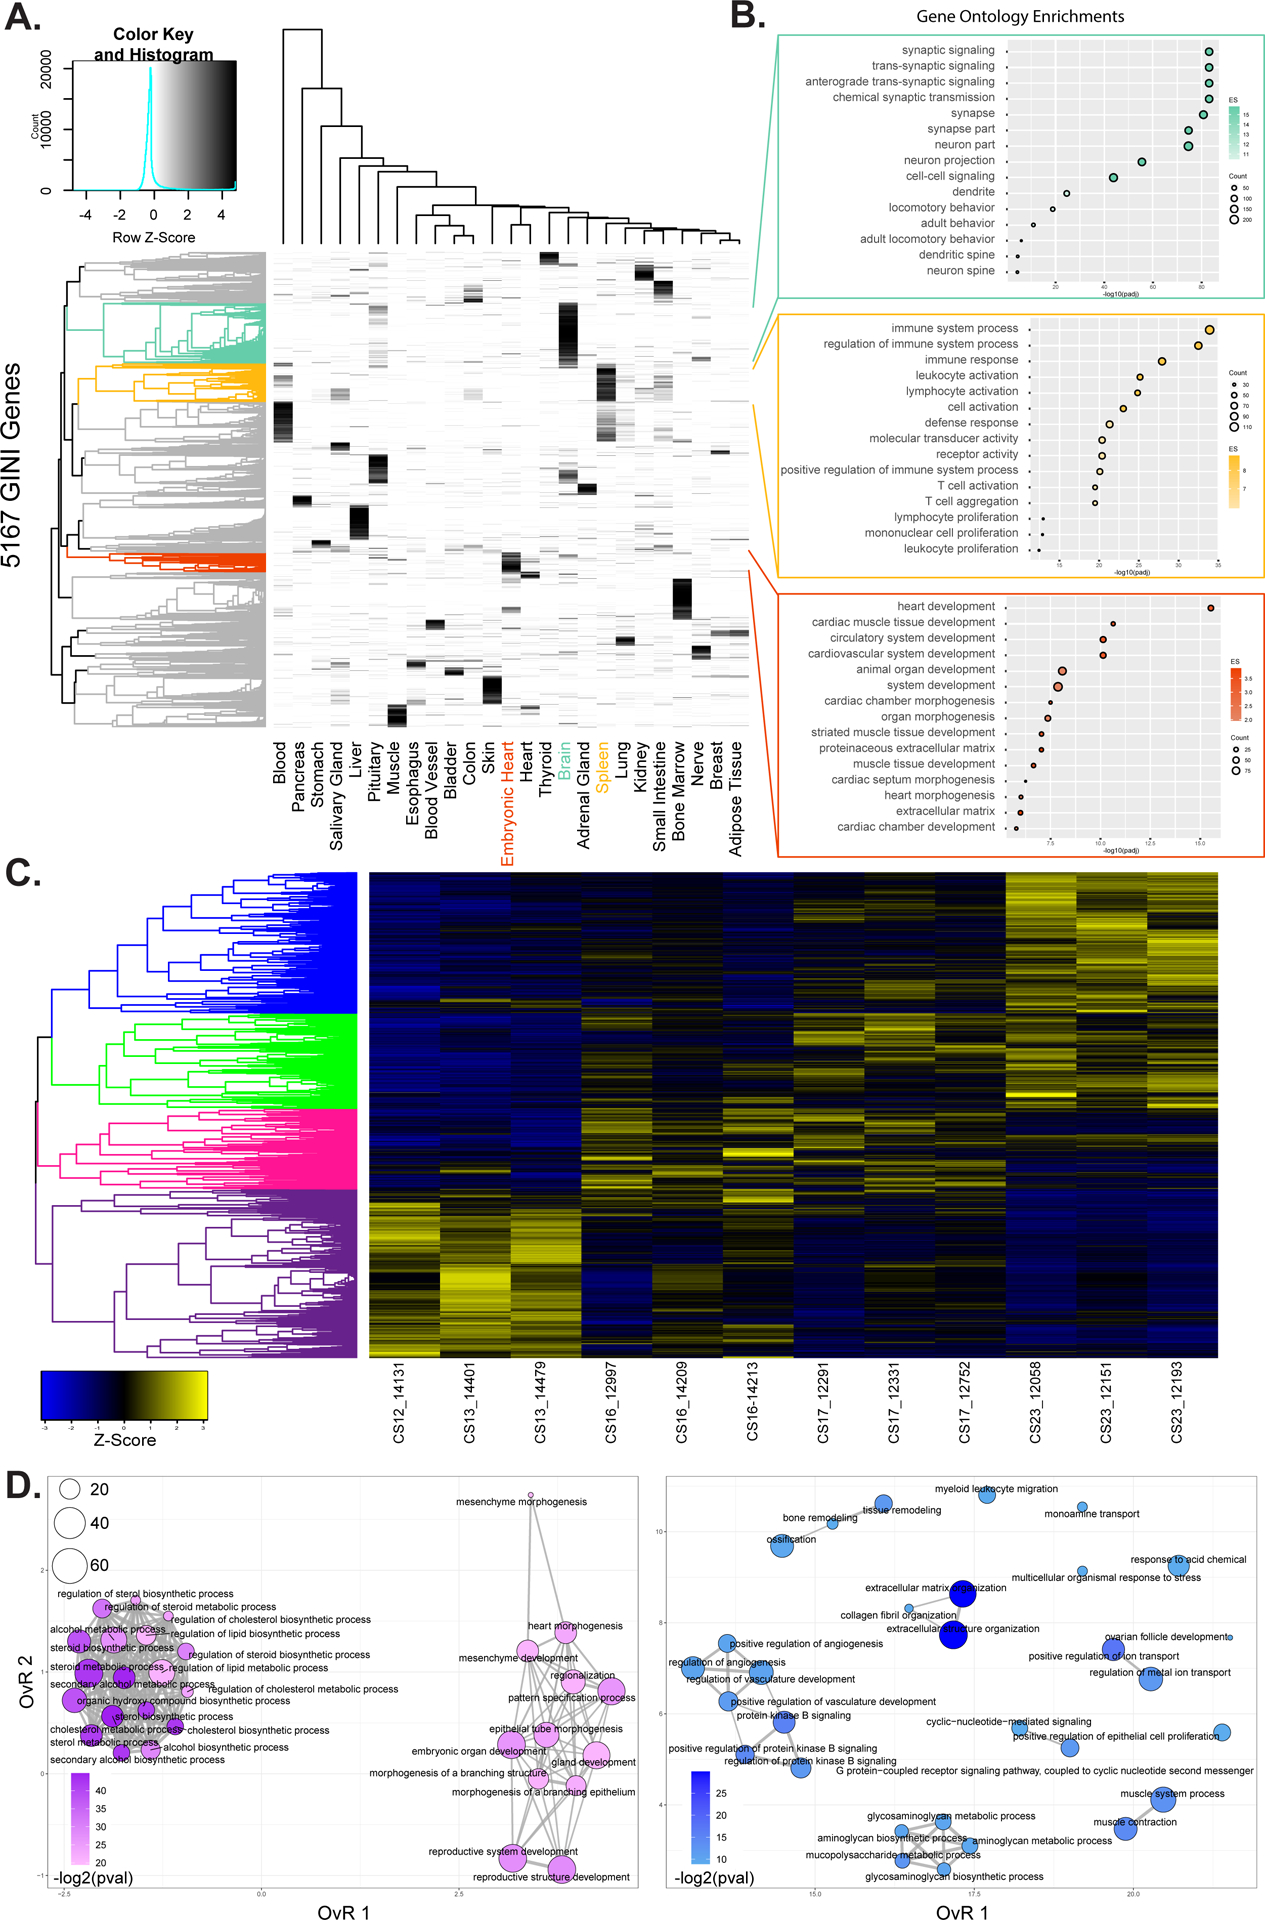
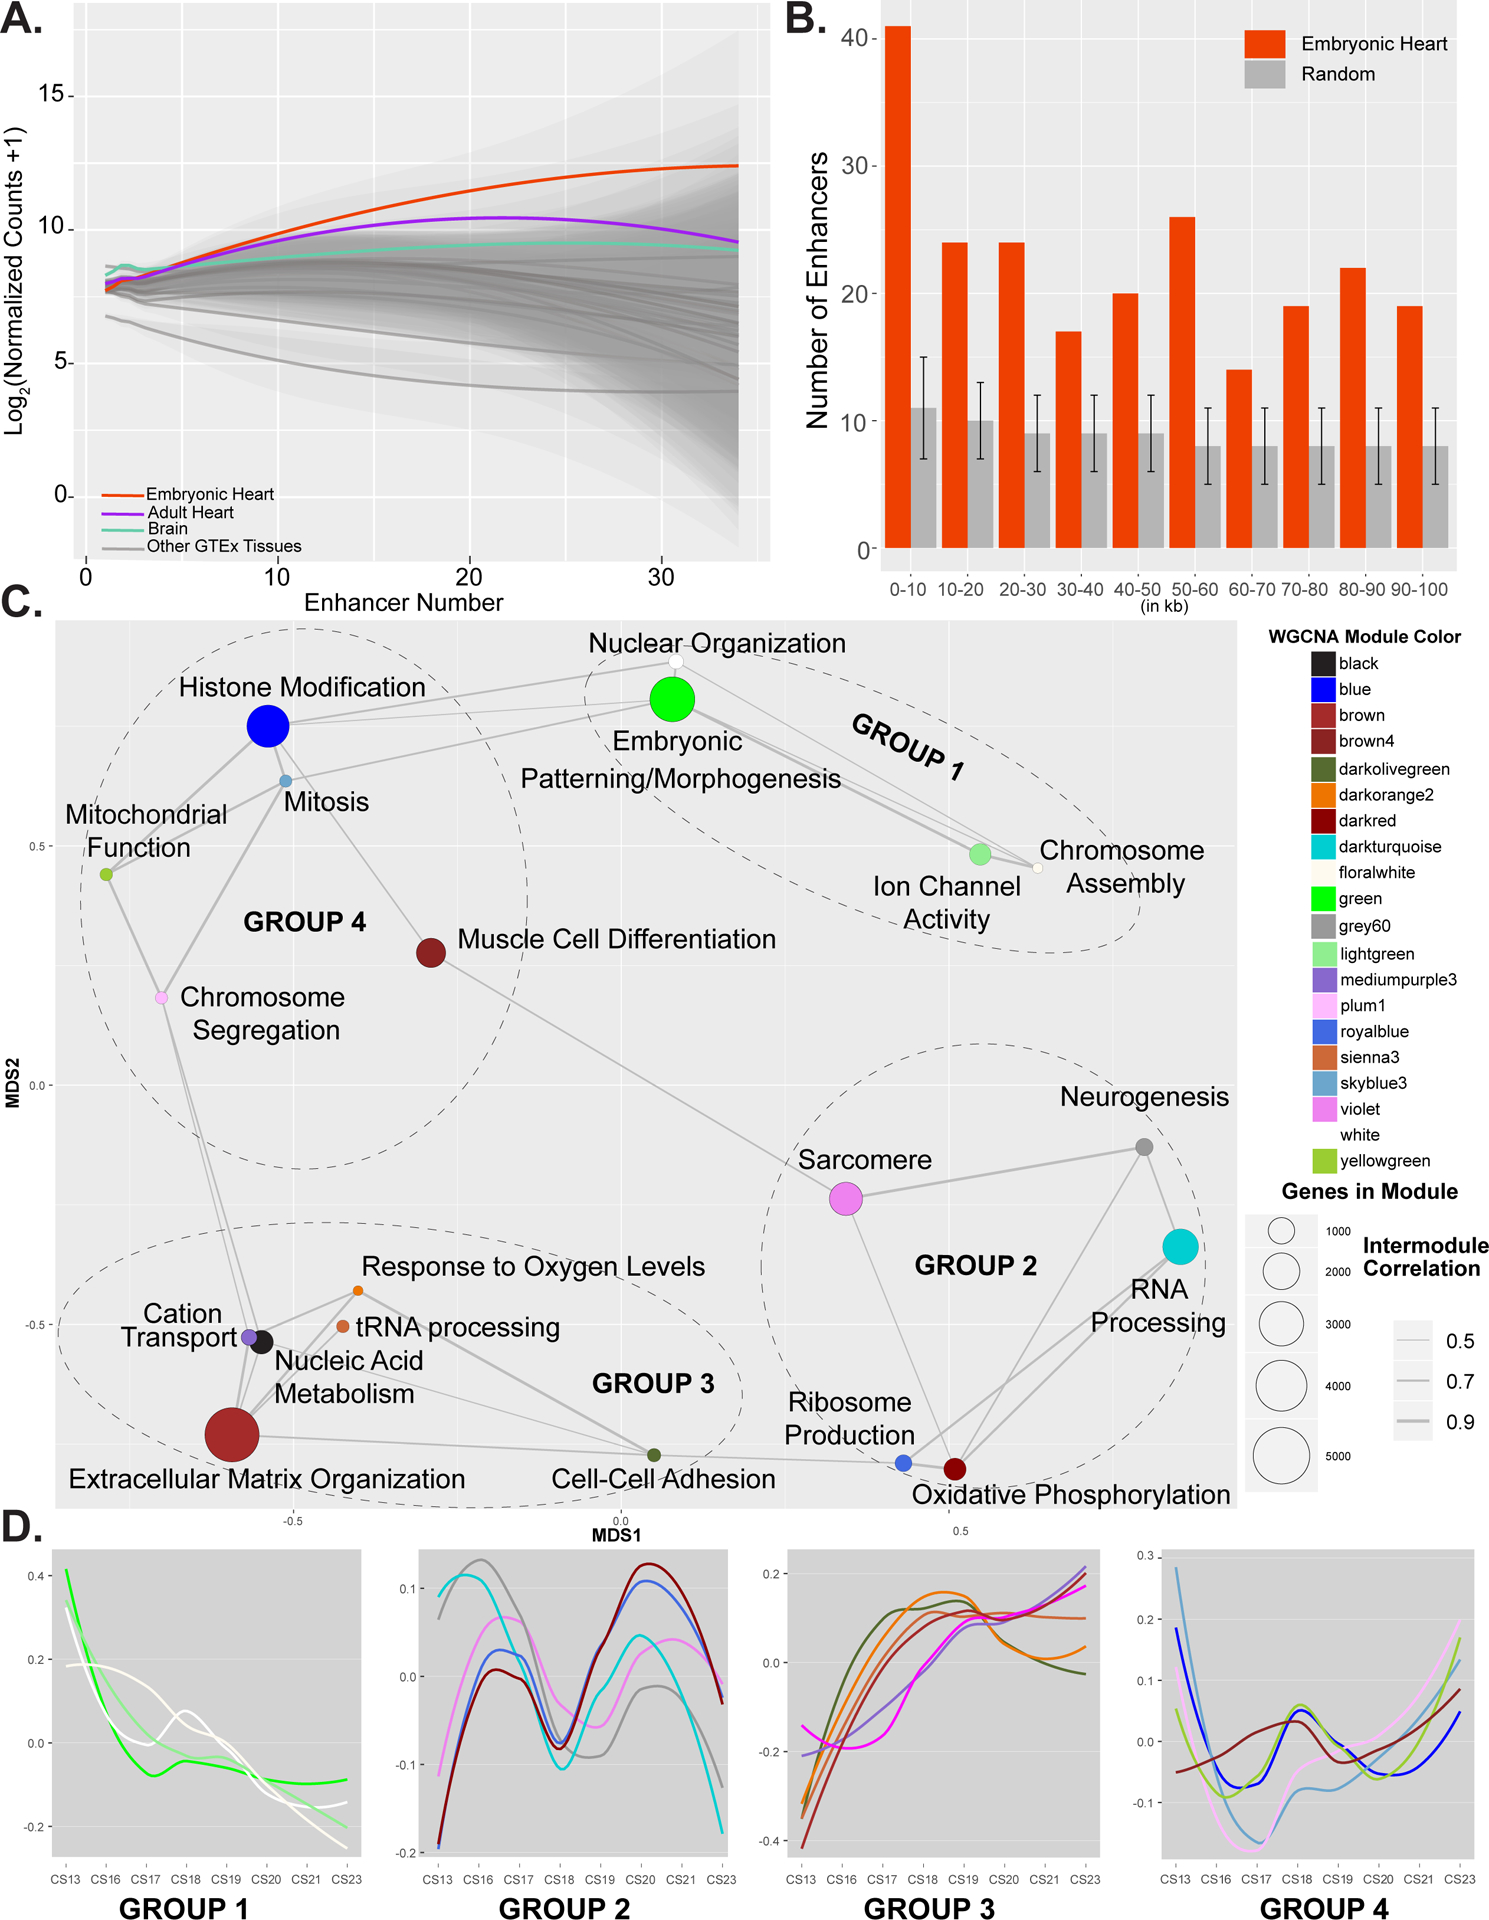
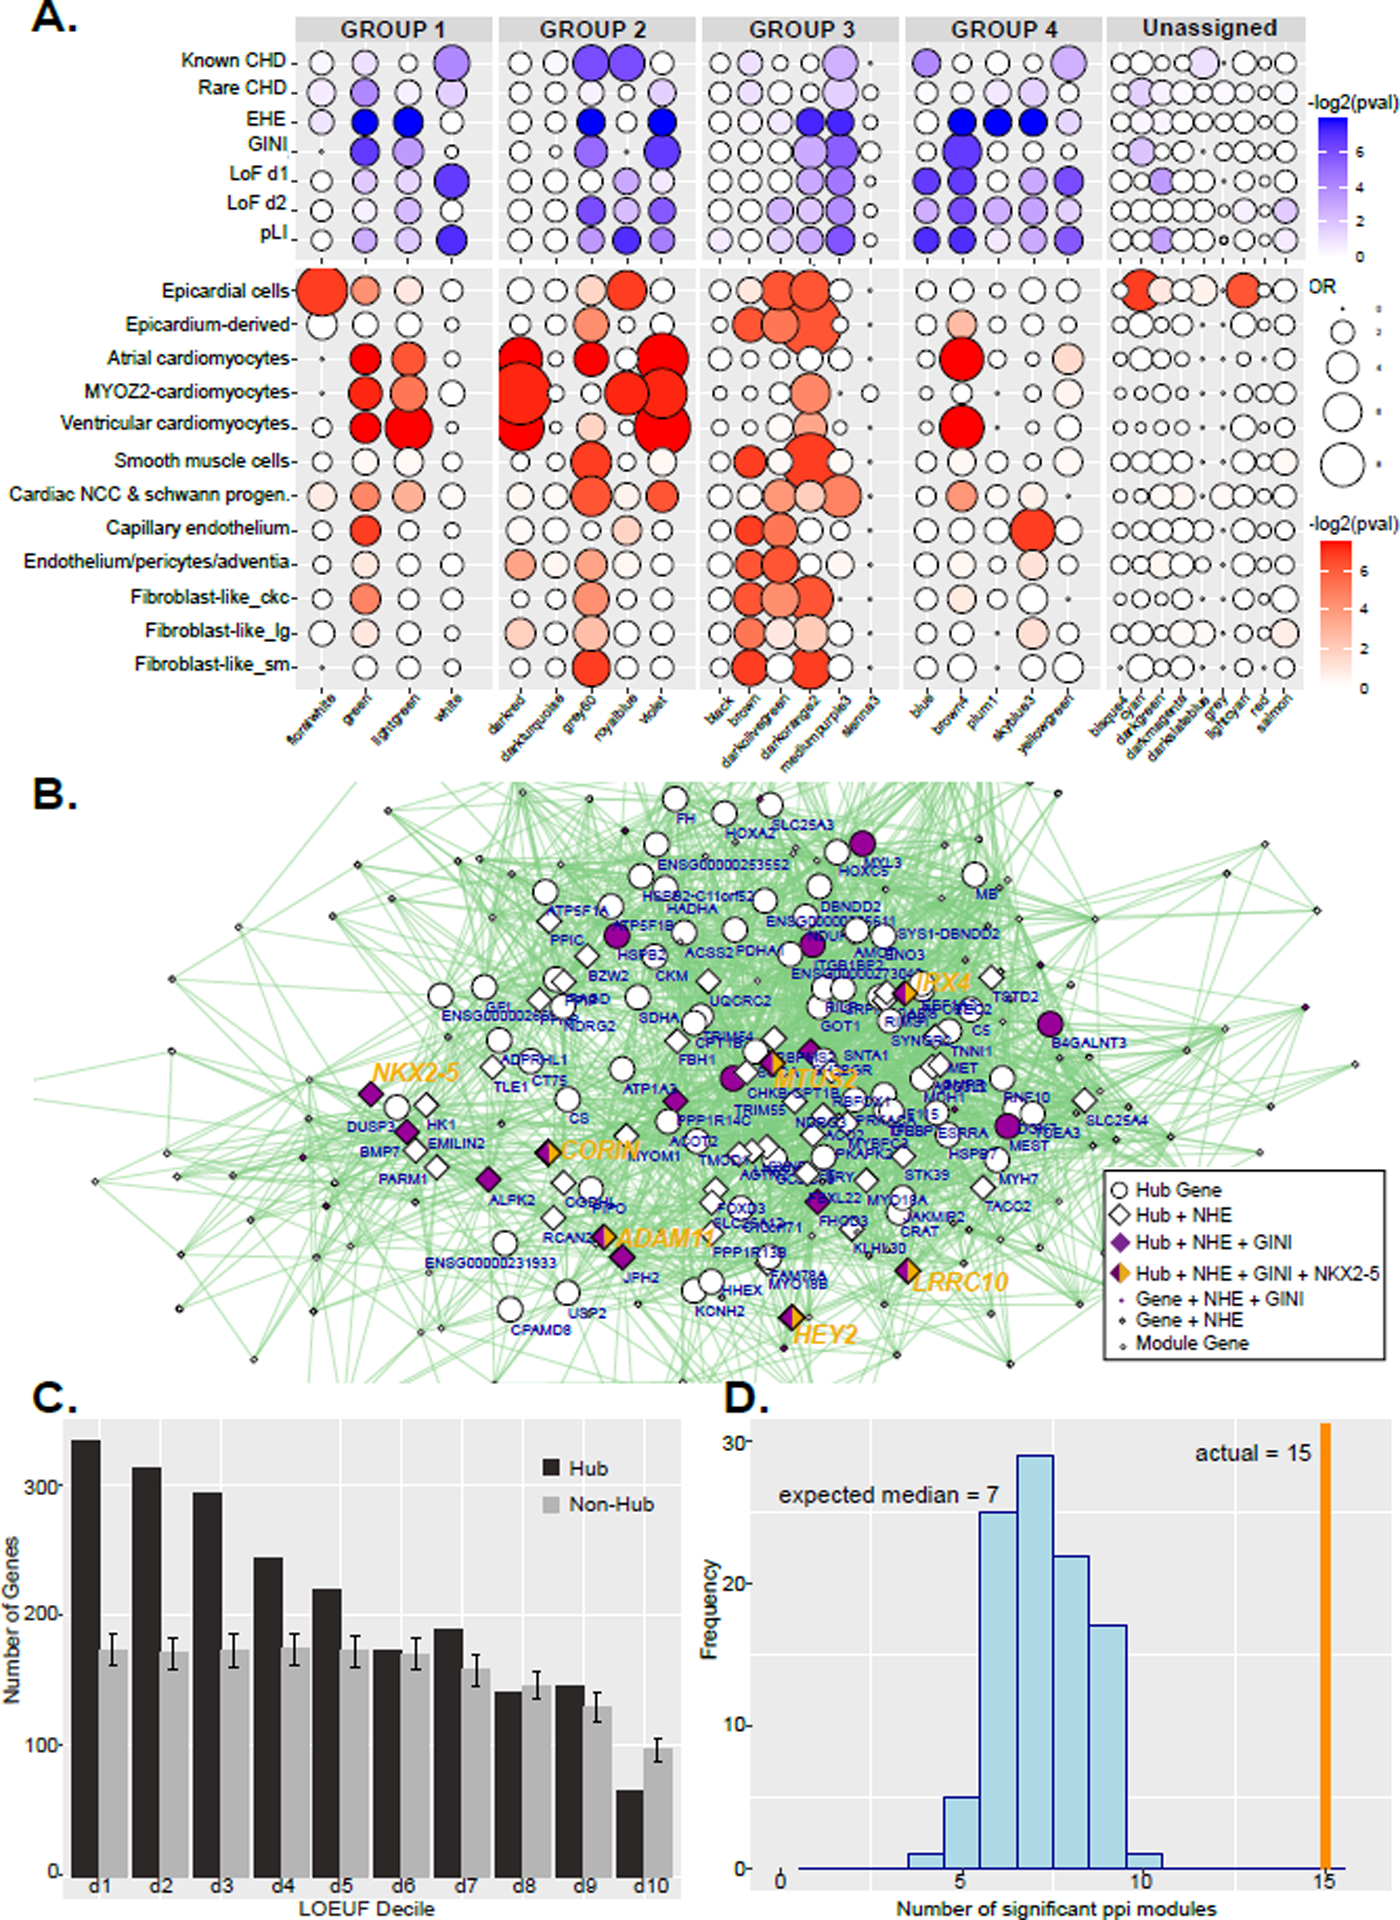
Methods and results: We characterized ChromHMM (chromatin state) and gene expression dynamics during human heart organogenesis. We profiled 7 histone modifications in embryonic hearts from each of 9 distinct Carnegie stages (13-14, 16-21, and 23), annotated chromatin states, and compared these maps to over 100 human tissues and cell types. We also generated RNA-sequencing data, performed differential expression, and constructed weighted gene coexpression networks. We identified 177 412 heart enhancers; 12 395 had not been previously annotated as strong enhancers. We identified 92% of all functionally validated heart-positive enhancers (n=281; 7.5× enrichment; P<2.2×10⁻¹⁶). Integration of these data demonstrated novel heart enhancers are enriched near genes expressed more strongly in cardiac tissue and are enriched for variants associated with ECG measures and atrial fibrillation. Our gene expression network analysis identified gene modules strongly enriched for heart-related functions, regulatory control by heart-specific enhancers, and putative disease genes.

Conclusions: Well-connected hub genes with heart-specific expression targeted by embryonic heart-specific enhancers are likely disease candidates. Our functional annotations will allow for better interpretation of whole genome sequencing data in the large number of patients affected by congenital heart defects.

Keywords: developmental biology; disease; epigenomics; genetics; genomics.


Figures

Figure 1.
Figure 1.. Epigenomic and transcriptomic profiling of human embryonic heart development.
A. Top panels show representative images of primary human embryonic heart tissue at indicated Carnegie Stages. Lower panel indicates data types collects and downstream analyses performed in this study. B. Principal component analysis of genome-wide primary and imputed ChIP-Seq signals. Each mark is indicated by separate colors. Primary samples are shown as triangles and imputed data as circles. Grouping of marks and overall function are indicated in normal and bold text respectively. C. Total numbers of each chromatin state identified in segmentation of each individual embryonic tissue sample. Samples are ordered from left to right as earliest to latest timepoints. Legend of colors are located below using conventions defined by Roadmap Epigenome. D. Average numbers of each chromatin state for all heart samples (red) and all Roadmap Epigenome samples (grey) are shown. Error bars represent standard deviations for each chromatin state and tissue group.
Figure 2.
Figure 2.. Multi-tissue comparisons of global enhancer activation and enrichment of heart phenotype in enhancer segments.
A. tSNE projection of imputed H3K27ac p-value signals at 444,413 enhancer segments from tissues profiled by Roadmap Epigenome and in this study. Dots are color coded by tissue as indicated and labelled as each individual tissue samples as profiled by Roadmap epigenome or in this study. B. Fraction of each of the 25 ChromHMM States, EMERGE, and Dickel datasets that overlap with either active heart enhancers (unshaded) or enhancers active in tissues other than heart (shaded) as tested by the Vista Enhancer Browser (enhancer.lbl.gov). Significance of difference of overlap between heart and other tissue were calculated using the Mann-Whitney test and is shown at top (p-value ≤ 0.05 = *, ≤ 0.01= **, ≤ 0.001= *** , ≤ 0.0001 = ****) C. Gene ontology enrichments for indicated functional categories for putative novel strong enhancer segments identified in human embryonic heart versus Roadmap Epigenome (n=12,395). Putative enhancers were assigned to genes and significance determined by GREAT. Position of each dot is based on -log10(Binomial FDR) and colored by binomial fold enrichment calculated by GREAT. D. Top most significantly enriched motifs in putative EHEs calculated by HOMER. Shown are position weight matrix for each motif, transcription factor predicted to bind that motif, and HOMER p-value (Upper panel) HOMER known motifs (Lower panel) de novo motifs.
Figure 3.
Figure 3.. Differential enhancer utilization during embryonic heart development.
A. Delineation of three major stages of heart development during the embryonic period based on Carnegie staging. B. Heatmap of signal at putative enhancers differentially marked with H3K27ac C. Same as B but with H3K4me2. D.Heatmap of z-scores for level of significance of motifs enriched in each class of differentially regulated enhancers based on pairwise comparisons of replicates of H3K27ac signal at all embryonic heart enhancer segments using DiffBind. Comparisons are indicated as follows: early up versus mid (EVM), early up versus late (EVL), mid up versus early (MVE), mid up versus late (MVL), late up versus mid (LVM), late up versus early (LVE). The more significantly enriched motifs are colored yellow. E. Same as in D but using H3K4me2 signals. F. Heatmap of most variable z-scores for significance of enrichment of gene ontology categories for genes assigned a differentially activated enhancer by GREAT.
Figure 4.
Figure 4.. Functional annotation of cardiac phenotype associated variants and enrichment of embryonic heart enhancers in cardiac relevant long-range chromatin interactions.
A. UCSC browser shot of NKX2.5 gene locus showing individual embryo chromatin state annotations from this study and Roadmap Epigenome. Samples are ordered from top to bottom based on developmental age, earliest to latest. Chromatin states are indicated by color segments using color convention from Figure 1C. Strong human embryonic heart (HEH) enhancers are shown in black and superenhancers and superenhancers unique to HEH are shown in orange. B. UCSC browser shot of locus near the TBX20 gene using the same conventions as in A. The region upstream of the TBX20 gene is a human embryonic heart specific super enhancer (orange bar). Of note are the strong HEH specific enhancer states track, as well as the experimentally validated enhancer elements with images to the right. In the lower panel, all the roadmap epigenome ChromHMM segmentations are stacked showing the region is not similarly active in any other profiled tissue. C. Box plots of fold enrichment of overlap of each indicated chromatin state in human embryonic heart or brain with anchor points identified by capture Hi-C interactions in iPSC-derived cardiomyocytes over matched randomly selected segments. Solid boxes represent embryonic heart chromatin segments while dotted boxes represent adult brain chromatin segments. Significance of difference between embryonic heart and adult brain fold enrichments were calculated using the Mann-Whitney test and is shown at top (p-value ≤ 0.05 = *, ≤ 0.01= **, ≤ 0.001= *** , ≤ 0.0001 = ****). The largest increases in fold enrichments for embryonic heart were identified for strong enhancer states 13 and 14.
Figure 5.
Figure 5.. Enrichment of cardiac phenotype associated variants in embryonic heart enhancer segments.
A. Scatterplot of the log2 fold enrichment and log10 Bonferroni adjusted significance level of GWAS variants associated with systolic blood pressue in all enhancers segments identified in the strong enhancer states for each embryonic heart sample (bright red), the total reproducible strong enhancers from the whole dataset (dark red) or other tissues in Roadmap Epigenome (blue). All values calculated using only variants with p values < 5×10⁻⁸ from GWAS Catalog using GREGOR. B. Same as in A using GWAS variants associated with electrocardiograph traits and measures. C. Same as in A using GWAS variants associated with resting heart rate. D. Same as in A using GWAS variants associated with QRS complex traits. E. Enrichment of GWAS analysis p-values for atrial fibrillation in all chromatin state annotations as determined by GARFIELD. Scatterplot of the odds ratio of atrial fibrillation GWAS SNPS using the 1E–8 Threshold by the log10 GARFIELD Bonferroni adjusted p-values. Samples from this study (triangle symbol) and Roadmap epigenome (star symbol) are colored by chromatin state as indicated by the color key. Atrial fibrillation shows greatest enrichment in strong enhancers identified in embryonic heart tissues. F. Same as in E using GWAS summary statistics for systemic lupus erythematosus. Lupus shows greatest enrichment in strong enhancers identified in immune cell types sorted from blood. Lupus also shows enrichment in repressed and bivalent states in human embryonic heart.
Figure 6.
Figure 6.. Transcriptional profiling of embryonic heart development.
A. Heatmap showing specificity of expression for 5,167 genes identified with elevated Gini scores (>0.5) for 25 tissues from GTEx and embryonic heart. Brain, spleen, and embryonic heart specific genes are identified as colored leaves on the dendrogram along the left of the plot. B. Gene ontology enrichments for genes identified as specific for heart, spleen, and embryonic heart respectively based on genes from indicated color coded clusters in A. C. Heatmap of z-scores of normalized gene expression for genes identified as differentially expressed in pairwise comparisons of replicates from each of Carnegie Stage in our developmental series. Dendrogram on the left is hierarchical clustering of genes across a developmental series. The genes were color coded by cutting the dendrogram at a height which would result in four groups. Purple most highly expressed early. Pink and green expressed most strongly in intermediate stages of the series. Blue genes are most strongly expressed at the end of the developmental series. D. Gene ontology enrichment maps from the purple (left) and blue (right) gene sets identified in C. The size of each dot represents the number of genes and the color scale represents the -log2 transformed Benjamini & Hochberg adjusted p-value of each ontology. Darker colors indicate higher significance. The edges connect overlapping gene sets. The location of each dot is determined by the overlap ratio (OvR) calculated by enrichplot. Genes active early are enriched for functions related to embryonic patterning and morphogenesis while genes active late in embryonic heart development are enriched for vasculature development and ion-channel function.
Figure 7.
Figure 7.. Integration of chromatin state and gene expression identifies genes important for human cardiac development.
A. Plot of gene expression values from embryonic heart (red), adult heart (purple), brain (green) or all other tissues (grey) for genes assigned indicated number of EHEs as determined by GREAT. Genes assigned multiple EHEs are more strongly expressed in embryonic heart than other tissues. Significant differences in distributions of gene expression values in each comparison were determined based on Mann-Whitney test. B. Histogram of distances of EHEs (red) or randomly selected sets of enhancers (grey) to the nearest heart specific gene (GINI > 0.75) in 10 kb bins up to 100 kb. Overall EHEs are enriched near heart specific genes over all distances up to 100 kb. Error bars indicate standard deviation of 1000 random permutations of enhancers. C. Network plot of gene modules identified by WGCNA using embryonic heart gene expression data. A pearson correlation of the module eigenvectors was calculated for the edges. Positive correlations of 0.5 and greater were included. The location of each module is determined by multiple dimensional scaling of the module eigengene vectors. Modules are color coded based on names assigned by WGCNA. Size of dots indicate number of genes in each module. Each module is labelled based on the most significant biological process category gene ontology enrichment determined by DAVID, however this label is not always all encompassing. See Online Table VIII for exhaustive list. Modules are grouped based on related functional category enrichments and distance in MDS space. D. Trajectories of expression based on eigenvectors reported by WGCNA for each module across the developmental series. Groups and color coding are the same as in C. Group 1 modules have generally declining expression and include many genes involved in developmental patterning. Group 3 modules generally have increasing expression. Groups 2 and 4 have multiphasic but offset expression and contain genes involved in chromatin regulation and muscle cell differentiation and function.
Figure 8.
Figure 8.. WGCNA significance tests and network for violet module.
A. Dot plots of gene enrichment within the WGCNA modules. The lists of genes used are curated from multiple sources, while EHE and GINI are from this paper. The groups correspond to Figure 5. B. Network of multidimensional scaling coordinates and pairwise correlation scores for the violet module in Group 4 in D which is enlarged to show detail. All genes with correlation value greater than 0.88 with any other gene are plotted. Size of shape indicates highly connected hub genes. Diamonds represent genes assigned EHEs. Purple filled shapes indicate heart specific gene expression (GINI >= 0.5). Hub genes are labeled with gene symbol. Genes directly positively regulated by NKX2–5 binding are indicated with yellow. Several hub genes that have all these criteria are listed in larger yellow text. C. Histogram of LOEUF deciles of hub genes or randomly selected non-hub genes from all modules in the WGCNA network. Deciles range from decile 1 (d1) which represent the most constrained genes to d10, genes that are the most tolerant to putative loss-of-function (pLoF) variation. Error bars indicate standard deviation of 1000 random permutations of non-hub genes. D. Histogram of the number of gene-scrambled modules that have ppi enrichment at a Bonferroni adjusted p-value of <0.05. The vertical orange line marks the 15 modules that have significant ppi in the actual WGCNA network.

Comment in

  • Super Enhancers: Enhancing Human Cardiogenesis.
    Cashman TJ, Trivedi CM. Cashman TJ, et al. Circ Res. 2020 Oct 9;127(9):1156-1158. doi: 10.1161/CIRCRESAHA.120.318000. Epub 2020 Oct 8. Circ Res. 2020. PMID: 33031028 Free PMC article. No abstract available.

References

    1. Van Der Linde D, Konings EEM, Slager MA, Witsenburg M, Helbing WA, Takkenberg JJM, Roos-Hesselink JW. Birth prevalence of congenital heart disease worldwide: A systematic review and meta-analysis. J. Am. Coll. Cardiol 2011;58:2241–2247. - PubMed
    1. Liu Y, Chen S, Zühlke L, Black GC, Choy M-K, Li N, Keavney BD. Global birth prevalence of congenital heart defects 1970–2017: updated systematic review and meta-analysis of 260 studies. Int J Epidemiol [Internet]. 2019. [cited 2019 Nov 15];48:455–463. Available from: http://www.ncbi.nlm.nih.gov/pubmed/30783674 - PMC - PubMed
    1. Centers for Disease Control and Prevention (CDC). Racial differences by gestational age in neonatal deaths attributable to congenital heart defects --- United States, 2003–2006. MMWR Morb Mortal Wkly Rep [Internet]. 2010. [cited 2019 Nov 15];59:1208–11. Available from: http://www.ncbi.nlm.nih.gov/pubmed/20864921 - PubMed
    1. Cowan JR, Ware SM. Genetics and Genetic Testing in Congenital Heart Disease. Clin. Perinatol 2015;42:373–393. - PubMed
    1. Zaidi S, Brueckner M. Genetics and Genomics of Congenital Heart Disease. Circ. Res 2017;120:923–940. - PMC - PubMed

Publication types