. 2020 Aug 9;8(1):116.
doi: 10.1186/s40168-020-00889-8.

Influence of the polar light cycle on seasonal dynamics of an Antarctic lake microbial community

Affiliations

Influence of the polar light cycle on seasonal dynamics of an Antarctic lake microbial community

Pratibha Panwar et al. Microbiome. .

Abstract

Background: Cold environments dominate the Earth's biosphere and microbial activity drives ecosystem processes thereby contributing greatly to global biogeochemical cycles. Polar environments differ to all other cold environments by experiencing 24-h sunlight in summer and no sunlight in winter. The Vestfold Hills in East Antarctica contains hundreds of lakes that have evolved from a marine origin only 3000-7000 years ago. Ace Lake is a meromictic (stratified) lake from this region that has been intensively studied since the 1970s. Here, a total of 120 metagenomes representing a seasonal cycle and four summers spanning a 10-year period were analyzed to determine the effects of the polar light cycle on microbial-driven nutrient cycles.

Results: The lake system is characterized by complex sulfur and hydrogen cycling, especially in the anoxic layers, with multiple mechanisms for the breakdown of biopolymers present throughout the water column. The two most abundant taxa are phototrophs (green sulfur bacteria and cyanobacteria) that are highly influenced by the seasonal availability of sunlight. The extent of the Chlorobium biomass thriving at the interface in summer was captured in underwater video footage. The Chlorobium abundance dropped from up to 83% in summer to 6% in winter and 1% in spring, before rebounding to high levels. Predicted Chlorobium viruses and cyanophage were also abundant, but their levels did not negatively correlate with their hosts.

Conclusion: Over-wintering expeditions in Antarctica are logistically challenging, meaning insight into winter processes has been inferred from limited data. Here, we found that in contrast to chemolithoautotrophic carbon fixation potential of Southern Ocean Thaumarchaeota, this marine-derived lake evolved a reliance on photosynthesis. While viruses associated with phototrophs also have high seasonal abundance, the negative impact of viral infection on host growth appeared to be limited. The microbial community as a whole appears to have developed a capacity to generate biomass and remineralize nutrients, sufficient to sustain itself between two rounds of sunlight-driven summer-activity. In addition, this unique metagenome dataset provides considerable opportunity for future interrogation of eukaryotes and their viruses, abundant uncharacterized taxa (i.e. dark matter), and for testing hypotheses about endemic species in polar aquatic ecosystems. Video Abstract.

Keywords: Antarctic microbiology; Green sulfur bacteria; Host-virus interactions; Meromictic lake; Metagenome time series; Microbial food web; Phototroph; Polar light cycle.


Conflict of interest statement

The authors declare that they have no competing interests.

Figures

Fig. 1
Fig. 1
Location of Ace Lake, Antarctica, sampled for metagenomics. View of the Earth showing Antarctica with an inset satellite image of the Vestfold Hills, aerial image of Ace Lake, and underwater image of the top of the green sulfur bacteria layer at the Ace Lake interface. Credit to Google Earth (Image Landsat/Copernicus; Image US Geological Survey; US Dept. of State Geographer; Data SIO, NOAA, US Navy, NGA, GEBCO). Credit to the Landsat Image Mosaic of Antarctica—the map was produced by the Australian Antarctic Data Centre. Photo credits: Rick Cavicchioli (Ace Lake aerial photograph; underwater image of the lake interface)
Fig. 2
Fig. 2
Environmental factors affecting species abundance in Ace Lake. dbRDA ordination plot showing the relationship between species abundance variations and changes in season and lake depth. The x-axis (dbRDA1) explains 77% of the fitted and 21% of the total variation. The y-axis (dbRDA2) explains 13% of the fitted and 4% of the total variation. The data points representing the three filter fractions from each depth and time point, overlap in the plot thereby reducing the 120 metagenomes to 40 data points (i.e. each data point represents the three filter fractions for a specific sampling date and depth). Included are vector overlays showing the contribution of lake depth (depth), salinity (salinity), monthly average day length (daylength), monthly average sunlight hours (sunlight), and monthly average air temperature (temperature) to variance. The season-based variations are highlighted by grouping samples from: December (white circle), January (white square), and February (white triangle) as summer (red shading); July (black triangle) and August (black square) as winter (blue shading); and October (grey circle) and November (grey triangle) as spring (green shading). The depth-based variations are highlighted by grouping samples from upper 1, 2, and 3 as Upper (thick dotted line); interface as Interface (solid line); and lower 1, 2, and 3 as Lower (thin dotted line)
Fig. 3
Fig. 3
Seasonal changes in alpha diversity in Ace Lake. Line graph depicting Simpson’s index of diversity (alpha diversity) for the 120 metagenomes obtained from the three filter fractions (20–3 μm, dark blue line; 3–0.8 μm, pink line; 0.8–0.1 μm, light blue line) collected between 2006 and 2015 during summer (red shading), winter (blue shading), or spring (green shading). The data on the x-axis are arranged (from left to right) depth-wise from the upper to lower zone. The boxed area at the top of the figure provides an expanded view of the alpha diversity occurring between 0.9 and 1.0. Depths: U1, upper 1; U2, upper 2; U3, upper 3; I, interface; L1, lower 1; L2, lower 2; L3, lower 3 (see Additional file 1: Table S1 for specific information about sampled depths)
Fig. 4
Fig. 4
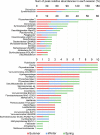
Seasonal influence on the peak relative abundance of major taxa in Ace Lake. Stacked bar graph depicting the sum of peak relative abundances from each season for abundant OTUs (those with ≥ 1% relative abundance). Note, as the peak relative abundance is shown for each season for each OTU, the bar (which represents the sum of those abundances) exceeds 100% for Chlorobium and Synechococcus. To aid the visualization of the wide range of OTU relative abundance values, the graph has been segregated into three parts with the abundance scale redrawn, and OTUs are arranged in descending order of total abundance; total abundance is the sum of the coverages (contig read depth × contig length) of the contigs of an OTU
Fig. 5
Fig. 5
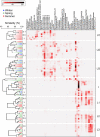
Depth distribution of the major taxa in Ace Lake. Heat map depicting the relative abundance of the most abundant OTUs by depth (right-hand y-axis, U1 to L3), by season (left-hand y-axis: summer, red; winter, blue; spring, green) and by filter size (left-hand y-axis: 3, 0.8, and 0.1 μm). The relative abundances of OTUs in each of the 120 metagenomes are in Additional file 1: Dataset S1. OTUs are arranged by depth from the upper to lower zones (left-to-right x-axis). A group-average cluster based on the Bray-Curtis percent similarities between the square root-transformed OTU relative abundances has been overlaid (left-hand y-axis). The cluster analysis shows the extent to which overall OTU relative abundance is influenced by size fraction, season, and depth. The gradient bar shows the colour scale in percentage used for the relative abundance of the OTUs. Filter sizes: 3, 20–3 μm; 0.8, 3–0.8 μm; 0.1, 0.8–0.1 μm; Depths: U1, upper 1; U2, upper 2; U3, upper 3; I, interface; L1, lower 1; L2, lower 2; L3, lower 3 (see Additional file 2: Table S1 for specific information about sampled depths). The upper zone had high, peak relative abundance of Alphaproteobacteria (30%), Actinobacteria (20%), Chlorophyta (20%), Verrucomicrobia (16%), and Betaproteobacteria (15%), plus a variety of dsDNA viruses (36%), whereas the abundant members of the lower zone were Deltaproteobacteria (39%), Cloacimonetes (16%), Atribacteria (15%), Firmicutes (6%), Omnitrophica (5%), Euryarchaeota (5%), Chloroflexi (4%), Tenericutes (4%), and Acetothermia (3%). At the interface, Chlorobi (84%) and Deltaproteobacteria (39%) were abundant. Some taxa, such as Bacteroidetes (U, 37%; I, 18%; L, 13%), Planctomycetes (U, 10%; I, 6%; L, 4%), Parcubacteria (U, 9%; I, 7%; L, 11%), and Gammaproteobacteria (U, 29%; I, 4%; L, 3%) were represented throughout the lake. The major taxonomic groups were represented by specific genera or species; for example, Alphaproteobacteria consisted of Loktanella, Nisaea, Pelagibacter, and Yoonia (Additional file 1: Table S8)
Fig. 6
Fig. 6
Ace Lake rhodopsins. a Unrooted maximum-likelihood tree of Ace Lake and reference rhodopsin sequences. All Ace lake sequences fell within the shaded area. *Nostoc sp. sensory rhodopsin Q8YSC4; ^Nanosalina sp. J07AB43 xenorhodopsin EGQ43296. Rhodopsin types are labelled with short-hand names (e.g. ‘proteo’ for proteorhodopsin). b Expanded view of the shaded region of the tree, rooted using the sensory rhodopsins. Ace lake sequences (taxon and IMG locus tag); reference sequences (bold font). Bootstrap values over 50% are reported
Fig. 7
Fig. 7
Temporal and seasonal abundance of viruses in Ace Lake. Stacked bar graph depicting the relative abundance of viruses. The data on the x-axis are sampling date and depth (U1, upper 1; U2, upper 2; U3, upper 3; I, interface; L1, lower 1; L2, lower 2; L3, lower 3). Each depth contains three bars which represent from left to right, 20–3, 3–0.8, and 0.8–0.1 μm filter fractions (see Additional file 1: Table S1 for specific information about sampled depths). The sampling periods represent summer (Dec. 2006, Dec. 2013, Feb. 2014, Dec. 2014, and Jan. 2015; only Upper 1 was sampled in Dec. 2013, Feb. 2014, and on 8th and 27th Jan. 2015), winter (Jul. 2014 and Aug. 2014), and spring (Nov. 2008, Nov. 2013, and Oct. 2014). The data on the y-axis represent the sum of the relative abundances (%) of the virus OTUs, classified as dsDNA (orange bar) or Other viruses (blue bar). The Other viruses are unclassified viruses identified in IMG plus Unassigned contigs that were confidently predicted by VirSorter as viruses (category 1 and 2) and prophages (category 4 and 5); note that the metagenome data do not represent ssDNA or RNA viruses
Fig. 8
Fig. 8
Association between the abundance of Chlorobium and the abundance of its potential viruses. Line graph depicting the contig read depth of Chlorobium (black line) and the expanded CL1024 cluster (green circle), expanded SG14554 singleton (yellow triangle), CL248 (orange diamond), and CL400 (grey square) in the metagenomes from the three filter fractions (3, 0.8, and 0.1 μm) from the interface (I) and neighbouring depths (upper 3, U3; lower 1, L1). The metagenomes represent summer (Dec. 2006 and Dec. 2014), winter (Jul. 2014 and Aug. 2014; L1 was not sampled in winter), and spring (Nov. 2008, Nov. 2013, and Oct. 2014). Filter sizes: 3, 20–3 μm; 0.8, 3–0.8 μm; 0.1, 0.8–0.1 μm
Fig. 9
Fig. 9
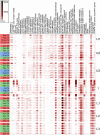
The abundance of specific enzymes or pathways involved in energy conservation and metabolism in Ace Lake. Heat map depicting the normalized abundance of specific enzymes or pathways (x-axis) by season (left-hand y-axis: summer, red; winter, blue; spring, green) and by depth (right-hand y-axis: U1 to L3). Each sampling date (left-hand y-axis) displays abundances for each of the three filter fractions: top, 20–3 μm; middle, 3–0.8 μm; bottom, 0.8–0.1 μm. The gradient bar shows the colour scale used for the normalized abundance of the enzyme or pathway. Depths: U1, upper 1; U2, upper 2; U3, upper 3; I, interface; L1, lower 1; L2, lower 2; L3, lower 3 (see Additional file 1: Table S1 for specific information about sampled depths). BCAA ABC transporter, branched-chain amino acid ATP-binding cassette transporter; Cas, CRISPR-associated; CBB cycle, Calvin-Benson-Bassham cycle; CRISPR, clustered regularly interspaced short palindromic repeats; DMSP, dimethylsulfoniopropionate; DNRA, dissimilatory nitrate reduction to ammonium; PHA, polyhydroxyalkanoate; reverse TCA cycle, reverse tricarboxylic acid cycle; SOX system, sulfur-oxidizing system; TMA, trimethylamine; Type 1 RC core complex (GSB), Type 1 reaction centre core complex (green sulfur bacteria)
Fig. 10
Fig. 10
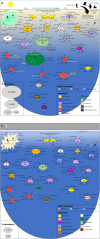
Seasonal nutrient cycles in Ace Lake. Nutrient cycling processes depicted for the most abundant Ace Lake bacteria and archaea occurring in summer (a) and winter (b). The nutrient cycles for each season integrate data for taxa peak relative abundance (Figs. 4 and 5; Additional file 1: Dataset S1) and functional potential (Fig. 9; Additional file 1: Table S5-S7), highlighting in particular changes in light-driven processes in the upper zone and interface. Also shown are seasonal differences in ice cover and sunlight penetration (yellow-blue gradient); inputs from algae and exogenous sources; and the peak relative abundances of the major OTUs that contribute to the nutrient cycles (ellipse size). Chlorobium marks the interface between the upper and lower zones. Winter (b) does not include the lower, anoxic zone as it was not sampled during winter. 34-128, Atribacteria 34-128; Arctic95D-9, Verrucomicrobia Arctic95D-9; BACL24, Verrucomicrobia BACL24; BACL25, Microbacteriaceae BACL25; Desulfobac., Desulfobacterium; Desulfocap., Desulfocapsa; JGIOTU-2, Cloacimonetes JGIOTU-2; HTCC2207, Porticoccaceae HTCC2207; MAG-120531, Flavobacteriaceae MAG-120531; Meth. A, Methanothrix_A; MOLA814, Burkholderiaceae MOLA814; NaphS2, Desulfatiglanales NaphS2; S5133MH16, Desulfobacterales S5133MH16; SCGC, Burkholderiaceae SCGC-AAA027-K21; SW10, Verrucomicrobia SW10; UBA2210, Syntrophales UBA2210; UBA2664, Balneolaceae UBA2664; UBA4459, Bacteroidales UBA4459; UBA4506, Verrucomicrobia UBA4506; DHPS, 2,3-dihydroxypropane-1-sulfonate; DMSP, dimethylsulfoniopropionate. Image credits: Animal and plant silhouettes are courtesy of PhyloPic [42]

Similar articles

Cited by

References

    1. Margesin R, Miteva V. Diversity and ecology of psychrophilic microorganisms. Res Microbiol. 2011;162:346–361. - PubMed
    1. Cavicchioli R. Microbial ecology of Antarctic aquatic systems. Nat Rev Microbiol. 2015;13:691–706. - PubMed
    1. Cavicchioli R. A vision for a 'microbcentric' future. Microb Biotechnol. 2019;12:26–29. - PMC - PubMed
    1. Cary SC, McDonald IR, Barrett JE, Cowan DA. On the rocks: the microbiology of Antarctic Dry Valley soils. Nat Rev Microbiol. 2010;8:129–138. - PubMed
    1. Rankin LM, Gibson JAE, Franzrnann PD, Burton HR. The chemical stratification and microbial communities of Ace Lake, Antarctica: a review of the characteristics of a marine-derived meromictic lake. Polarforschung. 1999;66:33–52.

Publication types