. 2020 Aug 10;19(1):123.
doi: 10.1186/s12943-020-01239-w.

ALKBH5 suppresses malignancy of hepatocellular carcinoma via m6A-guided epigenetic inhibition of LYPD1

Affiliations

ALKBH5 suppresses malignancy of hepatocellular carcinoma via m6A-guided epigenetic inhibition of LYPD1

Yunhao Chen et al. Mol Cancer. .

Abstract

Background: N6-methyladenosine (m6A) modification is an emerging layer of epigenetic regulation which is widely implicated in the tumorigenicity of hepatocellular carcinoma (HCC), offering a novel perspective for investigating molecular pathogenesis of this disease. The role of AlkB homolog 5 (ALKBH5), one of the m6A demethylases, has not been fully explored in HCC. Here we clarify the biological profile and potential mechanisms of ALKBH5 in HCC.

Methods: Expression of ALKBH5 and its correlation with clinicopathological characteristics of HCC were evaluated using tissue microarrays and online datasets. And biological effects of ALKBH5 in HCC were determined in vitro and in vivo. Subsequently, methylated RNA immunoprecipitation sequencing (MeRIP-seq) combined with RNA sequencing (RNA-seq), and following m6A dot blot, MeRIP-qPCR, RIP-qPCR or dual luciferase reporter assays were employed to screen and validate the candidate targets of ALKBH5.

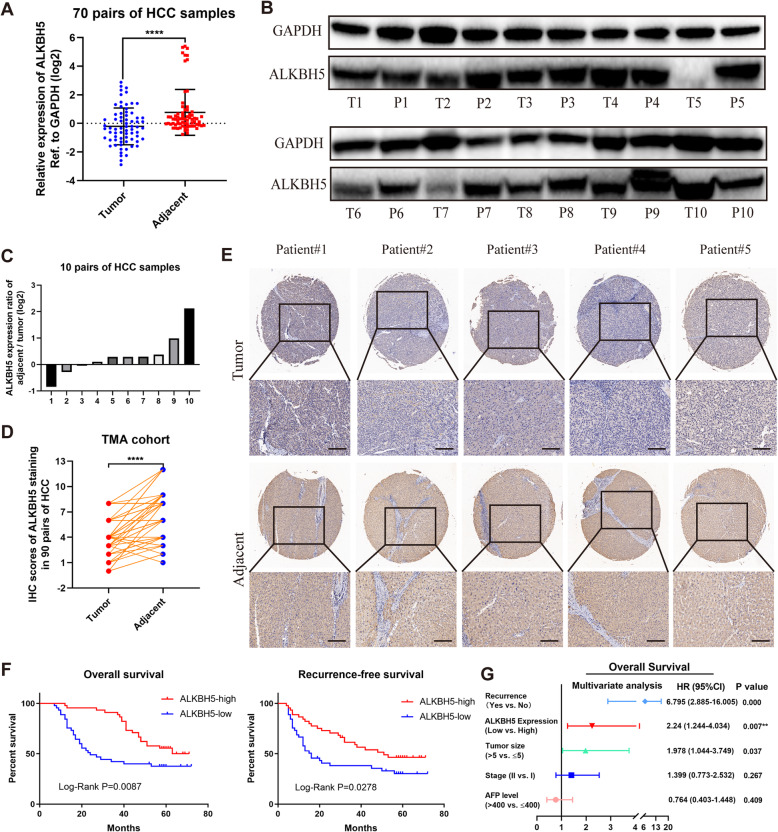
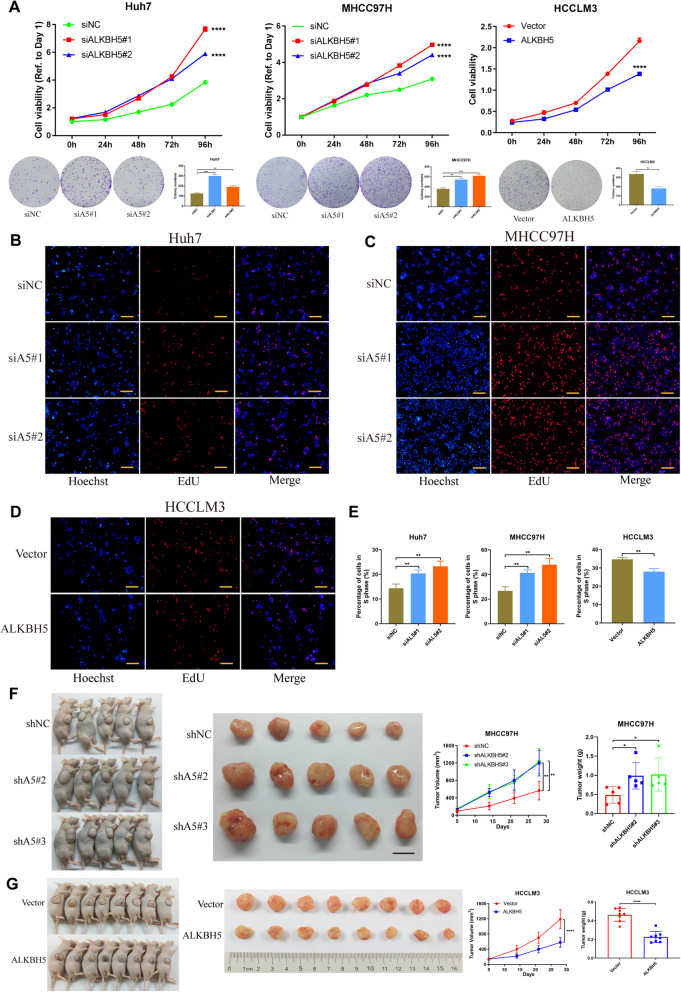
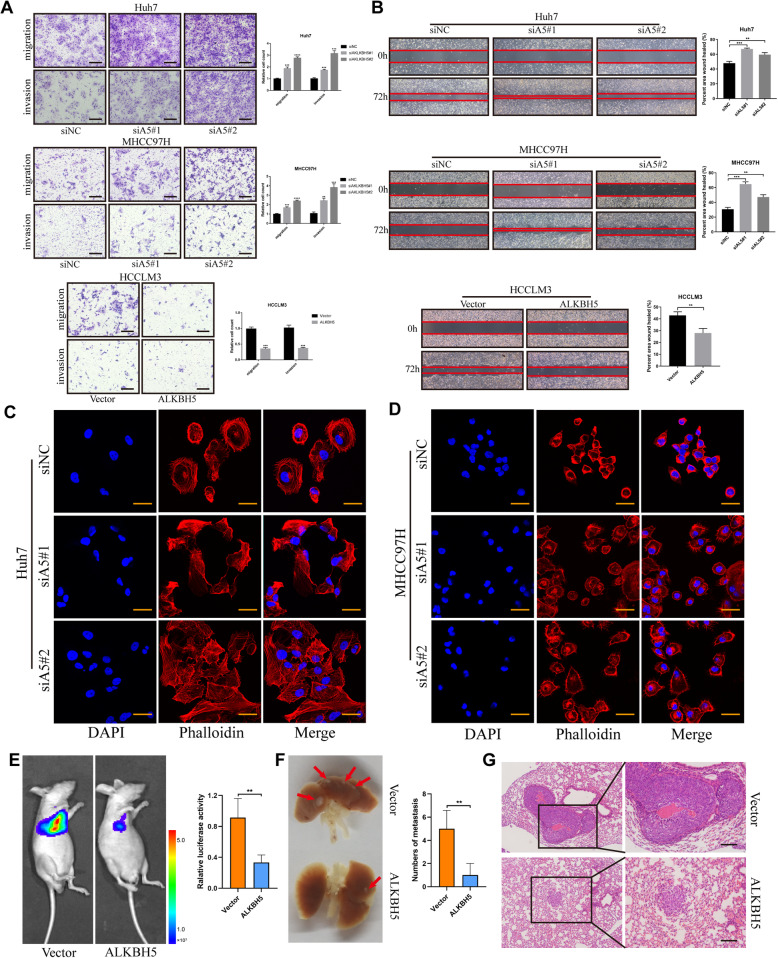
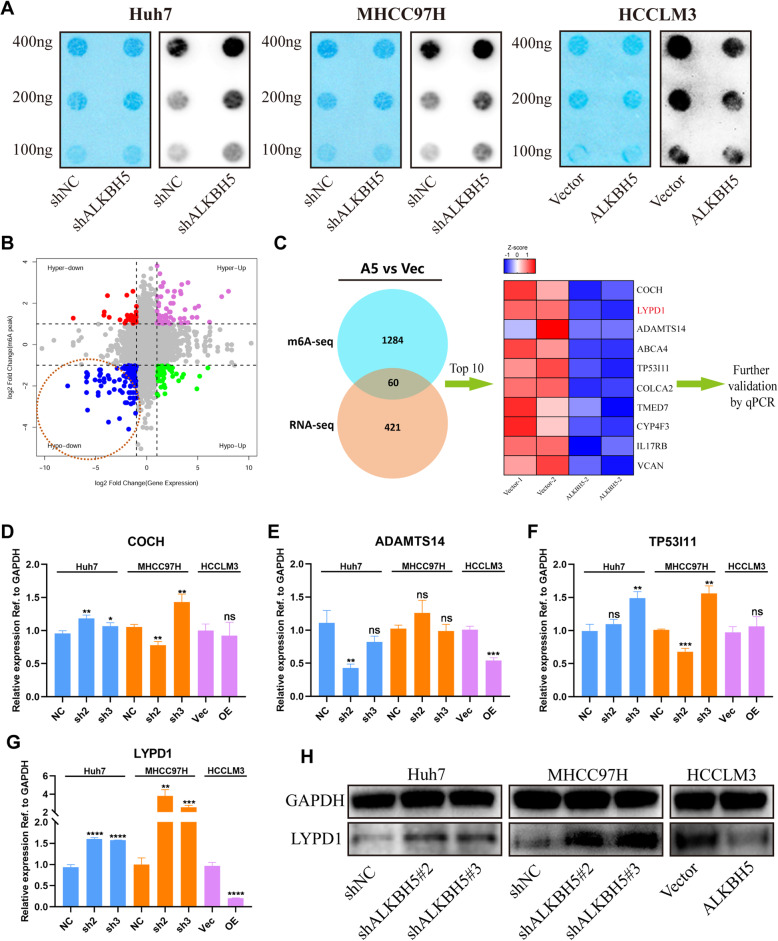
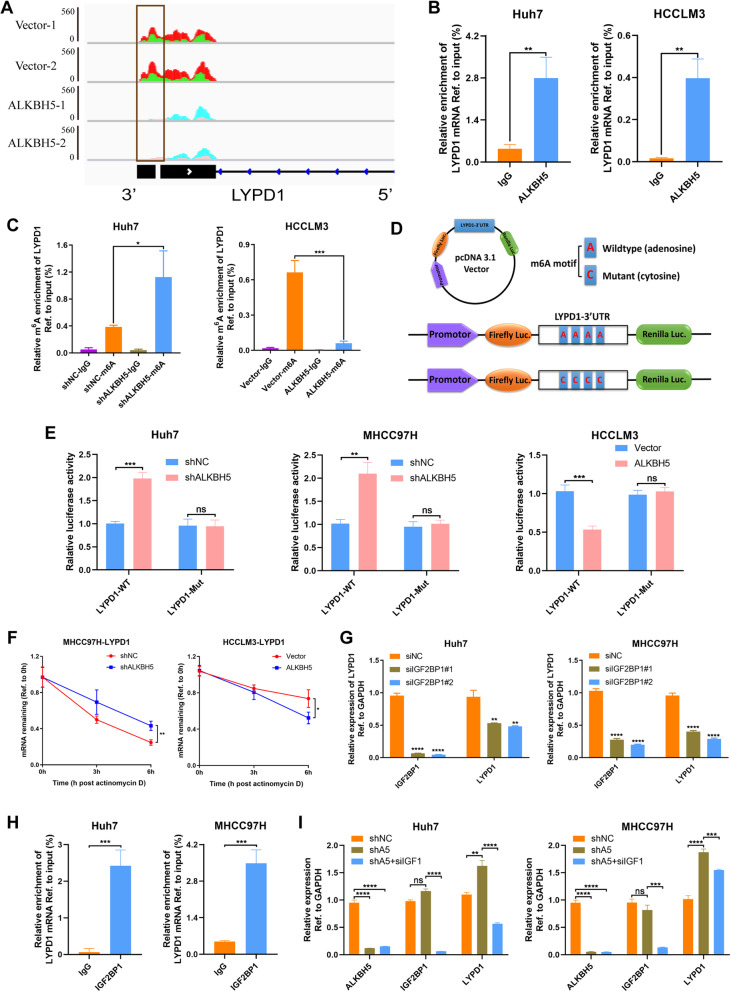
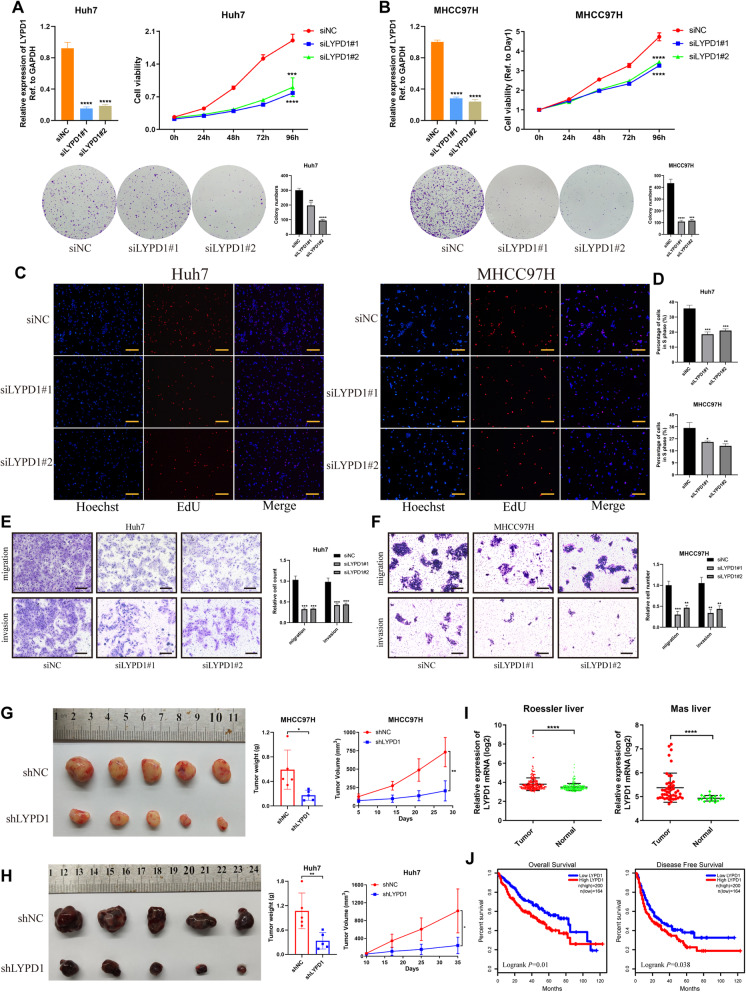
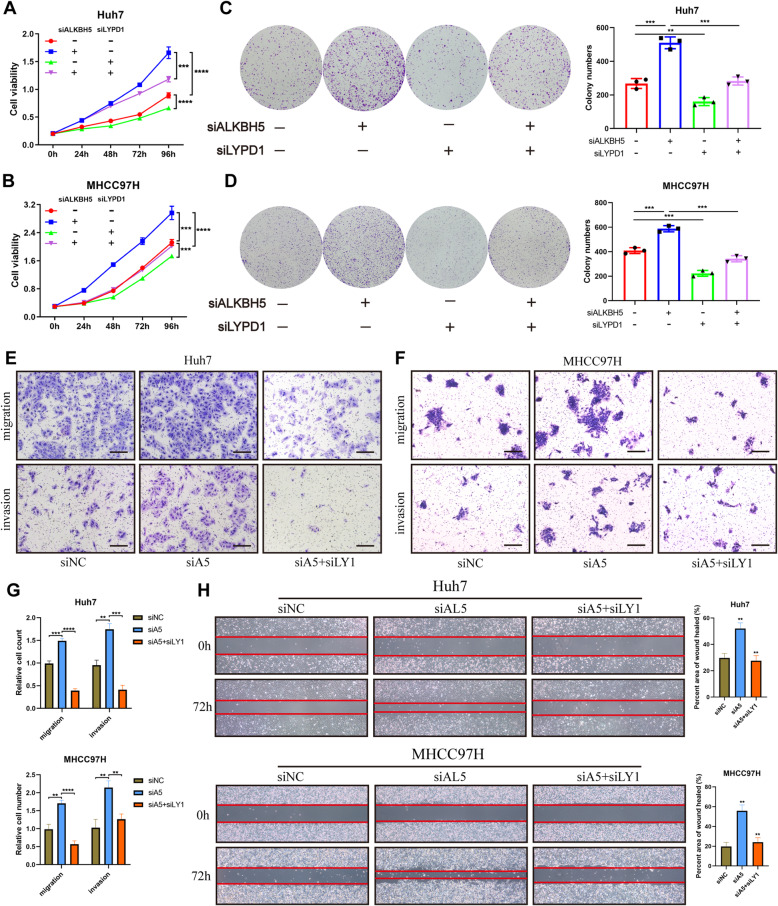
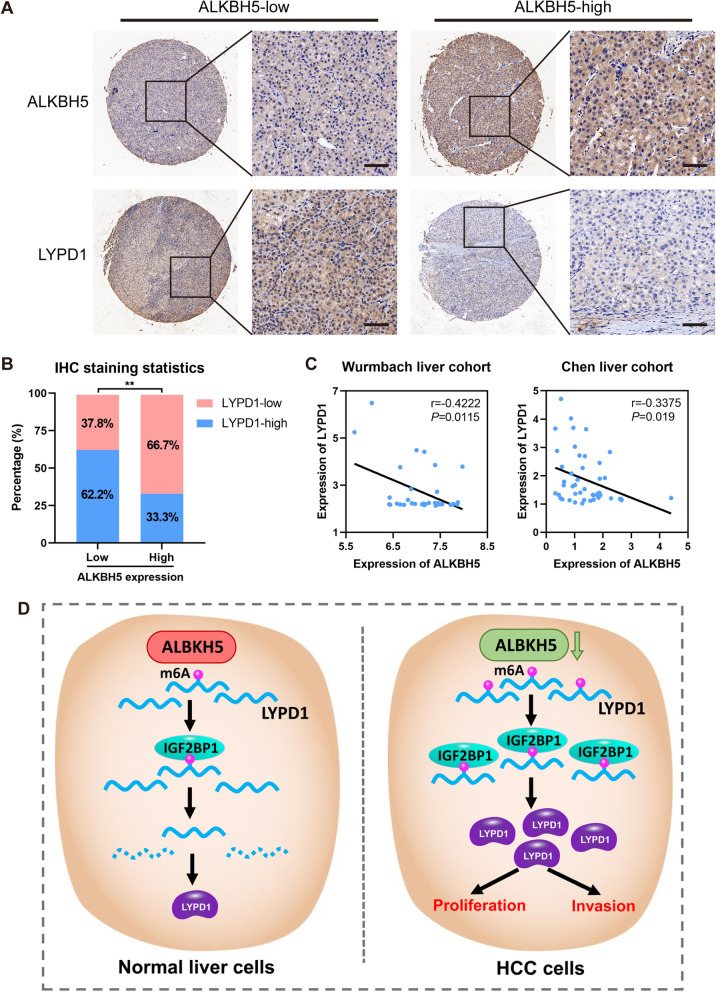
Results: We demonstrated that ALKBH5 was down-regulated in HCC, and decreased ALKBH5 expression was an independent prognostic factor of worse survival in HCC patients. Functionally, ALKBH5 suppressed the proliferation and invasion capabilities of HCC cells in vitro and in vivo. Mechanistically, ALKBH5-mediated m6A demethylation led to a post-transcriptional inhibition of LY6/PLAUR Domain Containing 1 (LYPD1), which could be recognized and stabilized by the m6A effector IGF2BP1. In addition, we identified that LYPD1 induced oncogenic behaviors of tumors in contrast to ALKBH5. Dysregulation of ALKBH5/LYPD1 axis impelled the progression of HCC.

Conclusion: Our study reveals that ALKBH5, characterized as a tumor suppressor, attenuates the expression of LYPD1 via an m6A-dependent manner in HCC cells. Our findings enrich the landscape of m6A-modulated tumor malignancy, and provide new insights into potential biomarkers and therapeutic targets of HCC treatment.

Keywords: ALKBH5; Hepatocellular carcinoma (HCC); LYPD1; N6-methyladenosine (m6A).


Conflict of interest statement

The authors declare no competing interests.

Figures

Fig. 1
Fig. 1
Down-regulated ALKBH5 expression correlates with poor outcomes of HCC patients. a The mRNA expression of ALKBH5 in tumor and normal tissues was measured based on 70 pairs of HCC samples (from cohort one); b Ten pairs of HCC samples (from cohort one) were subject to western blotting analysis of ALKBH5; c Grayscale analysis of ALKBH5 expression in b was conducted (calculated by log2 ratio of “adjacent/tumor pair”, normalized to GAPDH); d IHC scores of matched HCC and normal tissues (n = 90) were computed based on ALKBH5 staining (cohort two); e Representative images of ALKBH5 IHC staining in HCC samples were shown (scale bars, 100 μm; magnification, 100× and 200×); f Kaplan-Meier analysis of overall survival (left) and recurrence-free survival (right) of HCC patients based on ALKBH5 expression (n = 90). Cutoffs for grouping were determined by the median of IHC scores; g Multivariate analysis was employed for HCC patients using COX regression model based on those factors which were statistically significant in univariate analysis. Symbols and bars in forest plots correspond to HR and 95% CIs, respectively. T: tumor; P: para-tumor; HR: hazard rate; CI: confidence interval
Fig. 2
Fig. 2
Inhibition of ALKBH5 drives HCC tumorigenesis. a CCK-8 and colony formation assays were applied to evaluate proliferation abilities of three HCC cell lines with knockdown or overexpression of ALKBH5. And histograms presented the colony numbers of each group; b, c, d and e EdU assays were conducted in three HCC cells to compare the percentage of cells in S phase (scale bars, 200 μm). Hoechst staining detected total cells, while EdU staining represented cells with active DNA replication. Representative images (b-d) and quantification data (e) were shown; f and g Tumor xenograft models were constructed with stable ALKBH5-knockdown (f, n = 5) or ALKBH5-overexpressing (g, n = 8) HCC cells and corresponding negative control cells (scale bar in f, 1 cm). Tumor sizes were recorded consecutively to establish tumor growth curves. Then tumors were collected from sacrificed mice and tumor weights were measured
Fig. 3
Fig. 3
ALKBH5 abolishes migration/invasion capabilities of HCC cells in vitro and inhibits metastasis in vivo. a Transwell assays of Huh7, MHCC97H and HCCLM3 were applied to measure their migration and invasion abilities (scale bars, 200 μm). Bar charts showed the relative count (refer to negative control group) of cells which passed through the chamber membrane in each group (right); b Wound healing assays were conducted to compare the migration capabilities of three HCC cells after silencing or overexpression of ALKBH5. The difference in cell margin between 0 h and 72 h showed the moving track of cells; The percentage of healed area was quantified (right); c and d Alterations of cytoskeleton represented with immunofluorescent imaging were detected under the knockdown of ALKBH5 in Huh7 (c) and MHCC97H (d) cells. Phalloidin (red color) was applied for cytoskeleton staining, while DAPI (blue color) was used to mark the nuclei (scale bars, 30 μm). A divergent pattern of cytoskeleton with slenderer microtubules or microfilaments and more pseudopodia indicated a more flexible migrating style of cells; e, f and g HCCLM3 cells transfected with ALKBH5-overexpressing or control vector lentiviruses were injected into mice via tail vain to establish pulmonary metastasis models (n = 5). Representative in vivo images of mice were taken with quantification of luciferase activity in the lung region (e). Metastatic tumor foci in lungs were photographed and quantified (f), and their presence was further confirmed by HE staining (g) (scale bars, 100 μm)
Fig. 4
Fig. 4
LYPD1 is identified as the candidate target of ALKBH5. a Global m6A level of RNA extracted from ALKBH5-knockdown or -overexpressing HCC cells was measured via m6A dot blot assays. RNAs were serially diluted and loaded equally with the amount of 400 ng, 200 ng and 100 ng. And methylene blue staining (left) was used to detect input RNA, while the intensity of dot immunobloting (right) represented the level of m6A modification. b The starplot showed the distribution of genes with both differential (hyper or hypo) m6A peaks (Y axis; fold change > 1.5 or < 2/3, P < 0.05) and differential (up or down) expression (X axis; fold change > 2 or < 0.5, P < 0.05) in ALKBH5-overexpressing group compared with control group. The blue dots highlighted by a circle represented down-regulated transcripts with the reduced abundance of m6A upon overexpression of ALKBH5, which were selected for the following investigations. c A schematic diagram showed the screening criterion for ALKBH5 targets. Results of MeRIP-seq (blue circle) and RNA-seq (brown circle) were combined using the Venn diagram. The overlap contained 60 transcripts which were influenced by ALKBH5 in both m6A content and expression. And the prescreening was based on expression level. The top 10 differentially expressed genes showed in the heat map (red indicated up-regulation and blue indicated down-regulation) were subject to following validation using qPCR. d, e, f and g RNA level of COCH (d), ADAMTS14 (e), TP53I11 (f) and LYPD1 (g) were examined in ALKBH5-silenced or -overexpressing cells, respectively. Those genes which were consistently validated in all three HCC cell lines were subject to further studies; h Protein level of LYPD1 was measured in ALKBH5-silenced Huh7 and MHCC97H cells or ALKBH5-overexpressing HCCLM3 cells
Fig. 5
Fig. 5
ALKBH5 impairs the stability of LYPD1 mRNA via an IGF2BP1-m6A-dependent pattern. a m6A abundance on LYPD1 mRNA in negative control or ALKBH5-overexpressing HCCLM3 cells was plotted by the IGV. Green and pink colors show the m6A signals of input samples, while red and blue stand for signals of IP samples. The range of signals in all groups was normalized to a 0–560 scale. At the same position, m6A peaks of IP group over input group were recognized as the genuine m6A level. Black blocks below figure indicated the sites where the m6A level differed between two groups, and the most remarkable location was highlighted with a gray pane. b Relative enrichment of LYPD1 mRNA associated with ALKBH5 protein was identified by RIP assays using anti-IgG and anti-ALKBH5 antibodies. The IgG group was a negative control to preclude nonspecific binding. The Y axis represented the percent of input for each IP sample according to the formula: %Input =1/10*2Ct [IP] – Ct [input]. c m6A modification of LYPD1 was detected by MeRIP-qPCR analysis using anti-IgG and anti-m6A antibodies. Relative m6A enrichment of LYPD1 mRNA for each IP group was normalized to input. Silencing of ALKBH5 induced an increase m6A abundance on LYPD1 compared with control group, while ALKBH5 overexpression led to the opposite result; d Graphical explanation for construction of luciferase reporters. The wild-type (full-length) or mutant (m6A motif mutated) sequence of LYPD1–3’UTR was inserted into a pcDNA3.1 vector between Firefly and Renilla elements. Relative luciferase activity was computed by the ratio of Firefly and Renilla luciferase values. e Relative luciferase activity of Huh7, MHCC97H and HCCLM3 cells transfected with the LYPD1-wild type or -mutated construct was measured, with normal or altered expression of ALKBH5; f ALKBH5-silenced or -overexpressed cells were treated with actinomycin D and harvested at 0, 3 and 6 h. RNA decay rate was determined to estimate the stability of LYPD1 (normalized to the expression at 0 h); g IGF2BP1 was knockdown in two HCC cells followed by the measurement of LYPD1 expression via qPCR; h RIP-qPCR validated that IGF2BP1 could bind to LYPD1 mRNA. Relative enrichment of LYPD1 mRNA in each group was showed with the normalization to input; i Rescue assays were employed to verify the impact of IGF2BP1 on ALKBH5-mediated modulation of LYPD1
Fig. 6
Fig. 6
LYPD1 accelerates the malignant progression of HCC. a and b Knockdown of LYPD1 with two siRNAs was validated (left in upper panel) and proliferation abilities of LYPD1-silenced Huh7 (a) and MHCC97H (b) cells were determined using CCK-8 (right in upper panel) and colony formation assays (lower panel); c and d EdU assays were performed to detect the percent of cells with active DNA replication (scale bars in c, 200 μm); Hoechst staining showed the total cells, while EdU staining represented cells in S phase. And quantification data for each group (d) was displayed on the right; e and f Migration and invasion capabilities of Huh7 (e) and MHCC97H (f) cells after LYPD1 silencing were evaluated. Representative images (scale bars, 200 μm, left panel) and quantification charts (right panel) were shown; g and h Subcutaneous tumor models were established using stable LYPD1-knockdown Huh7 (g, n = 5) and MHCC97H (h, n = 5) cells. Photographs of tumors collected from mice were shown (left panel). Then tumor weights (middle panel) and growth curves (right panel) were exhibited to compare the difference of two groups. i GEO data analysis of HCC cohorts uploaded by Roessler et al. (GSE14520) and Mas et al. (GSE14323) showed the differential expression of LYPD1 in tumor and normal tissues; j Survival analysis of HCC patients based on expression of LYPD1 was conducted using TCGA data (n = 364)
Fig. 7
Fig. 7
Dysregulation of the ALKBH5-LYPD1 axis triggers HCC malignancy. a and b CCK-8 proliferation assays were conducted in either ALKBH5-knockdown or LYPD1-knockdown Huh7 (a) and MHCC97H (b) cells; c and d Colony formation assays were carried out in either ALKBH5-silenced or LYPD1-silenced Huh7 (c) and MHCC97H (d) cells. Column diagrams (right panel) showed colony numbers of each group; e, f and g Representative images of transwell assays to examine the effects of LYPD1 knockdown on ALKBH5-silenced Huh7 (e) and MHCC97H (f) cells were shown (scale bars, 200 μm); Quantification data presented the relative count (refer to negative control group) of cells which passed through the chamber membrane (g); h Representative images of wound healing assays conducted in ALKBH5/LYPD1-rescued cells were shown (left panel). And percent area of wound healed in each group was quantified (right panel)
Fig. 8
Fig. 8
Low ALKBH5 expression is interrelated with high LYPD1 expression in HCC. a The TMA cohort (cohort two) was subject to IHC staining for both ALKBH5 and LYPD1. Representative images of higher or lower ALKBH5 staining and corresponding LYPD1 staining were shown, respectively (scale bars, 50 μm; magnification, 100× and 400×); b IHC staining statistics showed the percentage of HCC samples displaying higher or lower ALKBH5 levels and corresponding LYPD1 expression. For the same specimens, the IHC intensity of ALKBH5 and LYPD1 were frequently negatively correlated. c GEO data analysis of two HCC cohorts (GSE6764 and GSE3500) showed the inverse correlation of ALKBH5 and LYPD1 based on RNA expression; d A schematic illustration was proposed to summarize our findings about ALKHB5-guided m6A modulation on LYPD1 (the green and red colors indicated the activated and inhibited status, respectively). In brief, ALKBH5 is down-regulated in HCC cells compared with normal liver cells. Deficiency of ALKBH5 leads to an elevated m6A level of LYPD1 which is recognized and strengthened by the m6A effector IGF2BP1, thus reinforcing the expression of LYPD1. Accumulated LYPD1 promotes the proliferation and invasion capabilities of HCC cells, and further drives the tumorigenesis of HCC

Similar articles

Cited by

References

    1. Siegel RL, Miller KD, Jemal A. Cancer statistics, 2020. CA Cancer J Clin. 2020;70:7–30. - PubMed
    1. Yang JD, Hainaut P, Gores GJ, Amadou A, Plymoth A, Roberts LR. A global view of hepatocellular carcinoma: trends, risk, prevention and management. Nat Rev Gastroenterol Hepatol. 2019;16:589–604. - PMC - PubMed
    1. Yegin EG, Oymaci E, Karatay E, Coker A. Progress in surgical and nonsurgical approaches for hepatocellular carcinoma treatment. Hepatobiliary Pancreat Dis Int. 2016;15:234–256. - PubMed
    1. Rebouissou S, Nault JC. Advances in molecular classification and precision oncology in hepatocellular carcinoma. J Hepatol. 2020;72:215–229. - PubMed
    1. Liu J, Harada BT, He C. Regulation of gene expression by N(6)-methyladenosine in cancer. Trends Cell Biol. 2019;29:487–499. - PMC - PubMed

Publication types

MeSH terms