. 2020 Aug 10:9:e59099.
doi: 10.7554/eLife.59099.

The autophagy adaptor NDP52 and the FIP200 coiled-coil allosterically activate ULK1 complex membrane recruitment

Affiliations

The autophagy adaptor NDP52 and the FIP200 coiled-coil allosterically activate ULK1 complex membrane recruitment

Xiaoshan Shi et al. Elife. .

Abstract

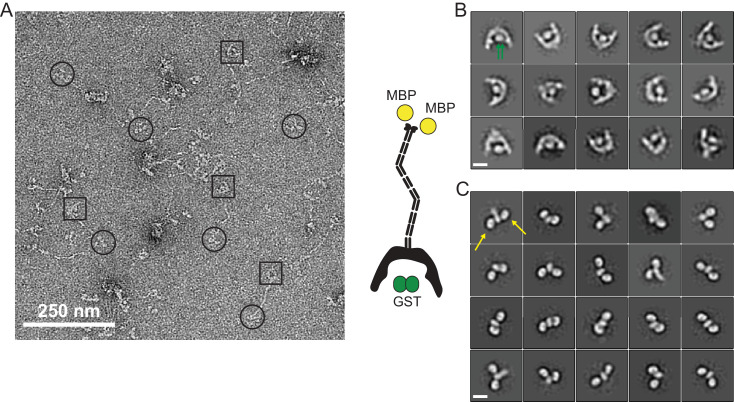
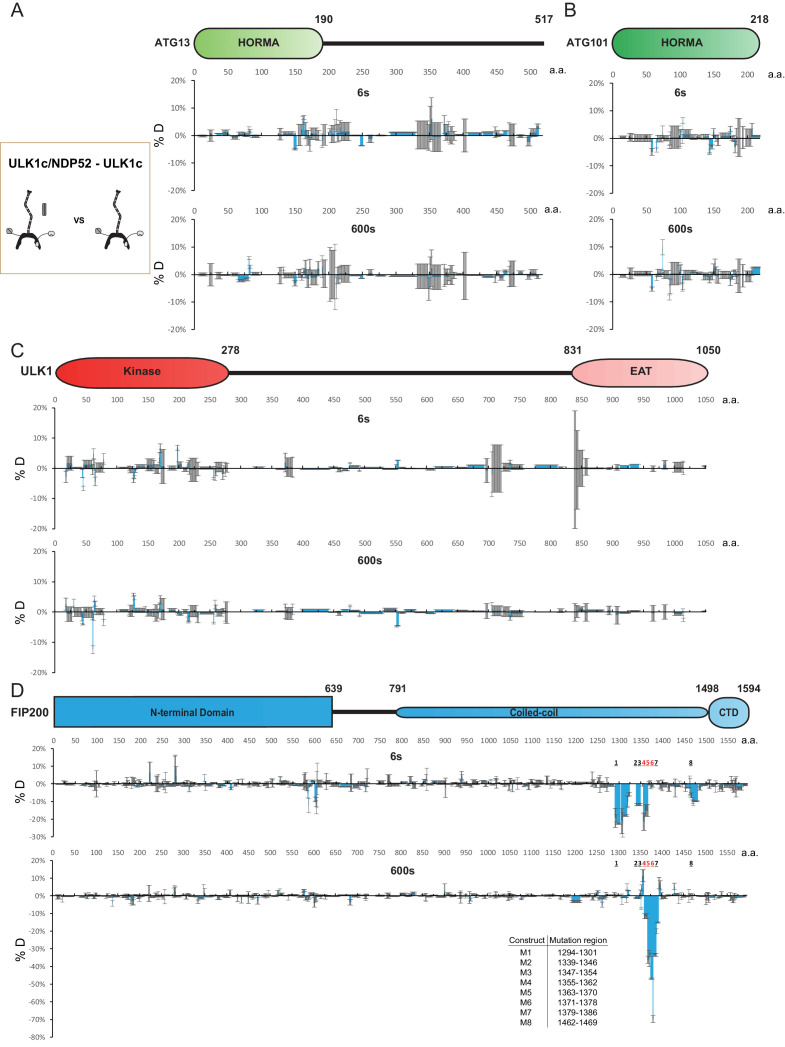
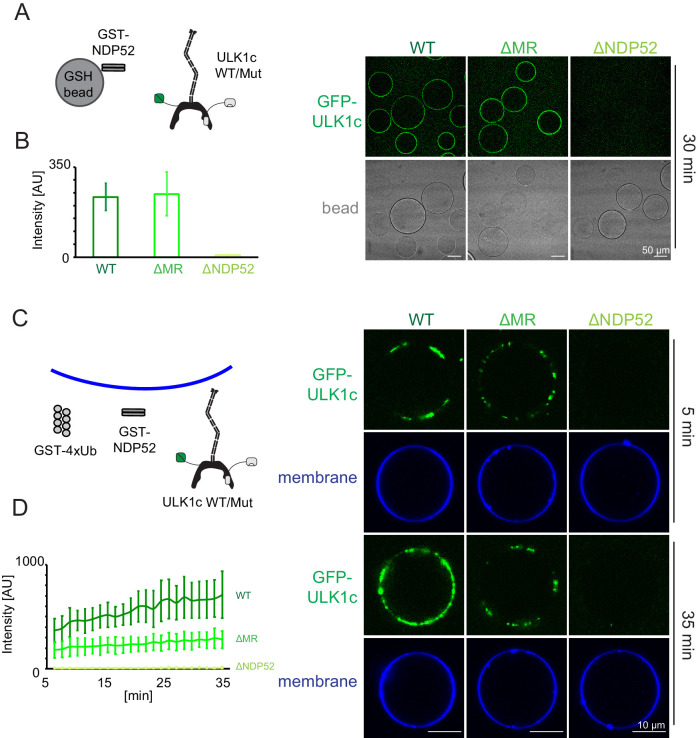
The selective autophagy pathways of xenophagy and mitophagy are initiated when the adaptor NDP52 recruits the ULK1 complex to autophagic cargo. Hydrogen-deuterium exchange coupled to mass spectrometry (HDX-MS) was used to map the membrane and NDP52 binding sites of the ULK1 complex to unique regions of the coiled coil of the FIP200 subunit. Electron microscopy of the full-length ULK1 complex shows that the FIP200 coiled coil projects away from the crescent-shaped FIP200 N-terminal domain dimer. NDP52 allosterically stimulates membrane-binding by FIP200 and the ULK1 complex by promoting a more dynamic conformation of the membrane-binding portion of the FIP200 coiled coil. Giant unilamellar vesicle (GUV) reconstitution confirmed that membrane recruitment by the ULK1 complex is triggered by NDP52 engagement. These data reveal how the allosteric linkage between NDP52 and the ULK1 complex could drive the first membrane recruitment event of phagophore biogenesis in xenophagy and mitophagy.

Keywords: HDX-MS; autophagy; biochemistry; cell biology; chemical biology; coiled-coil; electron microscopy; human; mitophagy; xenophagy.


Conflict of interest statement

XS, CC, AY, LJ No competing interests declared, JH JHH is co-founder of Casma Therapeutics

Figures

Figure 1.
Figure 1.. EM and HDX-MS of full-length FIP200.
(A) Negative stain EM single particles of full length FIP200 alone. Scale bar 50 nm. (B) Histogram of FIP200 path length and end-to-end distances. (C) Difference of Hydrogen Deuterium Exchange percentages of the FIP200 alone vs FIP200:ATG13:ATG101:ULK1 at 60 s time point. All values are mean (Blue) ± SD (Grey). N = 3 replicates.
Figure 1—figure supplement 1.
Figure 1—figure supplement 1.. EM of full-length FIP200.
(A) Negative Stain EM micrograph of full-length GST-FIP200-MBP. 2D class averages of the NTD dimer (B) and CTD Claw domain (C) of GST-FIP200-MBP. Green arrows indicate the GST tags and yellow arrows indicate the MBP tags. Scale bars are 10 nm.
Figure 1—figure supplement 2.
Figure 1—figure supplement 2.. Purified ULK1 complex is functional.
(A) ADP-Glo Kinase assay of ULK1 complex with ULKtide as substrate. N = 5 biological replicates. All values are mean ± SD. (B) Hydrogen Deuterium Exchange percentages of the FIP200 alone (Purple) and in FIP200:ATG13:ATG101:ULK1 (Blue) at 60 s time point. (C) Microscopy-based bead protein interaction assay with glutathione sepharose beads coated with GST-NDP52 as baits and incubated with GFP-tagged wild type ULK1 complex. Representative confocal micrographs are shown. Scale bars, 50 µm. (D) Pull-down efficiency of GFP-tagged wild type ULK1 complex by glutathione sepharose beads coated with GST-NDP52 or GST-4xUb as baits. N = 3 biological replicates. All values are mean ± SD.
Figure 2.
Figure 2.. HDX-MS mapping of NDP52 interactions with the ULK1 complex.
(A–D) Difference of Hydrogen Deuterium Exchange percentages of the ATG13 (A), ATG101 (B), ULK1 (C) and FIP200 (D) in ULK1 complex vs in ULK1 complex with NDP52 at the 60 s time point. All values are mean (Blue) ± SD (Grey). N = 3 replicates. (E) Pull-down efficiency of GFP-tagged wild type ULK1 complex or GFP-FIP200 by glutathione sepharose beads coated with different concentrations of GST-NDP52 as baits. All values are mean ± SD. N = 4 biological replicates. (F) Pull-down assays of mutant FIP200 constructs (M1–M8) and wild type with NDP52. Both GSH and Amylose resin were used to pull down GST-FIP200(1274 C):MBP-NDP52 complex from lysate of overexpressing HEK cells. The pull-down results were visualized by SDS-PAGE and Coomassie blue staining.
Figure 2—figure supplement 1.
Figure 2—figure supplement 1.. HDX-MS analysis of the interaction of the ULK1 complex with NDP52.
(A–D) Difference of Hydrogen Deuterium Exchange percentages of the ATG13 (A), ATG101 (B), ULK1 (C) and FIP200 (D) in ULK1 complex vs in ULK1 complex with NDP52 at the 6 s and 600 s time point. All values are mean (Blue) ± SD (Grey).
Figure 2—figure supplement 2.
Figure 2—figure supplement 2.. The coiled-coil domain of FIP200 is involved in binding with NDP52 and membranes, but not its stability.
(A) Hydrogen Deuterium Exchange percentages of FIP200 in ULK1 complex (Purple) and in ULK1 complex with NDP52 (Blue) at the 60 s time point. (B) Hydrogen Deuterium Exchange percentages of FIP200 in ULK1 complex (Purple) and in ULK1 complex with POPS/POPI SUV (Blue) at the 60 s time point. (C) GSH resin was used to pull down GST-FIP200-MBP, GST-FIP200ΔMR-MBP and GST-FIP200ΔNDP52-MBP from lysate of overexpressing HEK cells. The pull-down results were visualized by SDS-PAGE and Coomassie blue staining.
Figure 3.
Figure 3.. HDX-MS mapping of membrane interactions with the ULK1 complex.
(A–C) Difference of Hydrogen Deuterium Exchange percentages of the ATG13 (A), ATG101 (B) and FIP200 (C) in ULK1 complex vs in ULK1 complex with POPS/POPI SUV at the 60 s time point. All values are mean (Blue) ± SD (Grey). N = 3 replicates. (D) Liposome sedimentation assay of FIP200 truncations alone with POPS/POPI and POPC/POPE SUVs. Results were visualized by SDS-PAGE and Coomassie blue staining with the supernatant fractions (S) and pellet fractions (P).
Figure 4.
Figure 4.. Reconstitution of NDP52-stimulated membrane binding of the ULK1 complex.
The schematic drawing illustrates the reaction setting. Colors indicate fluorescent protein fused components. Components in gray are not labeled but are present in the reaction mix. (A) Representative confocal micrographs showing the membrane recruitment of GFP-FIP200. GFP-FIP200 mixed with His-NDP52 or GST-NDP52 was incubated with GUVs, either in the absence or presence of GST-4xUb at room temperature. GFP-FIP200 alone or mixed with GST-4xUb was also incubated with GUVs at room temperature as controls. Images taken at indicated time points were shown. Scale bars, 10 µm. (B) Quantitation of the kinetics of FIP200 recruitment to the membrane from individual GUV tracing in A (means ± SDs; N = 51 (-); 51 (His-NDP52); 48 (GST-NDP52); 53 (GST-4xUb); 72 (GST-4xUb+ His-NDP52); 57 (GST-4xUb+ GST-NDP52)). (C) Representative confocal micrographs showing the membrane recruitment of GFP-ULK1 complex. GFP-ULK1 complex alone or mixed with His-NDP52 or GST-NDP52 in the presence of GST-4xUb was incubated with GUVs at room temperature. Images taken at indicated time points were shown. Scale bars, 10 µm. (D) Quantitation of the kinetics of ULK1 complex recruitment to the membrane from individual GUV tracing in C (means ± SDs; N = 54 (-); 47 (GST-4xUb+ His-NDP52); 49 (GST-4xUb+ GST-NDP52)).
Figure 5.
Figure 5.. NDP52 allosterically activates membrane association of the ULK1 complex.
(A) Microscopy-based bead protein interaction assay with glutathione sepharose beads coated with GST-NDP52 as baits and incubated with GFP-tagged wild type ULK1 complex or mutant as prey. Representative confocal micrographs are shown. Scale bars, 50 µm. (B) Quantification of the GFP-ULK1 complex signal intensity measured on glutathione sepharose beads coated with GST-NDP52 (means ± SDs; N = 20). (C) Representative confocal micrographs showing the membrane recruitment of GFP-ULK1 complex. GFP-tagged wild type ULK1 complex or mutant was mixed with GUVs in the presence of GST-NDP52 and GST-4xUb at room temperature. Images taken at indicated time points were shown. Scale bars, 10 µm. (D) Quantitation of the kinetics of ULK1 complex recruitment to the membrane from individual GUV tracing in A (means ± SDs; N = 22 (WT); 25 (ΔMR); 22 (ΔNDP52)).
Figure 5—figure supplement 1.
Figure 5—figure supplement 1.. Membrane binding of NDP52.
Representative confocal micrographs showing the membrane recruitment of NDP52. GST-NDP52-mCherry (upper) or TSF-NDP52-mCherry (lower) was mixed with GUVs in the presence or absence of GST-4xUb at room temperature. Images taken at 30 min were shown. Scale bars, 10 µm.
Figure 6.
Figure 6.. Model for ULK1 complex membrane recruitment.
Before engagement with NDP52, the FIP200 middle region (790–1050) forms a stable coiled-coil in a low membrane affinity state and the CTD and ‘Claw’ domains are unbound. Initially, NDP52 is recruited by interaction with ubiquitin to autophagic cargo in both xenophagy and mitophagy. FIP200 CTD binds directly to NDP52, driving clustering of FIP200 along with an allosteric conformational change in the MR region. These clusters form a hub for ULK1 auto-transphosphorylation and a site for initial recruitment of phagophore membranes.
Author response image 1.
Author response image 1.. NDP52 binds weakly to PA-containing GUVs.
Binding is unaffected by mutation of the putative PA binding sequence of Yu et al.

References

    1. Alers S, Wesselborg S, Stork B. ATG13: just a companion, or an executor of the autophagic program? Autophagy. 2014;10:944–956. doi: 10.4161/auto.28987. - DOI - PMC - PubMed
    1. Bento CF, Renna M, Ghislat G, Puri C, Ashkenazi A, Vicinanza M, Menzies FM, Rubinsztein DC. Mammalian autophagy: how does it work? Annual Review of Biochemistry. 2016;85:685–713. doi: 10.1146/annurev-biochem-060815-014556. - DOI - PubMed
    1. Boya P, Reggiori F, Codogno P. Emerging regulation and functions of autophagy. Nature Cell Biology. 2013;15:713–720. doi: 10.1038/ncb2788. - DOI - PMC - PubMed
    1. Cheung PY, Limouse C, Mabuchi H, Pfeffer SR. Protein flexibility is required for vesicle tethering at the golgi. eLife. 2015;4:e12790. doi: 10.7554/eLife.12790. - DOI - PMC - PubMed
    1. Fracchiolla D, Chang C, Hurley JH, Martens S. A PI3K-WIPI2 positive feedback loop allosterically activates LC3 lipidation in autophagy. Journal of Cell Biology. 2020;219:e201912098. doi: 10.1083/jcb.201912098. - DOI - PMC - PubMed

Publication types

MeSH terms

Substances