. 2020 Aug 10:9:e56922.
doi: 10.7554/eLife.56922.

Differentiating Drosophila female germ cells initiate Polycomb silencing by regulating PRC2-interacting proteins

Affiliations

Differentiating Drosophila female germ cells initiate Polycomb silencing by regulating PRC2-interacting proteins

Steven Z DeLuca et al. Elife. .

Abstract

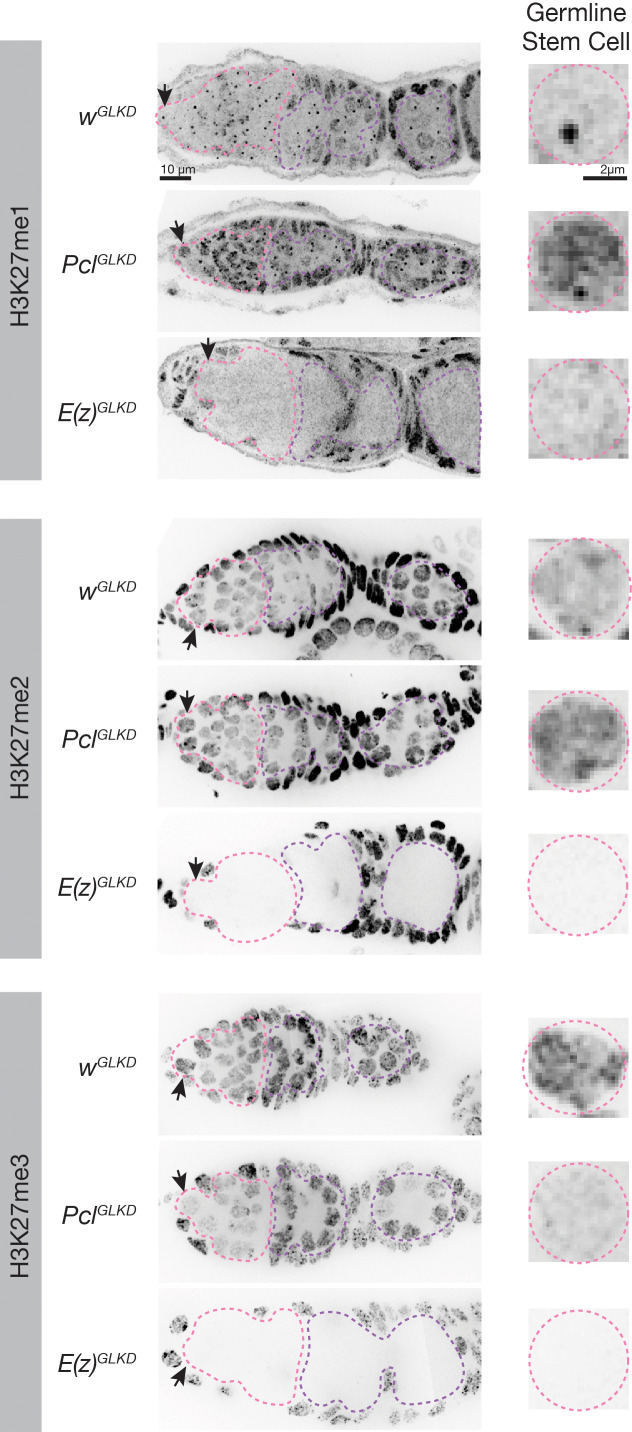
Polycomb silencing represses gene expression and provides a molecular memory of chromatin state that is essential for animal development. We show that Drosophila female germline stem cells (GSCs) provide a powerful system for studying Polycomb silencing. GSCs have a non-canonical distribution of PRC2 activity and lack silenced chromatin like embryonic progenitors. As GSC daughters differentiate into nurse cells and oocytes, nurse cells, like embryonic somatic cells, silence genes in traditional Polycomb domains and in generally inactive chromatin. Developmentally controlled expression of two Polycomb repressive complex 2 (PRC2)-interacting proteins, Pcl and Scm, initiate silencing during differentiation. In GSCs, abundant Pcl inhibits PRC2-dependent silencing globally, while in nurse cells Pcl declines and newly induced Scm concentrates PRC2 activity on traditional Polycomb domains. Our results suggest that PRC2-dependent silencing is developmentally regulated by accessory proteins that either increase the concentration of PRC2 at target sites or inhibit the rate that PRC2 samples chromatin.

Keywords: D. melanogaster; PRC2; chromatin; chromosomes; differentiation; epigenetic; gene expression; nurse cell; polycomb.


Conflict of interest statement

SD, MG, LP, AS No competing interests declared

Figures

Figure 1.
Figure 1.. Developmentally regulated silencing in inactive and PcG domains in the germline.
(A) Cyclical lineage of female germ cells and two dead-end derivative lineages, soma and nurse cells. (B) Map of chromosome 3R showing color-coded, simplified chromatin states. (C) Integration protocol of hsGFP silencing reporters into MiMIC insertions within different chromatin domains and expected expression +/- heat shock (hs). (D) Cell types in a stage 10 follicle. Germline knockdown (GLKD) should affect nurse cells (purple), and oocytes (cyan) but not surrounding somatic cells (white). (E) Stage 9/10 follicles showing GFP fluorescence from reporters integrated in active (near Dak1), inactive (near OR67D) or PcG (near Antp) chromatin, in control (wGLKD), ScmGLKD, or E(z) GLKD. Somatic follicle cells serve as an internal control. (F) Diagram of germline development from pre-meiotic stages (GSC/R1, pink). Nurse cells (purple) differentiate from oocytes (cyan) in region 2A (R2A); nurse cells and oocytes grow further (St3-St8). Below, GFP fluorescence after heat shock from two indicated lines. (G) Plot of mean GFP induction ([GFP]+hs – [GFP]-hs) in nurse cells or their precursors across 12 developmental stages for 15 reporter lines colored according to their chromatin domain. (H) The effect of E(z)GLKD on reporters near the indicated genes colored by domain type. Solid line indicates mean fluorescence; shading shows one standard deviation from the mean. X-axes colored for stage as in G. Size bars: D, E 100 µm; F 50 µm.
Figure 2.
Figure 2.. ChIPseq of FACS-purified germline chromatin.
(A,B) FACSdiva-generated summaries of FACS-sorted fixed nuclei. (A) Nuclei were sorted using GFP from bam ovaries expressing germline-specific nuclear GFP vs DNA content (DAPI), yielding GSCs and somatic escort cells (EC). (B) Nurse and Follicle cell nuclei were sorted using Tomato from ovaries expressing germline-specific tdTomato vs. DNA content (DAPI). The haploid DNA content (C-value) is noted above each peak. 2c nuclei were not on scale to aid visualization of larger nurse cells. (C) Chromosome 3R genome browser view of RPM-normalized H3K27me3 ChIPseq read depth from the indicated purified nuclei. Below: chromatin states in S2 cells. (D) Chromosome 3R subregion (dashed lines) showing RPM-normalized read depth from input (blue) or ChIPseq of the indicated epitopes. Nurse cell H3K27me3 read depth is plotted on two scales to show enrichment over a 100-fold range. (E) 2c follicle cell vs. stage 5 nurse cell H3K27me3 enrichment (IP/Input) on every annotated active, inactive, and PcG domain larger than 10 kilobases in S2 cells. PcG domains uniquely depleted of H3K27me3 in nurse cells or follicle cells are indicated with an arrow and the name of a gene within the domain. (F) Summary of the number of PcG domains shared by follicle cells, nurse cells, and S2 cells. (G) Summary of GSC ChIP plotting H3K27ac enrichment (IP/Input) in a 500 bp bin downstream from the annotated transcription start site (TSS) of every protein-coding gene vs. H3K27me3 enrichment (IP/Input) on its gene body. (H–I) H3K27me3 enrichment histograms across active (magenta), inactive (black), and PcG (green) domains divided into 5 kb bins tiling the genome. (H) Purified ovarian cell types. (I) Cycle 13 and 14 embryos (Li et al., 2014). In (I), total H3 is included as a control to show that active domains are not depleted of H3K27me3 because they are depleted of total H3.
Figure 3.
Figure 3.. Regulation of PcG genes and activities during germline development.
(A) Illustration highlighting stages of Drosophila germline differentiation and immunofluorescence staining (IF) or native GFP fluorescence of the indicated methylated H3K27 epitopes or PcG proteins. Pink dashes surround premeiotic progenitors in region 1, including germline stem cells situated at the anterior (left). Purple dashes surround nurse cells differentiating from oocytes starting in region 2. Blue dashes surround oocytes, which are located at the posterior of each follicle and are not always included in the optical section of ovarian tissue displayed. (B) Model showing subunits of PRC1, PRC2, PhoRC, and Scm, a putative bridge between the complexes. (C) PcG gene mRNA levels (TPM) measured by RNAseq analysis of FACS-purified GSC (pink) vs whole ovary tissue enriched in differentiated nurse and follicle cells (purple, NC+FC). (D) ChIPseq raw read depth heatmap comparing PcG proteins or histone modifications in 20 kb regions surrounding every Ph peak found in differentiated ovary tissue. In GSCs, Ph peaks in PcG domains (upper region) are associated with Pho and a ‘bivalent’ enrichment of H3K27me3 and H3K4me3. (E) In situ hybridization shows that Pcl mRNA (green) accumulates in oocytes (arrowheads, white outline). PclGLKD serves as a control. Scale bars: D,E 10µ.
Figure 3—figure supplement 1.
Figure 3—figure supplement 1.. Su(z)12-GFP foci require Pcl and colocalize with Pho.
(A) Native fluorescence of Su(z)12-GFP (green) and immunofluorescence staining of Pho (magenta) in a stage-5 follicle. Individual channels and merged image of a single outlined nucleus is shown below. (B) Pixel intensity of Su(z)12-GFP (green) and Pho (magenta) measured along the yellow line drawn in the merged panel of A. (C) Native fluorescence of Su(z)12-GFP in control (wGLKD) or PclGLKD stage 6 follicles. Scale bar is 10 µm.
Figure 4.
Figure 4.. PcGGLKD effects on fertility, ovarian development, and bulk H3K27 methylation.
(A) Whole ovaries (row 1) or immunofluorescence (IF) images of stage 5 follicles antibody stained for the indicated protein epitopes or DNA (DAPI) (rows 2–5). E(z)GLKD blocks oocyte differentiation (row2), and abolishes H3K27me2 and H3K27me3 staining, while PclGLKD and ScmGLKD reduce H3K27me3 but not H3K27me2. (B) IF images showing ScmGLKD effectively removes Scm protein from nurse cells and prevents the coalescence of Ph into discreet foci. (C) IF images of H3K27me3 in ph-d/ph-p or Sce null mutant clones generated by mitotic recombination and visualized by lack of GFP (clonal marker) fluorescence.
Figure 5.
Figure 5.. ChIPseq of PclGLKD and ScmGLKD.
(A) Spike-in normalized H3K27me3 ChIP from FACS-purified GSC or stage 5 nurse cell (St5 NC) nuclei of the indicated genotypes in a 4 Mb region including Ant-c. PclGLKD in GSCs specifically depletes H3K27me3 from inactive loci. In NCs, PclGLKD and ScmGLKD deplete H3K27me3 from PcG loci. (B) Subdivision of 9400 PcG bins into 1200 PRE-containing bins (orange), and 8,200 PRElacking bins (green). (C) ChIPseq raw read depth heatmap showing the effect of Pcl and Scm knockdown on H3K27me3 enrichment near all ovary Ph peaks. Note that H3K27me3 enrichment on GSC PREs is revealed by PclGLKD. (D) Smoothed histograms for each indicated genotype and stage showing spike-in normalized H3K27me3 enrichment (IP/Input) in 5 kb active (magenta), inactive (black), PcG (green), and PRE-containing (orange) bins tiling the genome. IF images of H3K27me3 in GSC and St5 NC show the relationship between H3K27me3 enrichment in ChIPseq (left) and whole mount staining (right). (E) Boxplots summarizing the fold changes in H3K27me3 enrichment in inactive (grey), PcG (green), and PRE-containing (orange) 5 kb bins induced by PclGLKD or ScmGLKD in the indicated stages.
Figure 6.
Figure 6.. Regulation of PRC2-depenent silencing through Pcl and Scm.
(A) The effects of E(z)GLKD or ScmGLKD versus control (wGLKD) on hsGFP reporters near an active domain (dak1), inactive domain (OR67D), or PcG domains (rn, antp, or bxd) throughout the indicated stages of germ cell development. Solid line indicates mean fluorescence; shading shows one standard deviation from the mean. (B) Quantification of relative H3K27me1/2/3 antibody staining intensity in the euchromatin of control wGLKD, PclGLKD, or E(z)GLKD GSCs. (C) Quantification of reporter gene induction in GSCs in control wGLKD, PclGLKD, or E(z)GLKD. Note that PclGLKD reduces the induction of some inactive (black) and PcG (green) localized reporters but not active (magenta) localized reporters (*=p < 0.05, **=p < 0.01, N.S. = not significant; Student’s t-test, unpaired, 2-tailed). (D) Sampling model for the developmental control of silencing. In GSCs, most PRC2 is associated with Pcl, whose affinity for DNA prevents PRC2 from sampling many sites, resulting in infrequent and stochastic silencing. As Pcl levels drop during differentiation, core-PRC2, having a lower affinity for DNA, is freed to sample and silence more sites. Additionally Scm is induced and concentrated on PREs, where it preferentially concentrates residual Pcl-PRC2 through cooperativity between the Scm-PRC2 interaction and Pcl-DNA interaction.
Figure 6—figure supplement 1.
Figure 6—figure supplement 1.. H3K27 methylation staining in germline progenitors IF images of ovaries of the indicated genotype stained for the indicated H3K27me epitope.
Germline progenitors are outlined in pink and nurse cells are outlined in purple. Arrows point to a single germline stem cell nucleus for each condition that is magnified on the right. Mean intensity of H3K27 methylation staining in GSCs from multiple samples is summarized in Figure 6B.
Figure 7.
Figure 7.. PRC2 represses endogenous genes in inactive and PcG domains in nurse cells.
(A) Whole ovary RNAseq showing how indicated PcGGLKDs affect gene expression in whole ovaries that fully developed (right), developed until Stage 6 (left), or failed to differentiate due to the bam mutation (middle). On the scatter plot (left), each dot represents a protein-coding gene colored to match the chromatin domain it resides in. Notched boxplots (right) summarize the fold-change distribution for all genes residing in each domain class. Notches show 95% confidence interval (CI) of the median, boxes show interquartile range. Black dots indicate the fold change of the PcG gene targeted by RNAi in each sample. (B) Whole ovary RNAseq comparing gene expression in each indicated stage and genotype to control, undifferentiated, bam mutant ovaries. (Left panel) The relative median fold changes (solid lines, 95% CI is shaded) between each class of gene (colored by domain type) plotted as a function of ovary development. (Right nine panels) The effects of various PcGGLKDs or controls on relative median fold change for each class of gene. Error bars represent 95% CI of the median. (C) Mean transcripts per million (TPM) of transcription factors located in PcG domains with the highest expression (>5 TPM in E(z)GLKD) and upregulation (>2.5-fold change) in E(z)GLKD compared to control LucGLKD. Error bars represent one standard deviation from mean. (D) Stage 5 follicle IF showing Chinmo protein upregulation in E(z)GLKD nurse cell nuclei. DNA = DAPI. (E) Whole ovary. RNAseq showing that GLKD of some PcG genes upregulate chinmo, compared to control (w). Size bars: A (row 1) 0.5 mm, (rows 2–4) 10 µm, (row 5) 1 µm.
Figure 7—figure supplement 1.
Figure 7—figure supplement 1.. ScmGLKD mothers produce defective embryos.
(A) Fluorescence in situ hybridization (green) showing normal stripe expression of the Abd-b target, Ubx, in control- (wGLKD) or ScmGLKD-derived stage 5 embryos. (B) Abd-b protein (green) is mis-expressed throughout anterior segments of ScmGLKD-derived embryos following germ band extension. DAPI (magenta) stains nuclei.

Similar articles

Cited by

References

    1. Alfieri C, Gambetta MC, Matos R, Glatt S, Sehr P, Fraterman S, Wilm M, Müller J, Müller CW. Structural basis for targeting the chromatin repressor sfmbt to polycomb response elements. Genes & Development. 2013;27:2367–2379. doi: 10.1101/gad.226621.113. - DOI - PMC - PubMed
    1. Alhaj Abed J, Ghotbi E, Ye P, Frolov A, Benes J, Jones RS. De novo recruitment of Polycomb-group proteins in Drosophila embryos. Development. 2018;145:dev165027. doi: 10.1242/dev.165027. - DOI - PMC - PubMed
    1. Aloia L, Di Stefano B, Di Croce L. Polycomb complexes in stem cells and embryonic development. Development. 2013;140:2525–2534. doi: 10.1242/dev.091553. - DOI - PubMed
    1. Babenko VN, Makunin IV, Brusentsova IV, Belyaeva ES, Maksimov DA, Belyakin SN, Maroy P, Vasil'eva LA, Zhimulev IF. Paucity and preferential suppression of transgenes in late replication domains of the D. Melanogaster genome. BMC Genomics. 2010;11:318. doi: 10.1186/1471-2164-11-318. - DOI - PMC - PubMed
    1. Bai J, Montell D. Eyes absent, a key repressor of polar cell fate during Drosophila oogenesis. Development. 2002;129:5377–5388. doi: 10.1242/dev.00115. - DOI - PubMed

Publication types

MeSH terms

Associated data