. 2020 Aug 10:9:e58157.
doi: 10.7554/eLife.58157.

Cryo-EM structure of VASH1-SVBP bound to microtubules

Affiliations

Cryo-EM structure of VASH1-SVBP bound to microtubules

Faxiang Li et al. Elife. .

Abstract

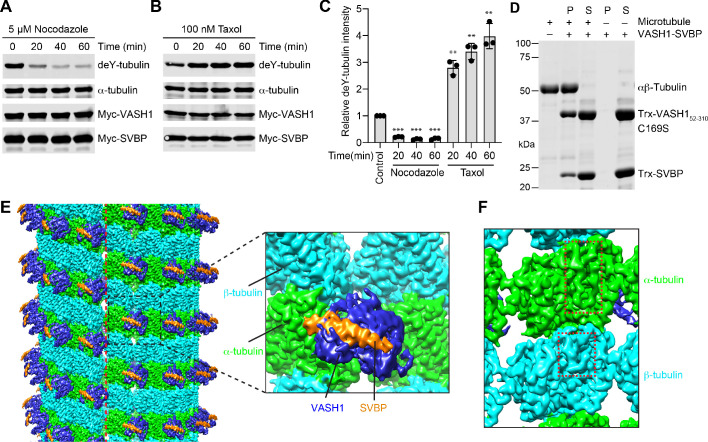
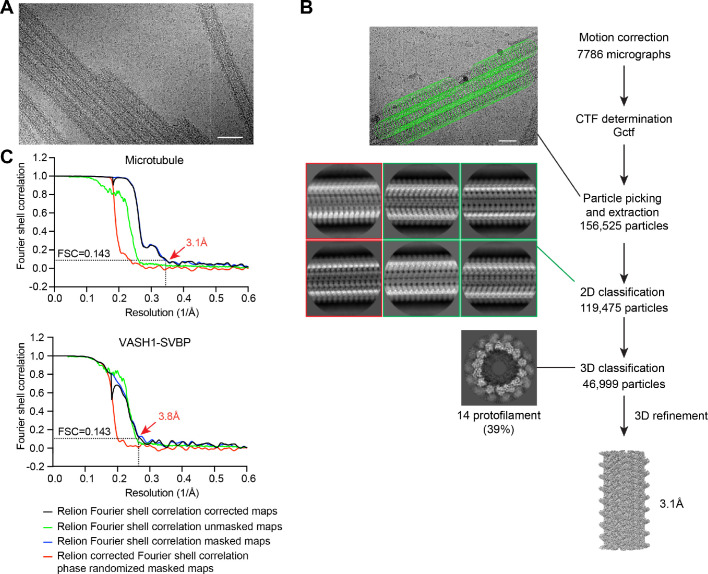
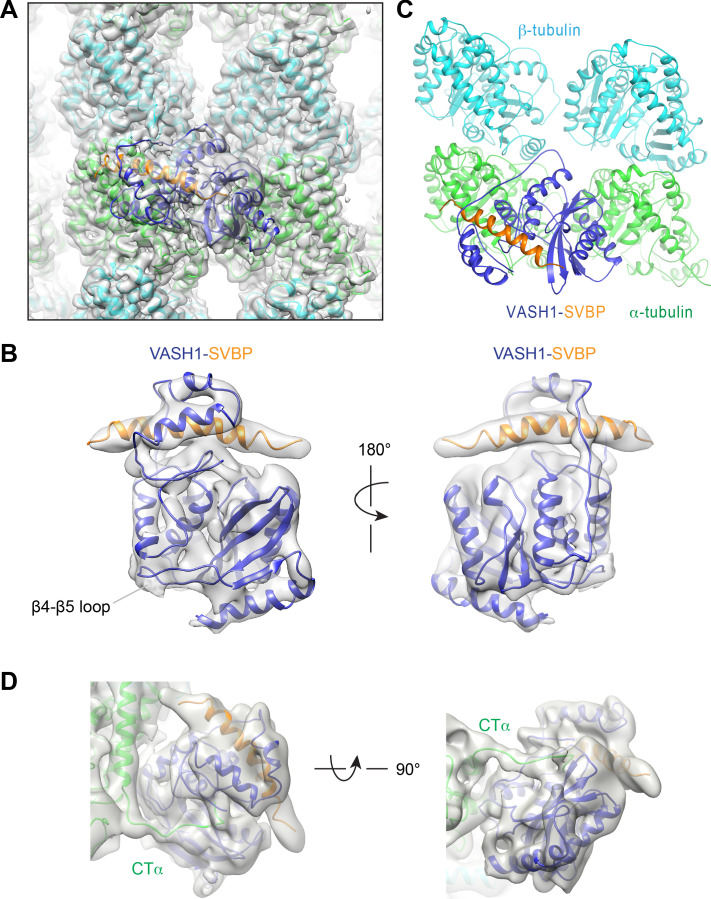
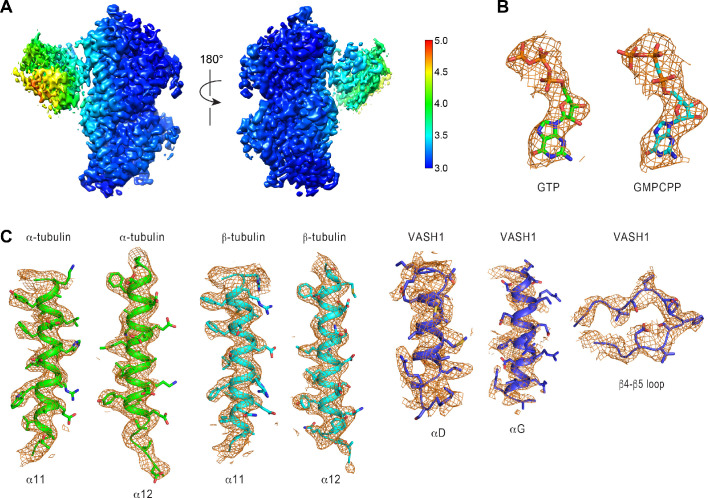
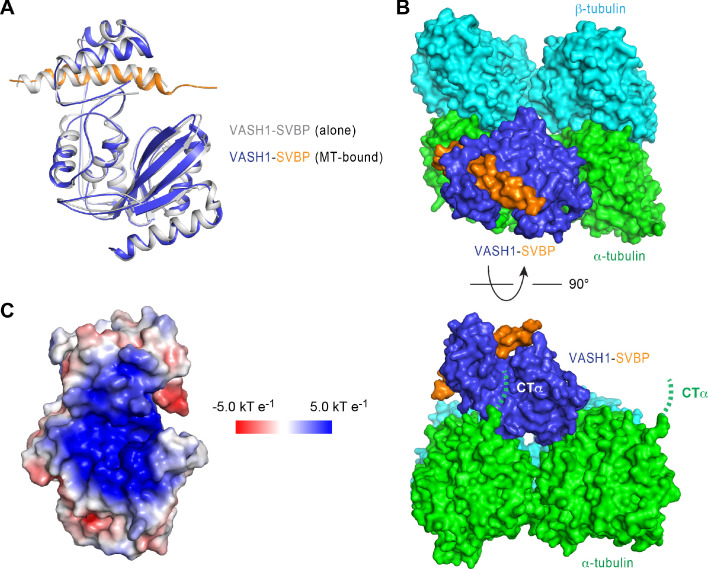
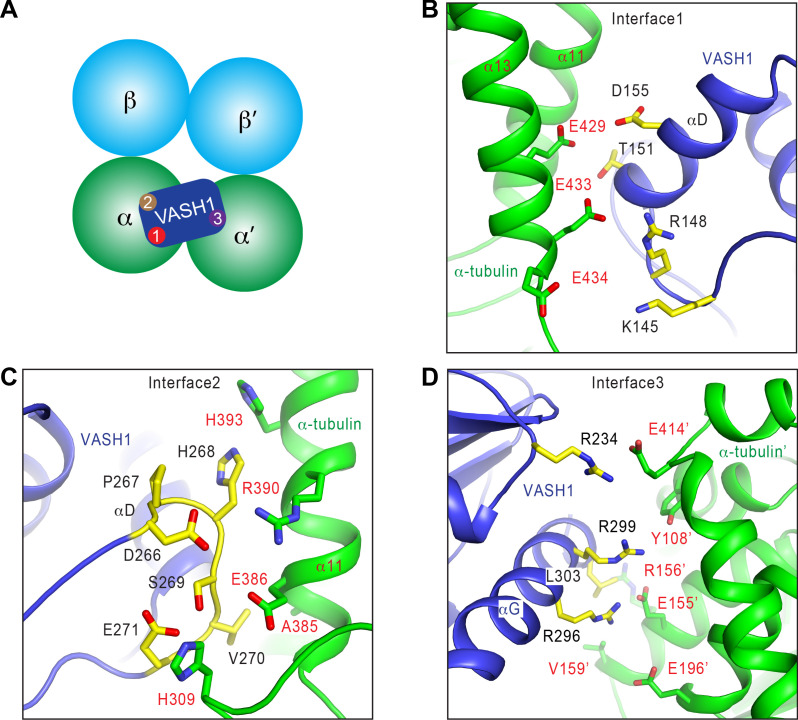
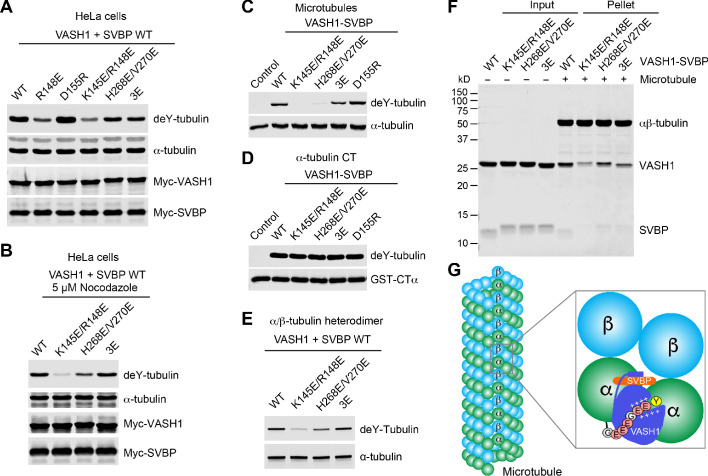
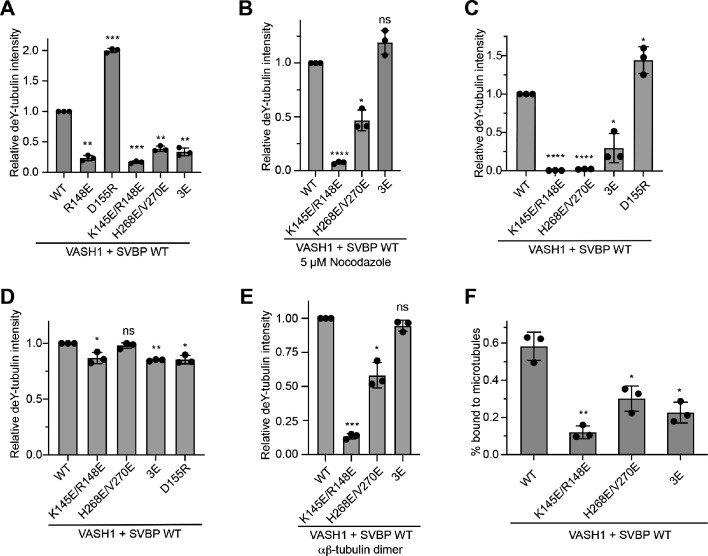
The dynamic tyrosination-detyrosination cycle of α-tubulin regulates microtubule functions. Perturbation of this cycle impairs mitosis, neural physiology, and cardiomyocyte contraction. The carboxypeptidases vasohibins 1 and 2 (VASH1 and VASH2), in complex with the small vasohibin-binding protein (SVBP), mediate α-tubulin detyrosination. These enzymes detyrosinate microtubules more efficiently than soluble αβ-tubulin heterodimers. The structural basis for this substrate preference is not understood. Using cryo-electron microscopy (cryo-EM), we have determined the structure of human VASH1-SVBP bound to microtubules. The acidic C-terminal tail of α-tubulin binds to a positively charged groove near the active site of VASH1. VASH1 forms multiple additional contacts with the globular domain of α-tubulin, including contacts with a second α-tubulin in an adjacent protofilament. Simultaneous engagement of two protofilaments by VASH1 can only occur within the microtubule lattice, but not with free αβ heterodimers. These lattice-specific interactions enable preferential detyrosination of microtubules by VASH1.

Keywords: E. coli; cryo-electron microscopy; detyrosination; microtubule; molecular biophysics; posttranslational modification; structural biology; vasohibin.


Conflict of interest statement

FL, YL, XY, HG, ZS, XL, LR, HY No competing interests declared

Figures

Figure 1.
Figure 1.. VASH1-SVBP efficiently detyrosinates and binds microtubules.
(A,B) Tubulin detyrosination assays of VASH1-SVBP in human cells. HeLa Tet-On cells were co-transfected with VASH1 and SVBP plasmids, and treated with 5 µM nocodazole (A) or 100 nM Taxol (B) for indicated times at 24 hr post-transfection. The cell lysates were blotted with the indicated antibodies. deY-tubulin, detyrosinated α-tubulin. Experiments were repeated three times with similar results. (C) Quantification of the relative detyrosination levels of α-tubulin in (A) and (B) (mean ± s.d., n = 3 independent experiments). Significance calculated using two-tailed student’s t-test; between control cells and cells treated with nocodazole or Taxol for the indicated time; *p < 0.05, **p < 0.01, ***p < 0.001, and ****p < 0.0001. (D) Microtubule pelleting assays showing the binding of VASH1-SVBP to recombinant human microtubules. S, supernatant; P, pellet. (E) Cryo-EM map of 14-protofilament, GMPCPP-stabilized microtubules decorated by the VASH152-310-SVBP complex. The catalytically inactive C169S mutant of VASH1 was used in the complex. The map is lowpass filtered to 4 Å. The microtubule seam is indicated by a red dashed line. α-tubulin, β-tubulin, VASH1, and SVBP are colored in green, cyan, blue, and orange, respectively. The same color scheme is used for all figures. The inset shows a close-up view of the boxed region. (F) Close-up view of the cryo-EM map in (E), viewed from the lumen. The α- and β-tubulin molecules can be distinguished by the length of the S9-S10 loop (boxed with red dashed lines), with the loop in α-tubulin being longer.
Figure 1—figure supplement 1.
Figure 1—figure supplement 1.. Structure determination of VASH1-SVBP-decorated GMPCPP-microtubules.
(A) A representative micrograph of VASH1-SVBP-decorated GMPCPP-microtubules. Scale bar, 50 nm. (B) Processing workflow for cryo-EM structure determination of VASH1-SVBP-decorated GMPCPP-microtubules. The 2D classes of poorly decorated microtubules (red outlines) were discarded whereas the classes belonging to efficiently decorated microtubules (green outlines) were selected for subsequent 3D classification. (C) Fourier shell correlation (FSC) curves of GMPCPP-microtubules decorated with VASH1-SVBP. The FSC curves of microtubules (top) and VASH1-SVBP (bottom) were calculated separately. The final resolution for the reconstruction was estimated by calculating the Fourier shell correlation (FSC) of a single tubulin heterodimer in a ‘good’ protofilament after pseudo-helical averaging, using the FSC = 0.143 criterion.
Figure 2.
Figure 2.. Cryo-EM structure of VASH1-SVBP bound to GMPCPP-stabilized microtubules.
(A) Models of VASH1-SVBP (VASH1, blue; SVBP, orange) and tubulin (α-tubulin, green; β-tubulin, cyan) were docked into the cryo-EM density (lowpass-filtered to 4 Å) and refined. (B) Cryo-EM density map of VASH1-SVBP lowpass-filtered to 6 Å. (C) Ribbon diagram of the cryo-EM structure of VASH1-SVBP bound to microtubules. (D) Two views of the electron density map (generated by Phenix.auto_sharpen, with local B factor sharpening and resolution cutoff at 7 Å) showing an unfitted, continuous density that belonged to the α-tubulin C-terminal tail (CTα).
Figure 2—figure supplement 1.
Figure 2—figure supplement 1.. Cryo-EM map of VASH1-SVBP-decorated GMPCPP-microtubules.
(A) Density corresponding to the αβ-tubulin heterodimer and the VASH1-SVBP complex colored by local resolution as determined in relion_postprocess. (B) Electron density map of nucleotides in the N-site (left) and E-site (right) of microtubules. (C) Representative regions of the cryo-EM map of α-tubulin, β-tubulin, and VASH1, highlighting the density of key residues at VASH1-microtubule interfaces.
Figure 2—figure supplement 2.
Figure 2—figure supplement 2.. Interactions between microtubules and VASH1-SBVP.
(A) Overlay of the ribbon diagrams of the cryo-EM structure of microtubule-bound VASH1-SVBP (colored blue and orange) and the crystal structure of VASH1-SVBP alone (PDB: 6OCG) (colored gray). (B) Surface drawing of the structure of VASH1-SVBP bound to two neighboring αβ-tubulin heterodimers in two different views. The C-terminal tail of α-tubulin (CTα) is indicated by a dashed green line. (C) Solvent-accessible surface of the VASH1-SVBP complex (PDB: 6OCG) colored by electrostatic potential (blue, positive; red, negative).
Figure 3.
Figure 3.. Interactions between VASH1 and microtubules.
(A) Schematic drawing of the VASH1-microtubule complex, with the three main interfaces indicated. (B–D) Close-up views of the VASH1–microtubule interfaces 1 (B), 2 (C), and 3 (D), with interacting residues shown as sticks. VASH1 residues are colored yellow and labeled with black letters while α-tubulin residues are colored green and labeled with red letters.
Figure 3—figure supplement 1.
Figure 3—figure supplement 1.. Sequence alignment of VASH1 and VASH2 proteins.
Figure 4.
Figure 4.. Requirement of VASH1-microtubule interactions in α-tubulin detyrosination.
(A,B) Tubulin detyrosination assays of VASH1-SVBP WT or mutants in human cells. HeLa Tet-On cells were co-transfected with Myc-VASH1 WT or mutants and Myc-SVBP WT plasmids. At 24 hr post-transfection, the cells were treated without (A) or with 5 µM Nocodazole (B) for 1 hr. The cell lysates were blotted with the indicated antibodies. Compared with VASH1 WT, VASH1 mutants with multiple glutamate substitutions had slightly slower mobilities. The mobility shift is likely caused by the introduction of multiple negative charges, akin to protein phosphorylation, which also sometimes retards gel mobility. deY-tubulin, detyrosinated α-tubulin. 3E, R234E/R299E/L303E. Experiments were repeated three times with similar results. (C–E) In vitro detyrosination of GMPCPP-stabilized human microtubules (C), the C-terminal peptide of α-tubulin (CTα) fused to GST (D), or free αβ-tubulin heterodimers (E) by the indicated recombinant VASH1–SVBP WT or mutant complexes. Experiments were repeated at least three times with similar results. (F) Coomassie-stained gel of microtubule pelleting assays of VASH1-SVBP WT and mutant complexes. (G) Model of microtubule lattice binding, substrate recognition, and tubulin detyrosination by VASH1-SVBP. The ‘+’ signs indicate positive charges.
Figure 4—figure supplement 1.
Figure 4—figure supplement 1.. Requirement of microtubule-VASH1 interactions in α-tubulin detyrosination.
(A–E) Quantification of the relative detyrosination levels of α-tubulin in Figure 4A (A), 4B (B), 4C (C), 4D (D), and 4E (E). Mean ± s.d.; n = 3 independent experiments. (F) Quantification of the percentage of VASH1-SVBP bound to microtubules in Figure 4F. Mean ± s.d.; n = 3 independent experiments. Significance calculated using two-tailed student’s t-test; between WT and mutants; *p < 0.05, **p < 0.01 ***p < 0.001, and ****p < 0.0001.

Similar articles

Cited by

References

    1. Adamopoulos A, Landskron L, Heidebrecht T, Tsakou F, Bleijerveld OB, Altelaar M, Nieuwenhuis J, Celie PHN, Brummelkamp TR, Perrakis A. Crystal structure of the tubulin tyrosine carboxypeptidase complex VASH1-SVBP. Nature Structural & Molecular Biology. 2019;26:567–570. doi: 10.1038/s41594-019-0254-6. - DOI - PubMed
    1. Adams PD, Afonine PV, Bunkóczi G, Chen VB, Davis IW, Echols N, Headd JJ, Hung LW, Kapral GJ, Grosse-Kunstleve RW, McCoy AJ, Moriarty NW, Oeffner R, Read RJ, Richardson DC, Richardson JS, Terwilliger TC, Zwart PH. PHENIX: a comprehensive Python-based system for macromolecular structure solution. Acta Crystallographica Section D Biological Crystallography. 2010;66:213–221. doi: 10.1107/S0907444909052925. - DOI - PMC - PubMed
    1. Aillaud C, Bosc C, Peris L, Bosson A, Heemeryck P, Van Dijk J, Le Friec J, Boulan B, Vossier F, Sanman LE, Syed S, Amara N, Couté Y, Lafanechère L, Denarier E, Delphin C, Pelletier L, Humbert S, Bogyo M, Andrieux A, Rogowski K, Moutin MJ. Vasohibins/SVBP are tubulin carboxypeptidases (TCPs) that regulate neuron differentiation. Science. 2017;358:1448–1453. doi: 10.1126/science.aao4165. - DOI - PubMed
    1. Badin-Larçon AC, Boscheron C, Soleilhac JM, Piel M, Mann C, Denarier E, Fourest-Lieuvin A, Lafanechère L, Bornens M, Job D. Suppression of nuclear oscillations in Saccharomyces cerevisiae expressing glu tubulin. PNAS. 2004;101:5577–5582. doi: 10.1073/pnas.0307917101. - DOI - PMC - PubMed
    1. Barisic M, Silva e Sousa R, Tripathy SK, Magiera MM, Zaytsev AV, Pereira AL, Janke C, Grishchuk EL, Maiato H. Microtubule detyrosination guides chromosomes during mitosis. Science. 2015;348:799–803. doi: 10.1126/science.aaa5175. - DOI - PMC - PubMed

Publication types