Review
. 2020 Nov;36(11):857-867.
doi: 10.1016/j.tig.2020.07.006. Epub 2020 Aug 6.

Alternative Applications of Genotyping Array Data Using Multivariant Methods

Affiliations
Review

Alternative Applications of Genotyping Array Data Using Multivariant Methods

David C Samuels et al. Trends Genet. 2020 Nov.

Abstract

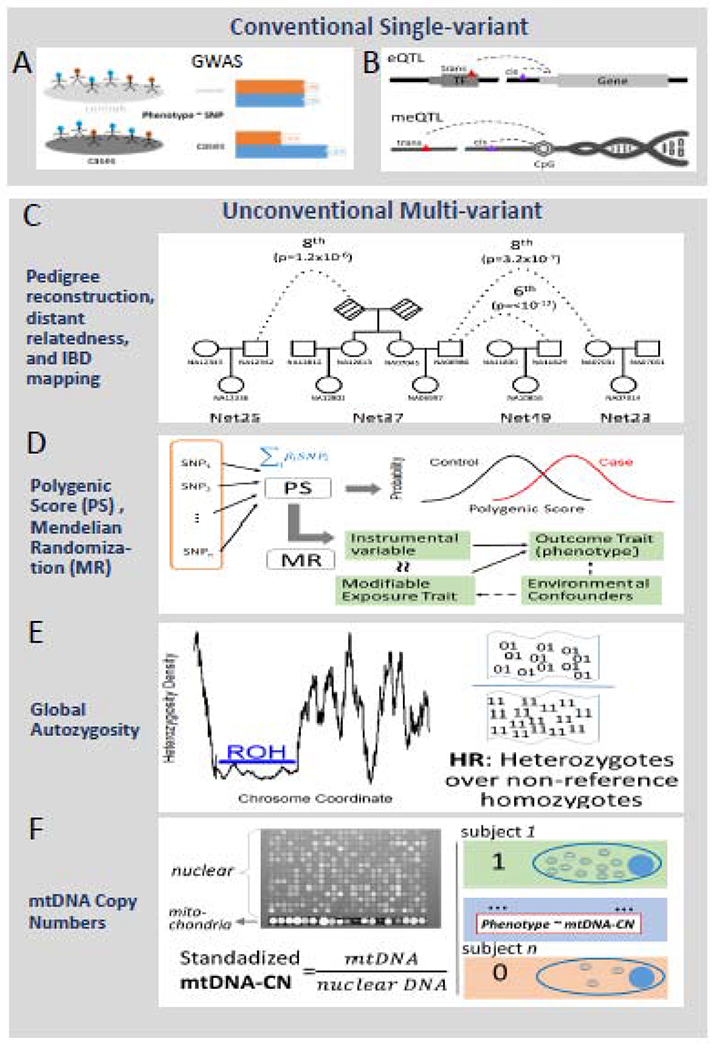
One of the forerunners that pioneered the revolution of high-throughput genomic technologies is the genotyping microarray technology, which can genotype millions of single-nucleotide variants simultaneously. Owing to apparent benefits, such as high speed, low cost, and high throughput, the genotyping array has gained lasting applications in genome-wide association studies (GWAS) and thus accumulated an enormous amount of data. Empowered by continuous manufactural upgrades and analytical innovation, unconventional applications of genotyping array data have emerged to address more diverse genetic problems, holding promise of boosting genetic research into human diseases through the re-mining of the rich accumulated data. Here, we review several unconventional genotyping array analysis techniques that have been built on the idea of large-scale multivariant analysis and provide empirical application examples. These unconventional outcomes of genotyping arrays include polygenic score, runs of homozygosity (ROH)/heterozygosity ratio, distant pedigree computation, and mitochondrial DNA (mtDNA) copy number inference.


Figures

Figure 1:
Figure 1:
Momentum of genotype-centric studies/data in GWAS and post-GWAS era (1998-2019). Despite a declining trend past the peak year 2015, genotyping array based publications still largely surpass exome sequencing based publications in quantity. The growth of dbSNP is in line with the growth of genotyping and exome sequencing publications. The left y-axis denotes the number of publications (red), right y-axis denotes number of SNPs in dbSNP (blue), and x-axis denotes the year. When searching for genotyping array manuscripts, key words “genotyping array” or “SNP array” were used. When searching for exome sequencing manuscripts, key word “exome sequencing” was used.
Figure 2:
Figure 2:
The overall concept of unconventional multi-variant approaches. The top panel of two horizontally arranged charts describes the most conventional single variant usage of SNP data which includes A) GWAS and B) eQTL/meQTL analysis. Of note, technically, eQTL and meQTL can be extended to a multi-variant manner, because multiple SNPs can be used to predict gene expression or methylation to increase accuracy. The bottom panel of four vertically arranged charts describes four major multi-variant methods in this review. From top to bottom, there are distant pedigree reconstruction, polygenic score with Mendelian randomization, global autozygosity, and mtDNA copy number. C) Pedigees and distant relationships that can be reconstructed from estimates of pairwise relatedness and leveraged in analysis of geneaology, population demographics and history, estimates of heritability, and family based disease gene mapping approaches. D) Polygenic scores are constructed from multiple SNPs with weights from previous GWAS studies. The polygenic score is essentially a genetic trait which can be used as standard case-control studies as demonstrated by the two normal distribution density curves. Or it can be used for Mendelian randomization studies. E) For global autozygosity, there are two major measurements, one for homozygosity as in Runs of Homozygosity and another for heterozygosity as in heterozygosity ratio. Runs of homozygosity describes long segments of the genome with no heterozygous SNPs as demonstrated in the genome coordinate vs heterozygosity density plot. The heterozygosity ratio is demonstrated as the ratio between the number of heterozygous SNP (“01”) vs the number of non-reference homozygous SNPs (“11”). F) The mitochondria copy number can be inferred from fluorescent intensity. Typically, the mitochondria probes have stronger signals than nuclear probes as demonstrated in the microarray figure. Based on this fact, the relative mtDNA copy number can be estimated and it can be further analyzed for association with a phenotype trait.

References

    1. Buniello A et al. (2019) The NHGRI-EBI GWAS Catalog of published genome-wide association studies, targeted arrays and summary statistics 2019. Nucleic Acids Res 47 (D1), D1005–D1012. - PMC - PubMed
    1. Guo Y et al. (2014) Illumina human exome genotyping array clustering and quality control. Nat Protoc 9 (11), 2643–62. - PMC - PubMed
    1. Das S et al. (2016) Next-generation genotype imputation service and methods. Nat Genet 48 (10), 1284–1287. - PMC - PubMed
    1. Grove ML et al. (2013) Best practices and joint calling of the HumanExome BeadChip: the CHARGE Consortium. PLoS One 8 (7), e68095. - PMC - PubMed
    1. Zhao S et al. (2018) Strategies for processing and quality control of Illumina genotyping arrays. Brief Bioinform 19 (5), 765–775. - PMC - PubMed

Publication types