. 2020 Sep 1;130(9):4811-4830.
doi: 10.1172/JCI134214.

Osteocyte necrosis triggers osteoclast-mediated bone loss through macrophage-inducible C-type lectin

Affiliations

Osteocyte necrosis triggers osteoclast-mediated bone loss through macrophage-inducible C-type lectin

Darja Andreev et al. J Clin Invest. .

Abstract

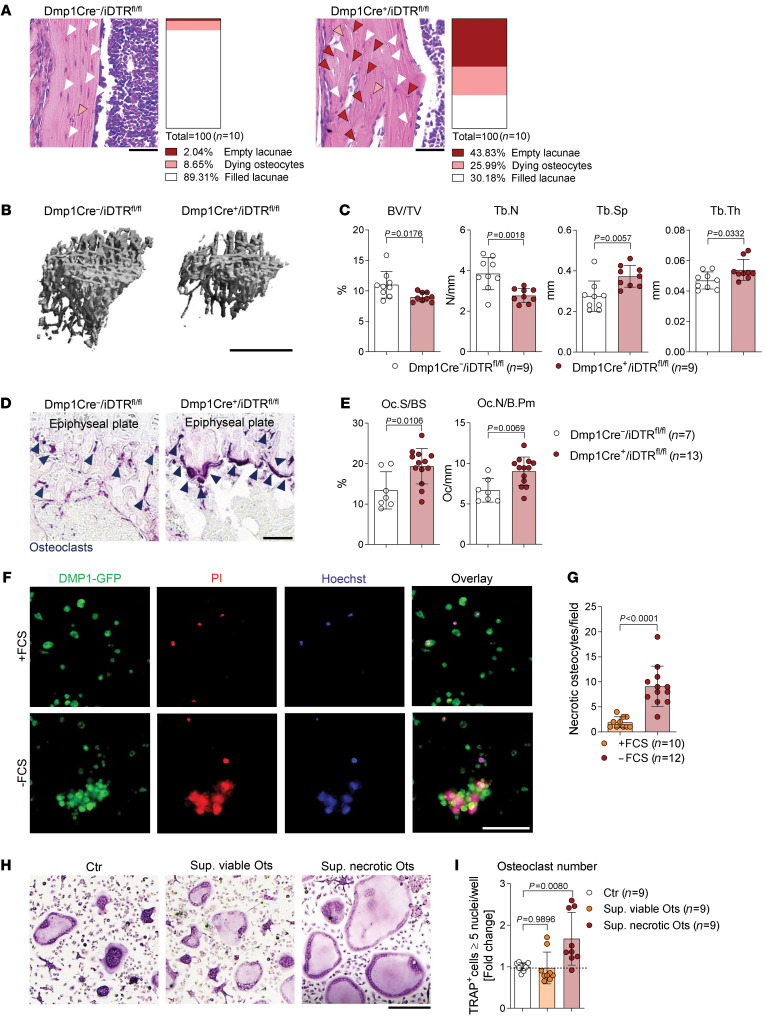
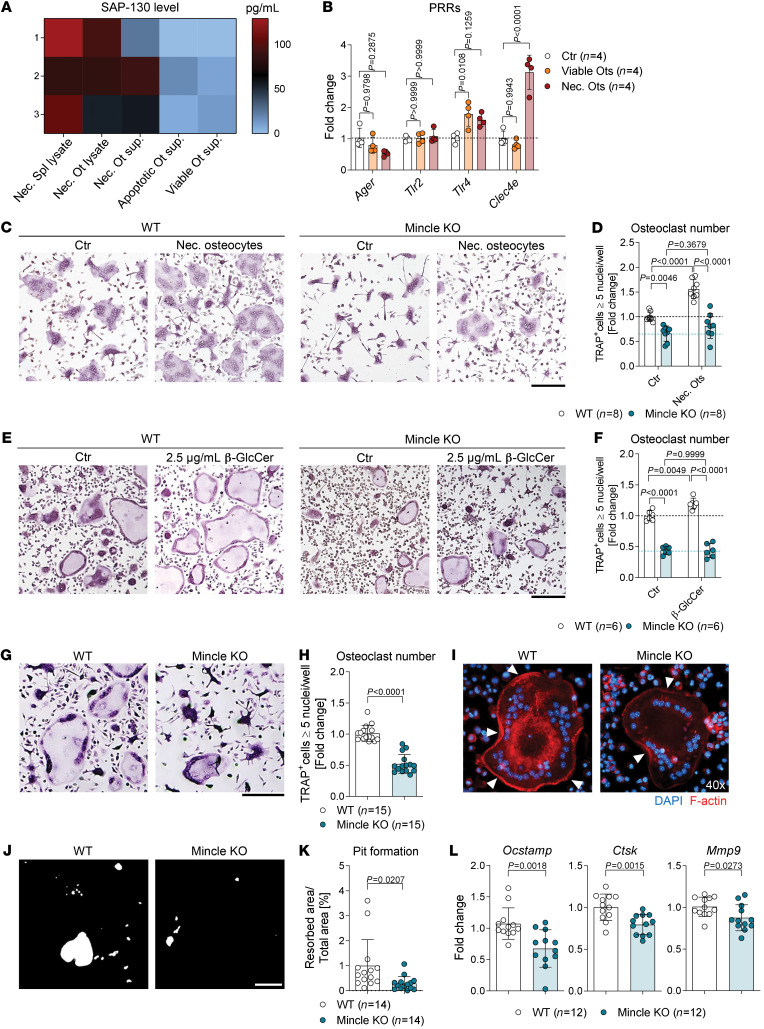
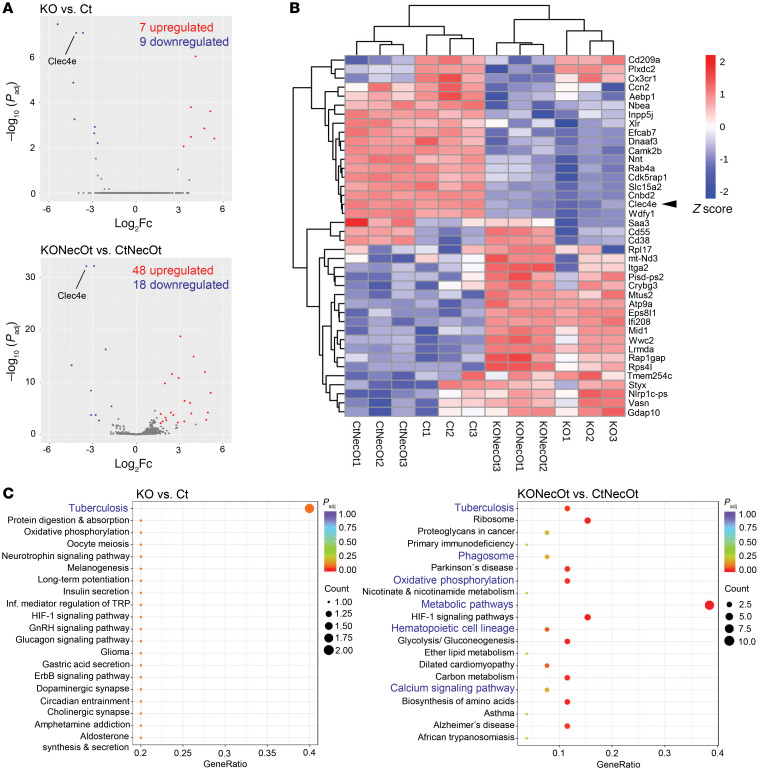
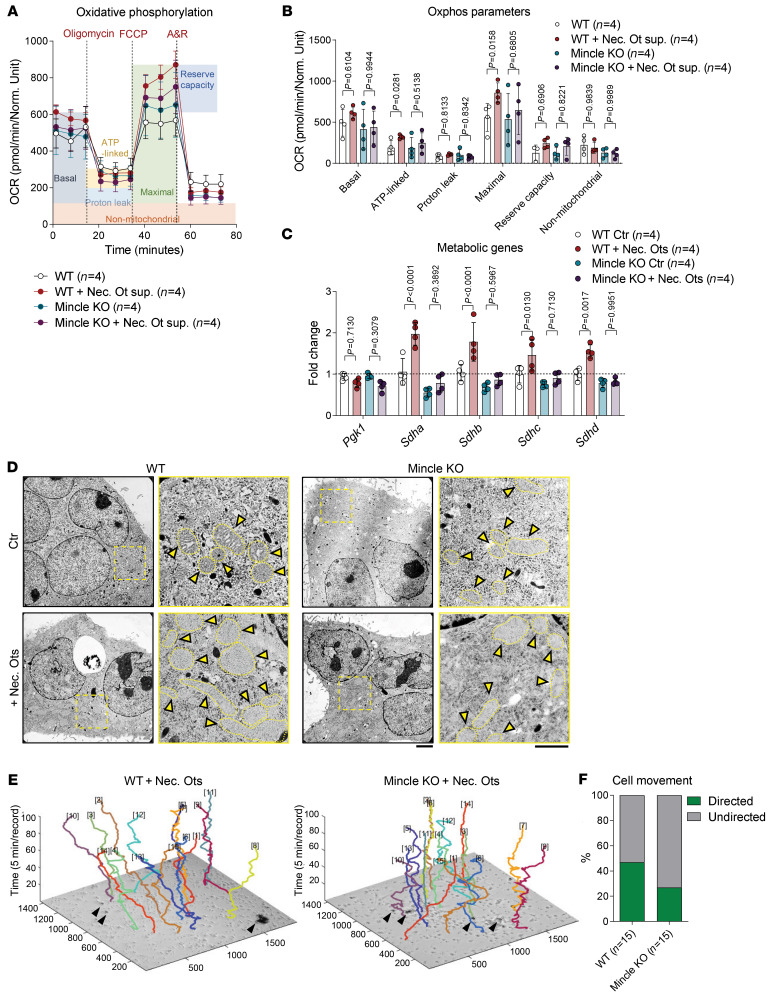
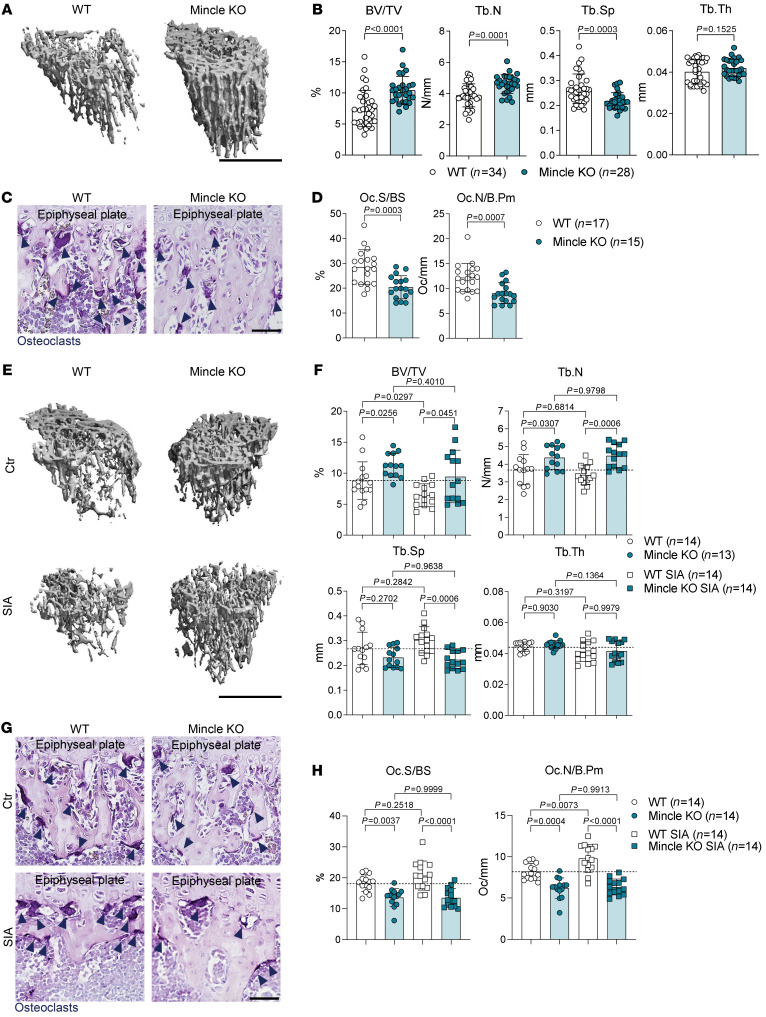
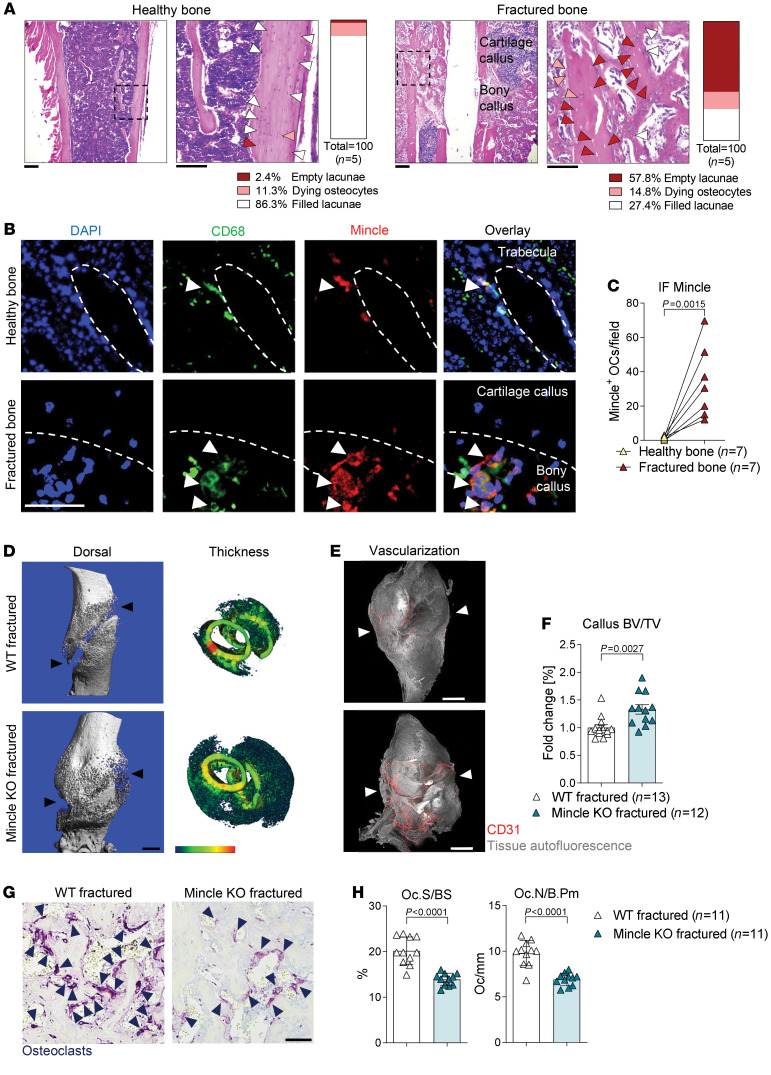
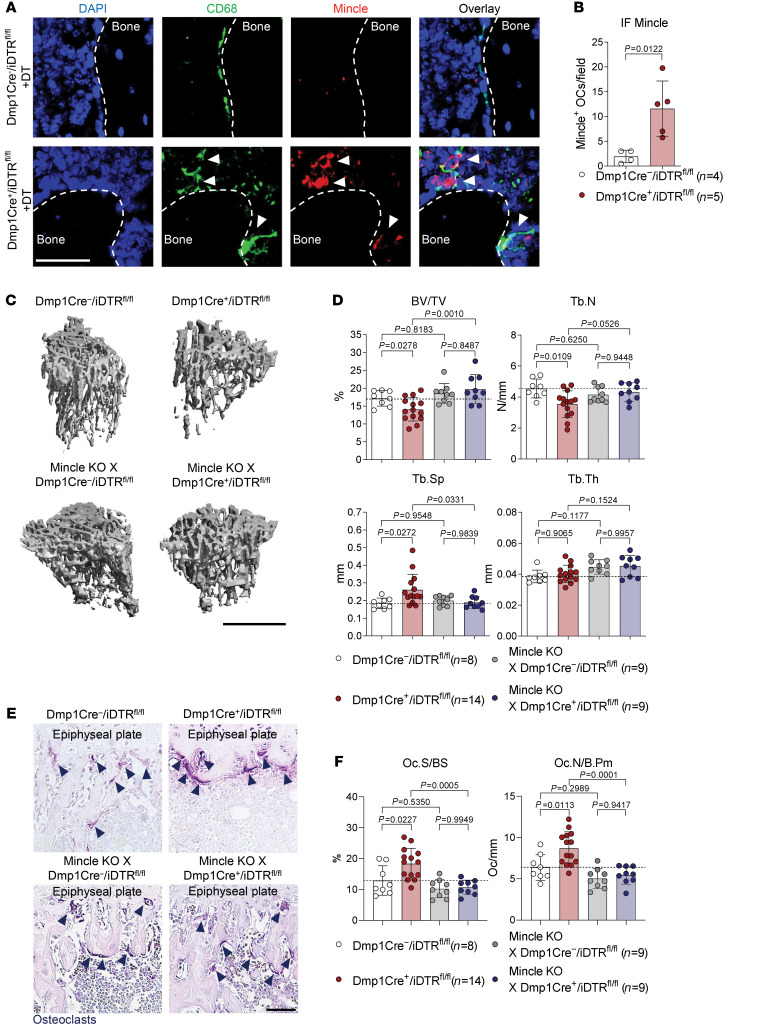
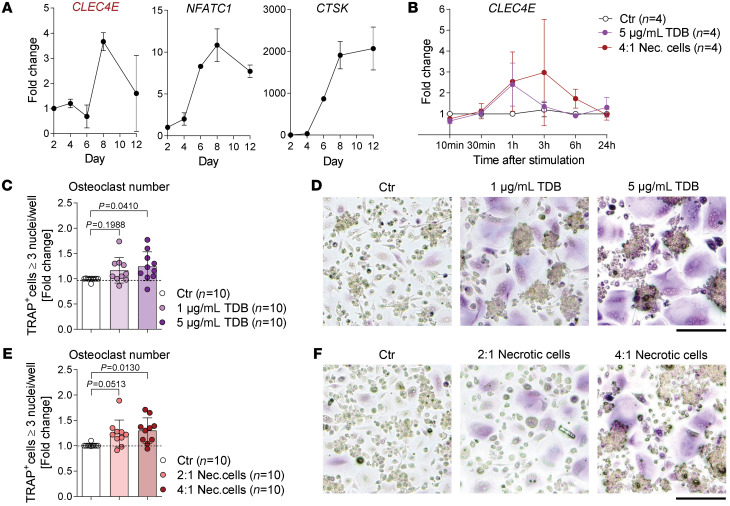
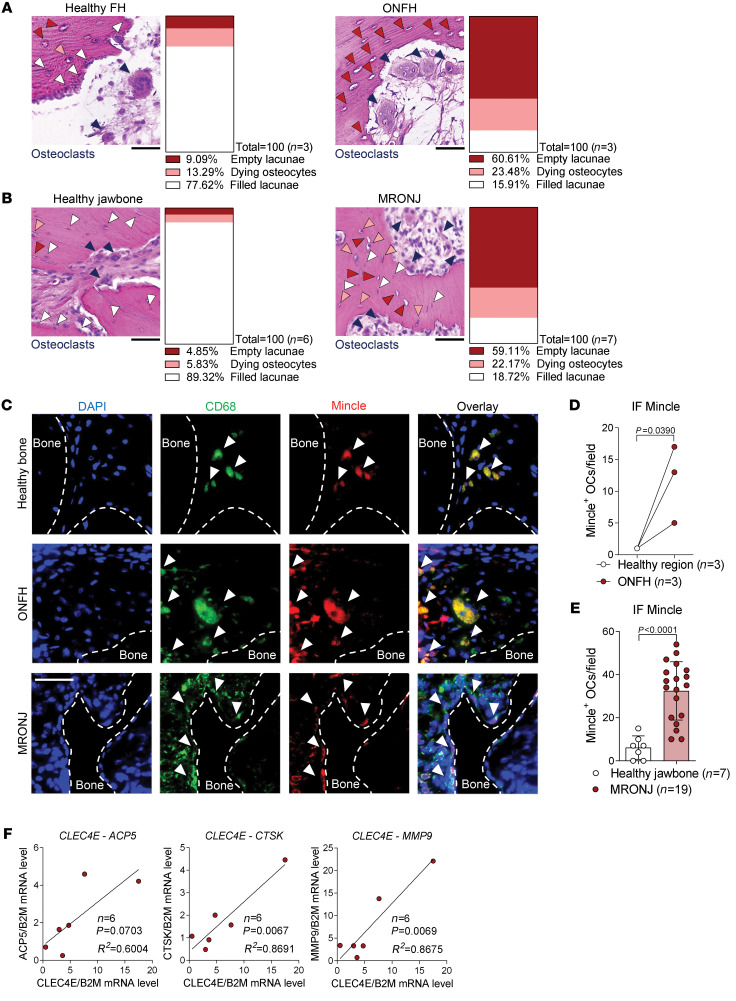
Although the control of bone-resorbing osteoclasts through osteocyte-derived RANKL is well defined, little is known about the regulation of osteoclasts by osteocyte death. Indeed, several skeletal diseases, such as bone fracture, osteonecrosis, and inflammation are characterized by excessive osteocyte death. Herein we show that osteoclasts sense damage-associated molecular patterns (DAMPs) released by necrotic osteocytes via macrophage-inducible C-type lectin (Mincle), which induced their differentiation and triggered bone loss. Osteoclasts showed robust Mincle expression upon exposure to necrotic osteocytes in vitro and in vivo. RNA sequencing and metabolic analyses demonstrated that Mincle activation triggers osteoclastogenesis via ITAM-based calcium signaling pathways, skewing osteoclast metabolism toward oxidative phosphorylation. Deletion of Mincle in vivo effectively blocked the activation of osteoclasts after induction of osteocyte death, improved fracture repair, and attenuated inflammation-mediated bone loss. Furthermore, in patients with osteonecrosis, Mincle was highly expressed at skeletal sites of osteocyte death and correlated with strong osteoclastic activity. Taken together, these data point to what we believe is a novel DAMP-mediated process that allows osteoclast activation and bone loss in the context of osteocyte death.

Keywords: Bone Biology; Bone disease; Immunology; Osteoclast/osteoblast biology; Osteoporosis.


Conflict of interest statement

Conflict of interest: The authors have declared that no conflict of interest exists.

Figures

Figure 1
Figure 1. Osteocyte necrosis triggers osteoclastogenesis.
(A) Representative pictures of hematoxylin and eosin (H&E) staining of tibial bones showing induced ablation of osteocytes in 9-week-old Dmp1-Cre+/iDTRfl/fl mice compared with Dmp1-Cre/iDTRfl/fl littermate controls, 4 days after i.p. injection with 100 ng diphtheria toxin (DT) (n = 10/group). White arrows indicate filled lacunae, orange arrows dying osteocytes, and red arrows empty lacunae. Scale bars: 50 μm. (B) Representative micro–computed tomography (μCT) images of Dmp1-Cre+/iDTRfl/fl tibias compared with Dmp1-Cre/iDTRfl/fl littermate controls and (C) quantification of bone volume per total volume (BV/TV), trabecular number (Tb.N), trabecular separation (Tb.Sp), and trabecular thickness (Tb.Th) (n = 9/group). Scale bar: 1 mm. (D) Representative TRAP staining in tibial sections of the aforementioned 2 groups. Dark blue arrows indicate the purple-stained osteoclasts. Scale bar: 50 μm. (E) Histomorphometric quantification of osteoclast surface per bone surface (Oc.S/BS) and osteoclast number per bone perimeter (Oc.N/B.Pm) in the tibia of the aforementioned 2 groups (n = 7–13/group). (F) Representative images of DMP1-GFP–positive (green) starved osteocytes (24 hours without fetal calf serum, FCS) compared with viable osteocytes (24 hours with FCS), stained for necrosis with PI (red) and Hoechst (blue). Scale bar: 100 μm. (G) Quantification of necrotic osteocytes after serum starvation (24 hours) compared with serum-supplemented controls (n = 10–12/group). (H) Representative pictures and (I) quantification of TRAP-positive polynucleated (≥5 nuclei) WT osteoclasts, supplemented with supernatant from viable (+FCS) or necrotic (–FCS) osteocytes (Ots) (1:2) on day 1 of culture for 24 hours, compared with a nonsupplemented control (n = 9/group). Scale bar: 200 μm. Data are shown as mean ± SD. P values were determined by 2-tailed Student’s t test for single comparisons (C, E, and G) or 1-way ANOVA for multiple comparisons (I).
Figure 2
Figure 2. Necrotic osteocyte–derived DAMPs induce osteoclastogenesis in a Mincle-dependent manner.
(A) Heatmap of the SAP-130 levels in lysates of necrotic splenocytes and osteocytes (Ots) and in the supernatants of viable, apoptotic, and starved osteocytes (n = 3/group). (B) Gene expression of Ager, Tlr2, Tlr4, and Clec4e in WT osteoclasts, stimulated with viable or necrotic osteocytes (1:2) on day 1 of culture for 24 hours, compared with unstimulated control (n = 4/group). (C) Representative images and (D) quantification of TRAP-positive polynucleated (≥5 nuclei) WT and Mincle-KO osteoclasts, supplemented with necrotic osteocytes (1:2) for 24 hours on day 1 of culture, compared with unstimulated controls (n = 8/group). Scale bar: 200 μm. (E) Representative pictures and (F) quantification of TRAP-positive polynucleated (≥5 nuclei) WT and Mincle-KO osteoclasts, supplemented with 2.5 μg/mL β-glycosylceramide (β-GlcCer) for 24 hours on day 1 of culture, compared with nonsupplemented controls (n = 6/group). Scale bar: 200 μm. (G) Representative pictures and (H) quantification of TRAP-positive polynucleated (≥5 nuclei) osteoclasts derived from Mincle-KO compared with WT mice (n = 15/group). Scale bar: 200 μm. (I) Immunofluorescence microscopy of WT and Mincle-KO osteoclasts, stained with DAPI (blue) and for F-actin (red). White arrows illustrate the F-actin ring. Original magnification, ×40. (J) Representative pictures of resorption assay and (K) quantification of the percentage of the resorbed area by Mincle-KO compared with WT osteoclasts (n = 14/group). Scale bar: 200 μm. (L) Gene expression analysis of Ocstamp, Ctsk, and Mmp9 in Mincle-KO compared with WT osteoclasts (n = 12/group). Data are shown as mean ± SD. P values were determined by 2-way ANOVA for multiple comparisons (B, D, and F; interaction P value: <0.0001 for B, 0.0038 for D, and 0.0116 for F) or 2-tailed Student’s t test for single comparisons (H, K, and L).
Figure 3
Figure 3. DAMP/Mincle axis alters osteoclast gene networks affecting calcium signaling and cell metabolism.
RNA sequencing was performed with the following 4 groups (3 replicates per group): Ct (WT osteoclasts, control condition); KO (Mincle-KO osteoclasts, control condition); CtNecOt (WT osteoclasts stimulated on day 1 for 24 hours with 1:2 necrotic osteocyte supernatant); and KONecOt (Mincle-KO osteoclasts stimulated on day 1 for 24 hours with 1:2 necrotic osteocyte supernatant). (A) Volcano plots showing the altered gene expression between the groups KO vs. Ct and KONecOt vs. CtNecOt. Statistically significantly upregulated genes are red and downregulated genes are blue. (B) Heatmap showing the H-clusters of 40 differentially expressed genes between the aforementioned 4 groups. (C) KEGG enrichment analysis showing significantly affected pathways, comparing the groups KO vs. Ct and KONecOt vs. CtNecOt. Genes with an adjusted P value (Padj) less than 0.05 were assigned as differentially expressed. Pathways with Padj less than 0.05 were considered significantly enriched.
Figure 4
Figure 4. DAMP/Mincle axis skews metabolic activity of osteoclasts to oxidative phosphorylation and directs osteoclast migration.
(A) Oxygen consumption rate (OCR) profile plot and (B) mitochondrial function parameters analyzed by extracellular flux assay in osteoclasts from WT and Mincle-KO mice, which were supplemented with necrotic osteocyte (Ot) supernatant (1:2) for 24 hours on day 1 of culture, compared with nonsupplemented controls (n = 4/group). A&R, antimycin A and rotenone. (C) Gene expression analysis of metabolic markers Pgk1, Sdha, Sdhb, Sdhc, and Sdhd in osteoclasts from WT and Mincle-KO mice, which were supplemented with necrotic osteocytes (1:2) for 24 hours on day 1 of culture, compared with controls (n = 4/group). (D) Transmission electron microscopy (TEM) images of WT and Mincle-KO osteoclasts, supplemented on day 1 for 24 hours with necrotic osteocytes (1:2), compared with nonsupplemented controls. Yellow arrows show mitochondrial cristae within the cells. Scale bars: 2.6 μm (low-power images, left columns) and 1.21 μm (high-power images, right columns). (E) 3D track plots of the recorded movement of WT and Mincle-KO osteoclasts within 500 minutes (recorded every 5 minutes) after stimulation with necrotic osteocytes. Black arrows show necrotic osteocytes. (F) Percentage of WT and Mincle-KO osteoclasts moving toward necrotic osteocytes in a directed way or moving without direction (n = 15/group). Data are shown as mean ± SD. P values were determined by 2-way ANOVA for multiple comparisons (B and C; interaction P value: 0.7410 for B and <0.0001 for C).
Figure 5
Figure 5. Mincle-KO mice exhibit high bone mass due to reduced osteoclast numbers and are protected from inflammation-mediated systemic bone loss.
(A) Representative μCT images of tibial bones from 9-week-old WT controls and Mincle-KO mice and (B) quantification of BV/TV, Tb.N, Tb.Sp, and Tb.Th (n = 28–34/group). Scale bar: 1 mm. (C) Representative images and (D) histomorphometric quantification of Oc.S/BS and Oc.N/B.Pm in TRAP-positive tibial sections of WT and Mincle-KO mice (n = 15–17/group). Dark blue arrows indicate the purple-stained osteoclasts. Scale bar: 50 μm. (E) Representative μCT images and (F) quantification of BV/TV, Tb.N, Tb.Sp, and Tb.Th in tibial bones of 9-week-old WT and Mincle-KO mice, 9 days after serum-induced arthritis (SIA), compared with nonarthritic controls (n = 13–14/group). Scale bar: 1 mm. (G) Representative TRAP staining of tibial sections from the aforementioned 4 groups. Dark blue arrows indicate the purple-stained osteoclasts. Scale bar: 50 μm. (H) Histomorphometric quantification of Oc.S/BS and Oc.N/B.Pm in tibial bones of the aforementioned 4 groups (n = 14/group). Data are shown as mean ± SD. P values were determined by 2-tailed Student’s t test for single comparisons (B and D) or 1-way ANOVA for multiple comparisons (F and H).
Figure 6
Figure 6. Mincle-KO mice show improved fracture healing.
(A) Representative pictures of H&E staining of femoral bone 14 days after fracture compared with healthy tibial bone at 14 weeks of age. Scale bars: 200 μm (left) and 100 μm (right). Quantification of filled lacunae (white arrows), dying osteocytes (orange arrows), and empty lacunae (red arrows) (n = 5/group). (B) Immunofluorescence (IF) staining for CD68 (green) and Mincle (red) and DAPI staining (blue) in unaffected tibial bones compared with fractured femoral bones. White arrows indicate Mincle-positive osteoclasts. Scale bar: 50 μm. (C) Quantification of Mincle-positive osteoclasts (OCs) (n = 7/group). (D) Representative μCT images of femoral bones of WT and Mincle-KO mice, 14 days after fracture at 14 weeks of age, showing the dorsal view and the thickness of the fracture callus. Black arrows show the fracture gap. Scale bar: 1 mm. (E) Light-sheet fluorescence microscopy (LSFM) of vascularization (CD31, red) in the callus (autofluorescence, gray) of the aforementioned 2 groups. Scale bar: 1 mm. (F) Quantification of BV/TV in the fracture callus of the aforementioned 2 groups (n = 12–13/group). (G) Representative TRAP staining in the bone callus of WT and Mincle-KO mice. Dark blue arrows indicate the purple-stained osteoclasts. Scale bar: 50 μm. (H) Histomorphometric quantification of Oc.S/BS and Oc.N/B.Pm in the hard callus of Mincle-KO compared with WT mice (n = 11/group). Data are shown as mean ± SD. P values were determined by 2-tailed Student’s t test for single comparisons (C, F, and H).
Figure 7
Figure 7. Mincle signaling is required for bone resorption upon osteocyte death.
(A) Immunofluorescence (IF) microscopy of CD68 (green) and Mincle (red) and DAPI staining (blue), and (B) quantification of Mincle-positive osteoclasts in tibial bones of 9-week-old Dmp1-Cre+/iDTRfl/fl mice compared with Dmp1-Cre/iDTRfl/fl littermate controls, 4 days after i.p. injection with 100 ng DT (n = 4–5/group). White arrows show CD68+Mincle+ cells near the bone surface. Scale bar: 50 μm. (C) Representative μCT images of tibial bones of 9-week-old Mincle-deficient Dmp1-Cre/iDTRfl/fl and Dmp1-Cre+/iDTRfl/fl mice, compared with Mincle-competent Dmp1-Cre/iDTRfl/fl littermate controls and Dmp1-Cre+/iDTRfl/fl mice, 4 days after i.p. injection with 100 ng DT and (D) quantification of BV/TV, Tb.N, Tb.Sp, and Tb.Th (n = 8–14/group). Scale bar: 1 mm. (E) Representative TRAP staining of tibial bone sections from the 4 aforementioned groups. Dark blue arrows indicate purple-stained osteoclasts. Scale bar: 50 μm. (F) Histomorphometric quantification of Oc.S/BS and Oc.N/B.Pm in tibial bone from the 4 aforementioned groups (n = 8–14/group). Data are shown as mean ± SD. P values were determined by 2-tailed Student’s t test for single comparisons (B) or 1-way ANOVA for multiple comparisons (D and F).
Figure 8
Figure 8. Mincle regulates human osteoclastogenesis.
(A) Gene expression analysis of CLEC4E and the osteoclast markers NFATC1 and CTSK in osteoclasts, differentiated from human monocytes and analyzed on days 2, 4, 6, 8, and 12 of osteoclastogenesis. (B) Gene expression analysis of CLEC4E in human osteoclasts (day 5 of culture) 10 minutes, 30 minutes, 1 hour, 3 hours, 6 hours, and 24 hours after stimulation with 5 μg/mL TDB or with necrotic cells (PBMCs; 4:1 ratio), compared with a nonstimulated control (n = 4/group). (C) Quantification and (D) representative pictures of TRAP-positive human polynucleated (≥3 nuclei) osteoclasts, supplemented with 1 μg/mL or 5 μg/mL TDB for 24 hours on day 5 of culture, compared with a nonsupplemented control (n = 10/group). Scale bar: 50 μm. (E) Quantification and (F) representative pictures of TRAP-positive human polynucleated (≥3 nuclei) osteoclasts, supplemented with 2:1 or 4:1 necrotic PBMCs for 24 hours on day 5 of culture, compared with a nonsupplemented control (n = 10/group). Scale bar: 50 μm. Data are shown as mean ± SD. P values were determined by 1-way ANOVA for multiple comparisons (C and E).
Figure 9
Figure 9. Mincle-positive osteoclasts are upregulated in osteonecrotic human bone lesions.
Representative pictures of H&E staining and quantification of filled lacunae (white arrows), dying osteocytes (orange arrows), and empty lacunae (red arrows) in (A) osteonecrosis of the femoral head (ONFH) lesions (n = 3/group) and (B) medication-related osteonecrosis of the jaw (MRONJ) lesions (n = 6–7/group), compared with the corresponding healthy bone areas. Dark blue arrows indicate polynucleated osteoclasts. Scale bar: 50 μm. (C) Immunofluorescence (IF) staining of CD68 (green) and Mincle (red) and DAPI staining (blue) (white arrows show CD68+Mincle+ cells near the bone surface) in ONFH and MRONJ, compared with healthy regions. Scale bar: 50 μm. (D) Quantification of Mincle-positive osteoclasts (OCs) per field in ONFH, compared with healthy region (n = 3/group). (E) Quantification of Mincle-positive osteoclasts per field in MRONJ, compared with healthy jawbone (n = 7–19/group). (F) Correlation analyses between the mRNA expression of CLEC4E and the osteoclast markers ACP5, CTSK, and MMP9 in MRONJ samples (n = 6). Data are shown as mean ± SD. P values were determined by 2-tailed Student’s t test for single comparisons (D and E) and correlations were tested with the linear regression F test (F).

Comment in

  • Osteocyte death promotes bone loss.
    McHugh J. McHugh J. Nat Rev Rheumatol. 2020 Oct;16(10):539. doi: 10.1038/s41584-020-0498-x. Nat Rev Rheumatol. 2020. PMID: 32843737 No abstract available.

References

    1. Boyle WJ, Simonet WS, Lacey DL. Osteoclast differentiation and activation. Nature. 2003;423(6937):337–342. doi: 10.1038/nature01658. - DOI - PubMed
    1. Teitelbaum SL, Ross FP. Genetic regulation of osteoclast development and function. Nat Rev Genet. 2003;4(8):638–649. doi: 10.1038/nrg1122. - DOI - PubMed
    1. Xiong J, Onal M, Jilka RL, Weinstein RS, Manolagas SC, O’Brien CA. Matrix-embedded cells control osteoclast formation. Nat Med. 2011;17(10):1235–1241. doi: 10.1038/nm.2448. - DOI - PMC - PubMed
    1. Nakashima T, et al. Evidence for osteocyte regulation of bone homeostasis through RANKL expression. Nat Med. 2011;17(10):1231–1234. doi: 10.1038/nm.2452. - DOI - PubMed
    1. Bonewald LF. The amazing osteocyte. J Bone Miner Res. 2011;26(2):229–238. doi: 10.1002/jbmr.320. - DOI - PMC - PubMed

Publication types