. 2020 Aug 3;30(31):2002473.
doi: 10.1002/adfm.202002473. Epub 2020 May 19.

Mechanochromic and Thermochromic Sensors Based on Graphene Infused Polymer Opals

Affiliations

Mechanochromic and Thermochromic Sensors Based on Graphene Infused Polymer Opals

Izabela Jurewicz et al. Adv Funct Mater. .

Abstract

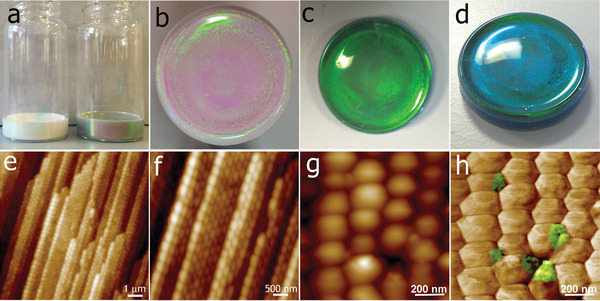
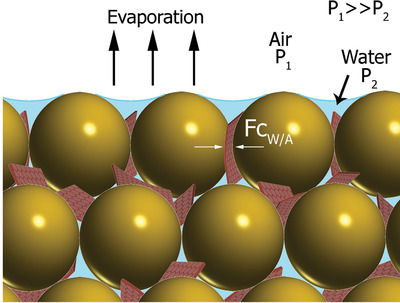
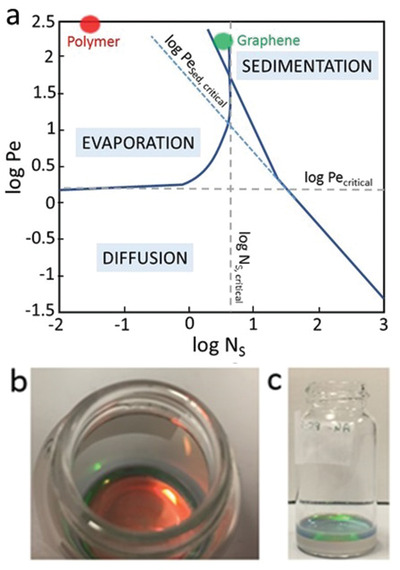
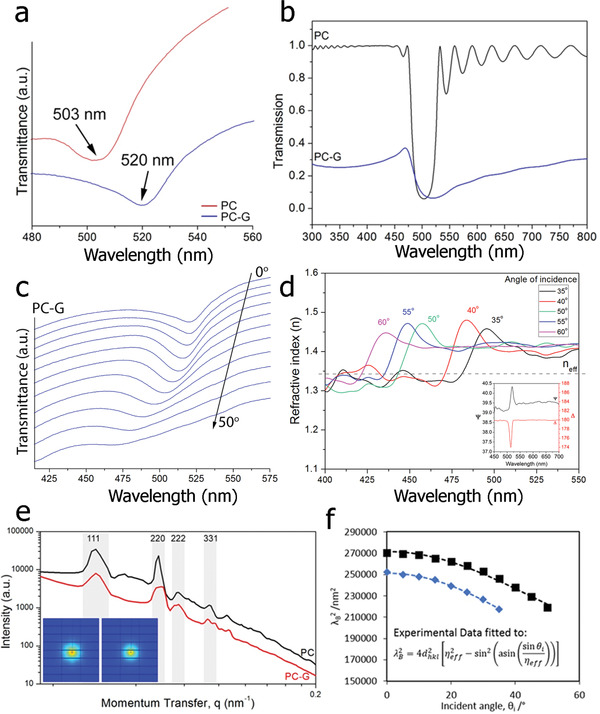
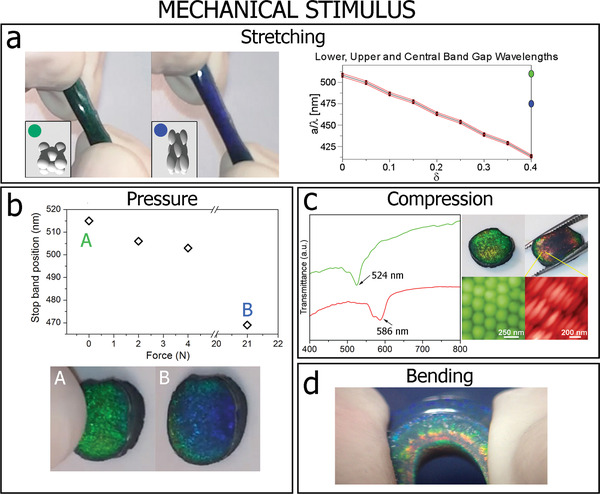
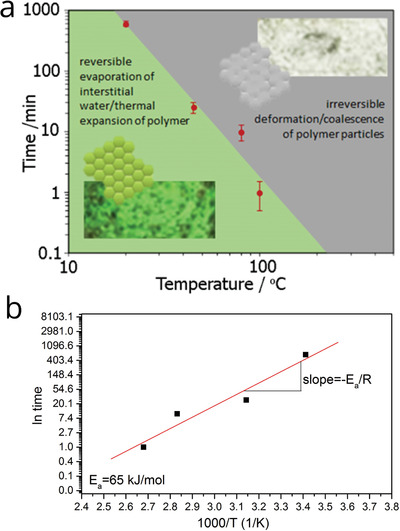
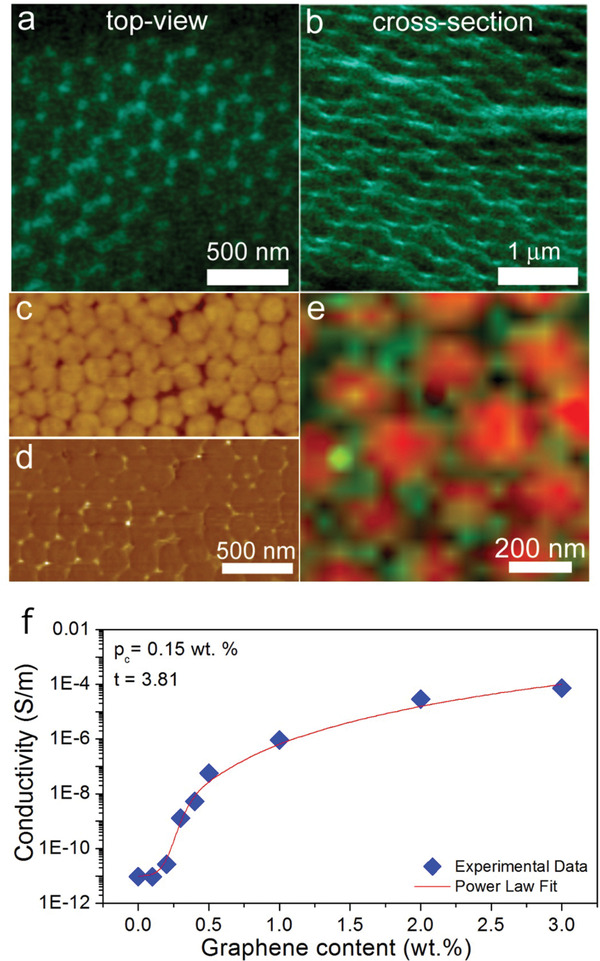
High quality opal-like photonic crystals containing graphene are fabricated using evaporation-driven self-assembly of soft polymer colloids. A miniscule amount of pristine graphene within a colloidal crystal lattice results in the formation of colloidal crystals with a strong angle-dependent structural color and a stop band that can be reversibly shifted across the visible spectrum. The crystals can be mechanically deformed or can reversibly change color as a function of their temperature, hence their sensitive mechanochromic and thermochromic response make them attractive candidates for a wide range of visual sensing applications. In particular, it is shown that the crystals are excellent candidates for visual strain sensors or integrated time-temperature indicators which act over large temperature windows. Given the versatility of these crystals, this method represents a simple, inexpensive, and scalable approach to produce multifunctional graphene infused synthetic opals and opens up exciting applications for novel solution-processable nanomaterial based photonics.

Keywords: colloidal crystals; mechanochromic sensors; pristine graphene; self‐assembly; time‐temperature indicators.


Conflict of interest statement

The authors declare no conflict of interest.

Figures

Figure 1
Figure 1
Optical images and internal microstructure of colloidal crystals enhanced with graphene. a) Photographs of wet colloidal dispersions used for photonic crystals (PC) (left) and with graphene for PC‐G (right). Representative photographs of fabricated colloidal photonic crystals: b) top‐view of a pristine PC; c) top‐view of a PC‐G; d) the same PC‐G when observed from a different viewing angle. AFM topographic images of e,f) PC‐G cross‐section showing the layered structure; g) height and h) phase images of the top surface of PC‐G showing graphene flakes (in false color) present in the interstitial sites.
Figure 2
Figure 2
Proposed mechanism for the formation of highly ordered graphene networks. Schematic representation of the pressure difference across the surface of a layer of drying colloidal film and capillary forces acting on graphene during film formation.
Figure 3
Figure 3
a) Drying regime map based on dimensionless coordinates Péclet number (Pe) and sedimentation number (Ns) (Reproduced with permission.[ 43 ] 2010, John Wiley and Sons). The red and green dots show the coordinates for the polymer particles and graphene, respectively, under the conditions used in the crystal formation. Photographs of the crystals forming during evaporation‐driven self‐assembly: b) top view, c) side view. The colored layer on the top is the assembled crystal, whereas the gray layer is the wet dispersion.
Figure 4
Figure 4
Optical properties of photonic crystals. a) Transmittance as a function of wavelength obtained at θ = 0° for a PC and PC‐G, showing significant red‐shifting of the stop‐band due to the inclusion of graphene. b) Simulated transmission from a pristine opal sample (black curve), an infiltrated opal sample with graphene spherical inclusions of radius 35 nm (blue curve). The thickness of the samples is 4000 nm. c) Variation in the transmission spectra with the angle of light incidence for the PC‐G. d) Pseudo‐refractive index n(λ) of PC‐G obtained through inversion of the ellipsometric data at different angles of light incidence. For comparison, dotted line shows the n eff obtained as shown in Figure f (inset: Ellipsometric parameters Ψ(λ) and Δ(λ) measured at an angle of incidence of 20°). e) cSAXS data for the PC (black line) and PC‐G (red line) with insets showing the diffraction rings. f) Experimental (squares and diamonds) and simulated (dashed black and blue lines) Bragg wavelengths, λB for the PC (blue diamonds) and PC‐G (black squares). The data are fitted using a linear least squares regression to the equation shown in the inset (where d hkl is the interplanar spacing, n eff is the effective refractive index and θ is the angle of incidence).
Figure 5
Figure 5
Variation in crystal morphology with deformation and the associated change in the stop band position. a) Deformation of stretchable PC‐G before (green) and during (blue) 150% elongation (Insets: Schematic representation of the variation in crystal morphology and the associated simulated change in the stop band position as a function of strain (Section S4, Supporting Information). b) Blue‐shifting of the stop band as a function of applied load. A corresponds to the PC‐G crystal before and B after the load was applied. c) Transmittance spectra for the PC‐G showing the red‐shift of the stop band when the crystal is subjected to an in‐plane compression. Optical photographs showing the PC‐G before and during macroscopic compression with corresponding AFM topographic images of microscopic particle deformation. d) Digital photograph of a PC‐G subjected to bending.
Figure 6
Figure 6
Graphene based colloidal photonic crystals for time‐temperature indicator applications. a) Time versus temperature plot showing regimes at which the interfacial structural transitions occur, resulting in an associated color change. Inset images: Optical photographs of the PC‐G crystal and schematic representation of particle boundaries showing the transition of color from green to transparent. b) Determination of activation energy for diffusion for the PC‐G crystals.
Figure 7
Figure 7
Hierarchically assembled graphene at the interstitial sites of highly ordered colloidal polymer matrix. SEM a) top view and b) cross‐section view of a composite containing 0.4 wt% of graphene showing petal‐like graphene arrangement. Corresponding AFM images showing c) topography and d) phase, respectively. e) Collage AFM/Raman map showing the composite's topography overlapped with the graphene 2‐phonon (2D) Raman band's (≈2700 cm−1) intensity. f) Electrical conductivity as a function of graphene content for graphene‐enhanced colloidal polymer composites.

References

    1. Barnard A. S., Guo H., Nature's Nanostructures, Pan Stanford Publishing, Singapore: 2012.
    1. Zhou C., Gong X., Han J., Guo R., Soft Matter 2015, 11, 2555. - PubMed
    1. Zhang J., Sun Z., Yang B., Curr. Opin. Colloid Interface Sci. 2009, 14, 103.
    1. Zhang J., Li Y., Zhang X., Yang B., Adv. Mater. 2010, 22, 4249. - PubMed
    1. Lee H. S., Shim T. S., Hwang H., Yang S.‐M., Kim S.‐H., Chem. Mater. 2013, 25, 2684.

LinkOut - more resources