. 2020 Jul 7:11:1265.
doi: 10.3389/fimmu.2020.01265. eCollection 2020.

NOD2 Deficiency Promotes Intestinal CD4+ T Lymphocyte Imbalance, Metainflammation, and Aggravates Type 2 Diabetes in Murine Model

Affiliations

NOD2 Deficiency Promotes Intestinal CD4+ T Lymphocyte Imbalance, Metainflammation, and Aggravates Type 2 Diabetes in Murine Model

Daniela Carlos et al. Front Immunol. .

Abstract

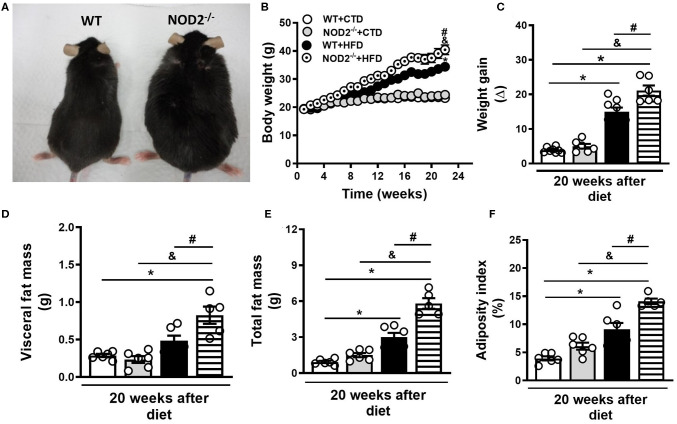
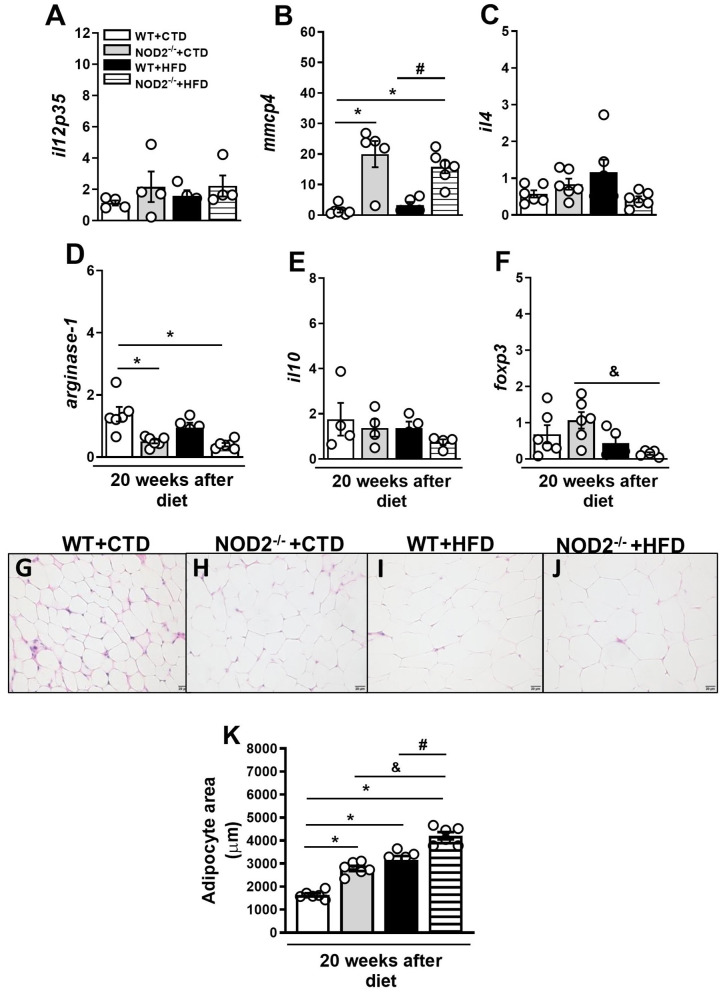
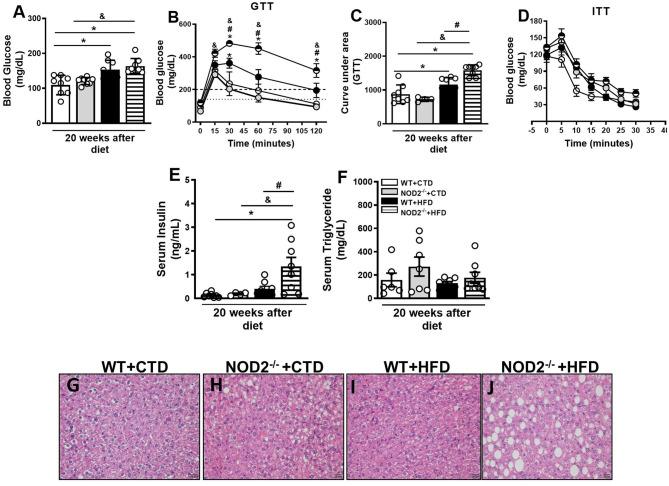
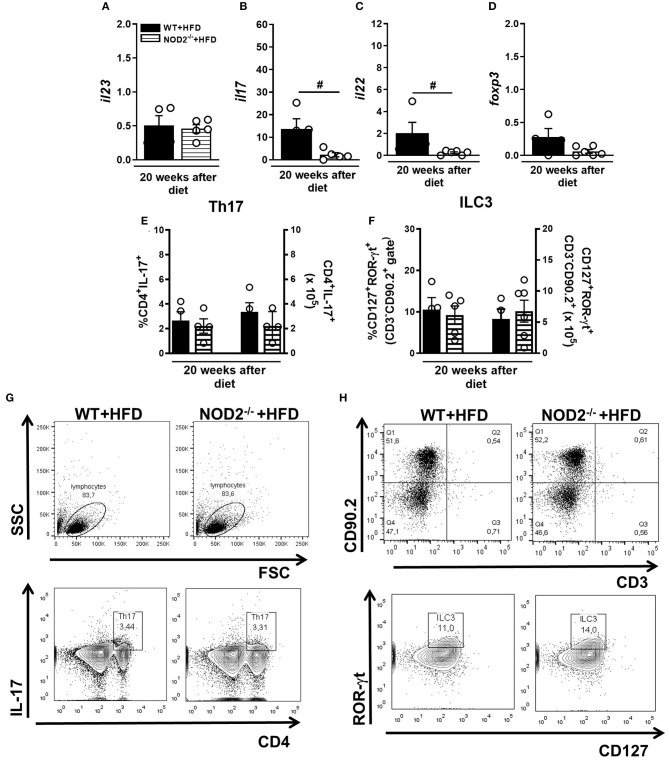
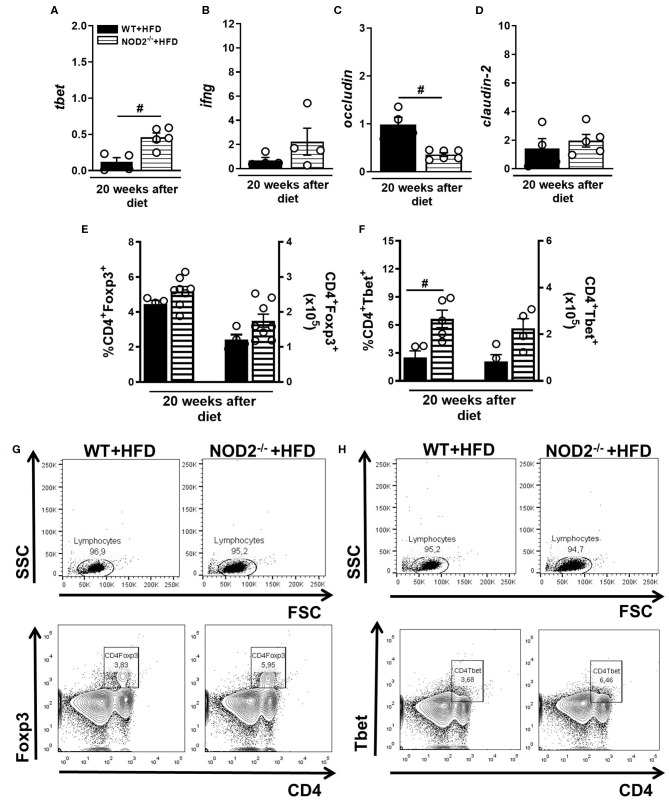
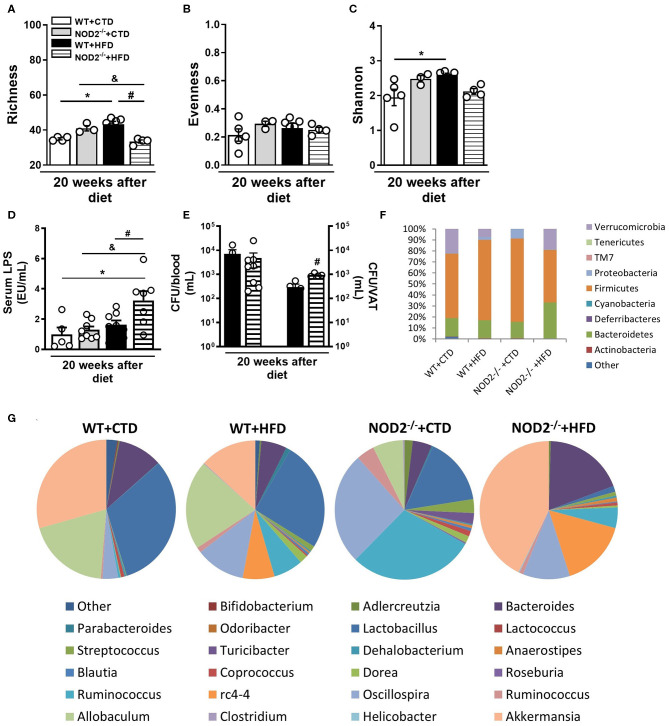
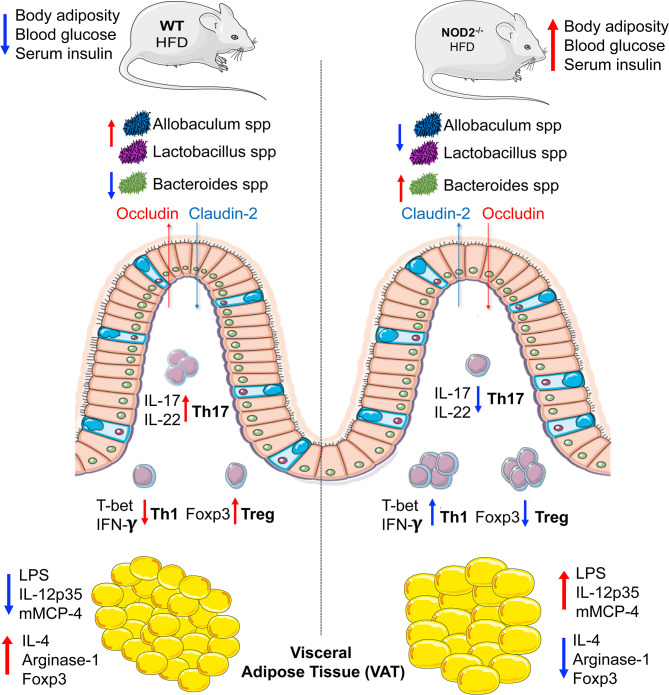
Type 2 diabetes (T2D) is a metabolic disease characterized by increased inflammation, NOD-like receptors (NLRs) activation and gut dysbiosis. Our research group has recently reported that intestinal Th17 response limits gut dysbiosis and LPS translocation to visceral adipose tissue (VAT), protecting against metabolic syndrome. However, whether NOD2 receptor contributes intestinal Th17 immunity, modulates dysbiosis-driven metabolic tissue inflammation, and obesity-induced T2D remain poorly understood. In this context, we observed that mice lacking NOD2 fed a high-fat diet (HFD) display severe obesity, exhibit greater adiposity, and more hepatic steatosis compared to HFD-fed wild-type (WT) mice. In addition, they develop increased hyperglycemia, worsening of glucose intolerance, and insulin resistance. Notably, the deficiency of NOD2 causes a deviation from M2 macrophage and regulatory T cells (Treg) to M1 macrophage and mast cells into VAT compared to WT mice fed HFD. An imbalance was also observed in Th17/Th1 cell populations, with reduced IL-17 and IL-22 gene expression in the mesenteric lymph nodes (MLNs) and ileum, respectively, of NOD2-deficient mice fed HFD. 16S rRNA sequencing indicates lower richness, alpha diversity, and a depletion of Allobaculum, Lactobacillus, and enrichment with Bacteroides genera in these mice compared to HFD-fed WT mice. These alterations were associated with disrupted tight-junctions expression, augmented serum LPS, and bacterial translocation into VAT. Overall, NOD2 activation is required for a protective Th17 over Th1 immunity in the gut, which seems to decrease gram-negative bacteria outgrowth in gut microbiota, attenuating the endotoxemia, metainflammation, and protecting against obesity-induced T2D.

Keywords: Innate immunity receptor; gut microbiota; helper T lymphocytes; metainflammation; obesity and type 2 diabetes.


Figures

Figure 1
Figure 1
Nutritional parameters of WT and NOD2−/− mice fed a CTD or a HFD. Representative images of NOD2−/− mice (right) and WT mice (left) fed a HFD (A). Body weight (B), weight gain (C), VAT mass (D), total fat mass (E), and adiposity index (F) were determined in NOD2−/− and WT mice after 20 weeks on HFD or CTD. The results are expressed as the mean ± SEM and are a compilation of 3 independent experiments (n = 5–8 mice per group). Asterisks represent statistically significant differences (*p < 0.05) compared to WT on CTD; (#p < 0.05) compared to WT on HFD; (&p < 0.05) compared to NOD2−/− mice on CTD. Significant differences between the groups were compared by one-way ANOVA followed by Tukey's multiple-comparison test.
Figure 2
Figure 2
Gene expression profile of pro- and anti-inflammatory molecules in VAT of WT and NOD2−/− mice fed a CTD or HFD. Relative expression of IL-12p35 (A), mMCP-4 (B), IL-4 (C), arginase-1 (D), IL-10 (E), and Foxp3 (F) in VAT by RT-PCR. Adipocyte hypertrophy was assessed in NOD2−/− and WT mice after 20 weeks on HFD or CTD (G–J) (original magnification 400x). (K) Morphometric quantification of adipocyte size in VAT of WT and NOD2−/− mice fed a CTD or HFD. The results are expressed as the mean ± SEM and are a compilation of 3 independent experiments (n = 4–6 per group). Asterisks represent statistically significant differences (*p < 0.05) compared to WT on CTD; (#p < 0.05) compared to WT on HFD; (&p < 0.05) compared to NOD2−/− mice on CTD. Significant differences between the groups were compared by one-way ANOVA followed by Tukey's multiple-comparison test.
Figure 3
Figure 3
Metabolic parameters and fat deposition in liver of WT and NOD2−/− mice fed a CTD or HFD. Fasting blood glucose levels (A), and glucose levels after glucose tolerance test (GTT) (B), area under the curve for the GTT (C) and insulin tolerance test (ITT) (D). Fasting insulin (E) or triglyceride (F) levels were determined in the serum. Hepatic steatosis was assessed in NOD2−/− and WT mice after 20 weeks on HFD or CTD (G–J) (original magnification 400x). The results are expressed as the mean ± SEM and are a compilation of 3 independent experiments (n = 4–8 per group). Asterisks represent statistically significant differences (*p < 0.05) compared to WT on CTD; (#p < 0.05) compared to WT on HFD; (&p < 0.05) compared to IL-23p19−/− mice on CTD. Significant differences between the groups were compared by one-way ANOVA followed by Tukey's multiple-comparison test.
Figure 4
Figure 4
Th17 and ILC3 response generation in MLN and cytokine profile in small intestine of WT and NOD2−/− fed a CTD or HFD. Relative expression of IL-23 (A), IL-17 (B), IL-22 (C) and Foxp3 (D) was assessed in NOD2−/− and WT mice after 20 weeks on HFD or CTD by RT-PCR. Percentage and absolute numbers of Th17 (CD4+IL-17+) (E) and ILC3 cells (CD127+ROR-γt+) (F) were determined in MLNs by flow cytometry. Percentages of Th17 or ILC3 are shown in representative dot plots in lymphocyte or CD3CD90.2+ gates, respectively (G,H). The results are expressed as the mean ± SEM and are a compilation of 3 independent experiments (n = 4–6). Asterisks represent statistically significant differences (*p < 0.05) compared to WT on CTD; (#p < 0.05) compared to WT on HFD; (&p < 0.05) compared to NOD2−/− mice on CTD. Significant differences between two groups were compared by Student's t-test followed Mann-Whitney test; and between more groups by one-way ANOVA followed by Tukey's multiple-comparison test.
Figure 5
Figure 5
Th1 and Treg response generation in MLN and cytokine profile in small intestine of WT and NOD2−/− mice fed a CTD or HFD. Relative expression of T-bet (A), IFN-γ (B), occludin (C) and claudin-2 (D) was assessed in NOD2−/− and WT mice after 20 weeks on HFD or CTD by RT-PCR. Percentage and absolute numbers of Treg (CD4+Foxp3+) (E) or Th1 cells (CD4+T-bet+) (F) were determined in MLNs by flow cytometry. Percentages of Treg or Th1 are shown in representative dot plots in lymphocyte gate (G,H). The results are expressed as the mean ± SEM and are a compilation of 3 independent experiments (n = 4–8). Asterisks represent statistically significant differences (*p < 0.05) compared to WT on CTD; (#p < 0.05) compared to WT on HFD; (&p < 0.05) compared to NOD2−/− mice on CTD. Significant differences between two groups were compared by Student's t-test followed Mann-Whitney test; and between more groups by one-way ANOVA followed by Tukey's multiple-comparison test.
Figure 6
Figure 6
Gut microbiota composition, intestinal permeability and bacterial translocation in WT and NOD2−/− mice fed a CTD or HFD. Richness (A), evenness (B), and Shannon index (C) of fecal bacterial OTUs. Serum LPS levels (D) and colony-forming unit numbers (CFU) in the blood or VAT (E) was assessed. Relative abundance of fecal bacterial phylum (F) and genera (G) was determined by 16S rRNA gene sequencing. The results are expressed as the mean ± SEM and are a compilation of 3 independent experiments (n = 4–8 mice per group) (D,E) or represent a single experiment (n = 3–5 mice per group) (A–C,F,G). Asterisks represent statistically significant differences (*p < 0.05) compared to WT on CTD; (#p < 0.05) compared to WT on HFD; (&p < 0.05) compared to NOD2−/− mice on CTD. Significant differences between two groups were compared by Student's t-test followed Mann-Whitney test; and between more groups by one-way ANOVA followed by Tukey's multiple-comparison test.
Figure 7
Figure 7
Representation about the immunological mechanisms involved in the protective efffect of NOD2 receptor in the T2D development. Mechanistically, the NOD2 activation drives the intestinal Th17 response and IL-22 and IL-17 expression in the ileum. In turn, promotes the gut homeostasis including a healthy gut microbiota with enrichment of Lactobacillus and Allobaculum genera and decrease of gram-negative Bacteroides genus and maintenance of gut barrier integrity. In addition, a downregulation of the intestinal Th1 response and interferon gamma expression is associated in the ileum. Taken together, these events reduce the gut permeability and endotoxemia, which ultimately favors an anti-inflammatory profile mediated by M2 macrophages in VAT and result in obesity-induced T2D protection.

References

    1. Zeyda M, Stulnig TM. Obesity, inflammation, and insulin resistance–a mini-review. Gerontology. (2009) 55:379–86. 10.1159/000212758 - DOI - PubMed
    1. McCarthy MI. Genomics, type 2 diabetes, and obesity. N Engl J Med. (2010) 363:2339–50. 10.1056/NEJMra0906948 - DOI - PubMed
    1. Lumeng CN, Deyoung SM, Bodzin JL, Saltiel AR. Increased inflammatory properties of adipose tissue macrophages recruited during diet-induced obesity. Diabetes. (2007) 56:16–23. 10.2337/db06-1076 - DOI - PubMed
    1. Liu J, Divoux A, Sun J, Zhang J, Clement K, Glickman JN, et al. . Genetic deficiency and pharmacological stabilization of mast cells reduce diet-induced obesity and diabetes in mice. Nat Med. (2009) 15:940–5. 10.1038/nm.1994 - DOI - PMC - PubMed
    1. Giulietti A, van Etten E, Overbergh L, Stoffels K, Bouillon R, Mathieu C. Monocytes from type 2 diabetic patients have a pro-inflammatory profile. 1,25-Dihydroxyvitamin D(3) works as anti-inflammatory. Diabetes Res Clin Pract. (2007) 77:47–57. 10.1016/j.diabres.2006.10.007 - DOI - PubMed

Publication types

MeSH terms