

Translation, Cross-Cultural Adaptation, and Validation of the Pain Sensitivity Questionnaire in Dutch Healthy Volunteers
- PMID: 32774564
- PMCID: PMC7397447
- DOI: 10.1155/2020/1050935
Translation, Cross-Cultural Adaptation, and Validation of the Pain Sensitivity Questionnaire in Dutch Healthy Volunteers
Abstract
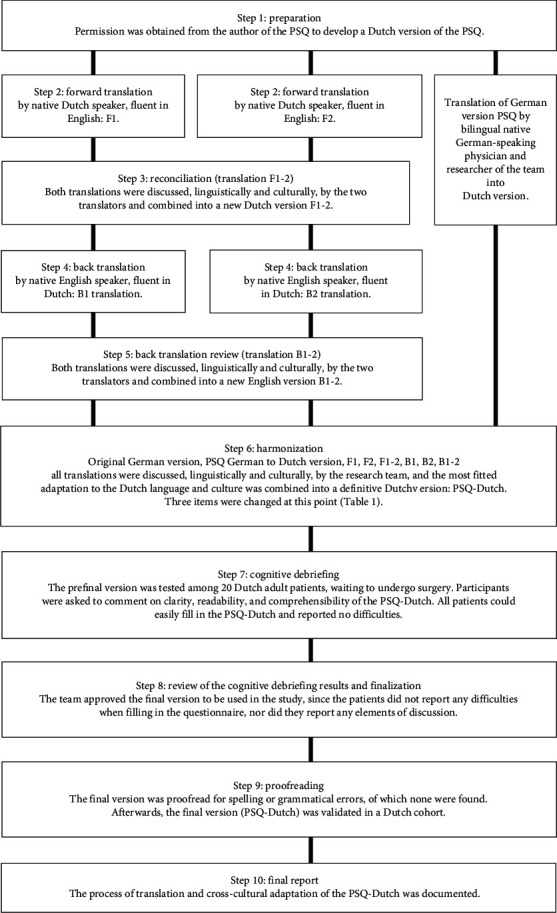
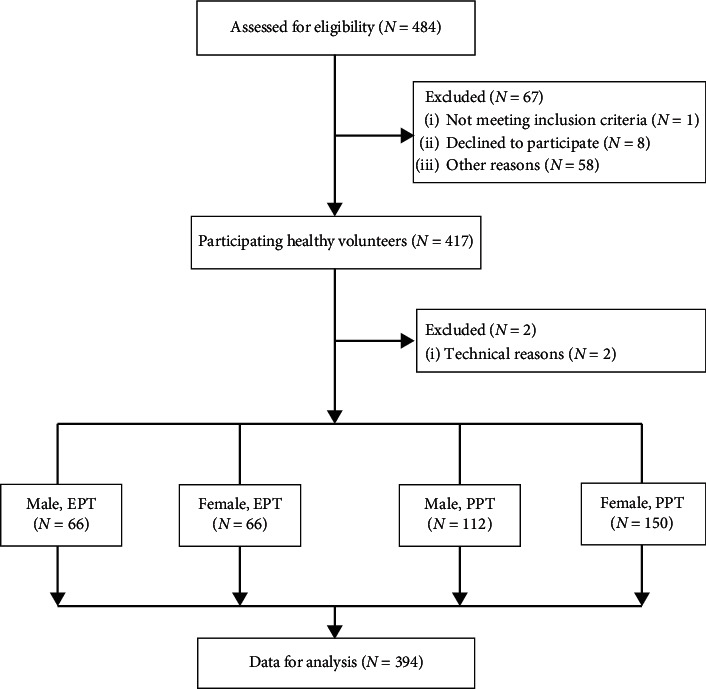
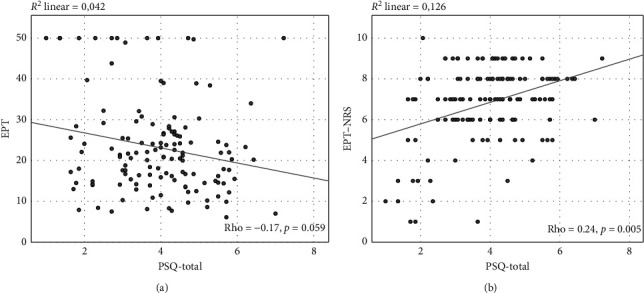
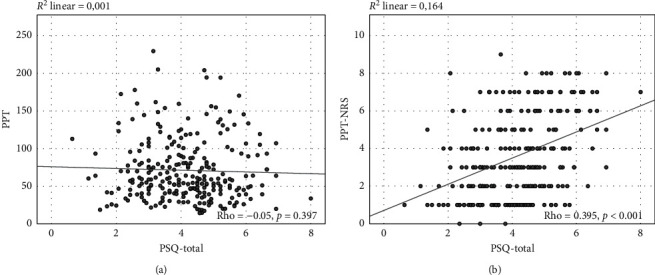
An increased sensitivity to painful stimuli has been proposed to be related to the development of chronic pain. Therefore, assessment of individual pain sensitivity is useful in clinical practice. However, experimental pain testing may be uncomfortable for patients and requires specific equipment. The Pain Sensitivity Questionnaire (PSQ) has been developed to facilitate assessment of pain sensitivity. In this study, we aimed to translate and cross-culturally adapt the PSQ from its published German and English versions into the Dutch language and to assess validity of the PSQ in healthy volunteers. After translation and cross-cultural adaptation of the PSQ following international guidelines, we validated the PSQ in 394 healthy volunteers by comparing the PSQ-values with two different experimental pain tests: electrical pain tolerance (EPT) and pressure pain threshold (PPT). In addition, ratings of pain intensity during these tests were obtained on the numerical rating scale (NRS, 0-10). We found that the reliability of the PSQ based on internal consistency was good (Cronbach's alpha 0.90). PSQ-scores, adjusted for age and sex, were statistically significant and weakly inversely correlated to EPT (PSQ-moderate: rho = -0.24, p=0.007; PSQ-total: rho = -0.22, p=0.016). No statistically significant correlation between PSQ-scores and PPT was found. Concerning the pain scores, PSQ-scores were weakly to moderately correlated to EPT-NRS (PSQ-minor: rho = 0.21, p=0.021; PSQ-moderate: rho = 0.22, p=0.016; PSQ-total: rho = 0.23, p=0.009) as well as PPT-NRS (PSQ-minor: rho = 0.32, p < 0.001; PSQ-moderate: rho = 0.36, p < 0.001; PSQ-total: rho = 0.37, p < 0.001). Therefore, we concluded that the Dutch version of the PSQ is culturally appropriate for assessing self-reported pain sensitivity in healthy volunteers.
Copyright © 2020 Regina L. M. Van Boekel et al.
Conflict of interest statement
The authors report no conflicts of interest in this work.
Figures
Similar articles
-
Pain Sensitivity Questionnaire: Cross-cultural adaptation and validation of the Greek version.Physiother Res Int. 2024 Oct;29(4):e2113. doi: 10.1002/pri.2113. Physiother Res Int. 2024. PMID: 39076064
-
Translation, cross-cultural adaptation, and validity of the Korean version of the pain sensitivity questionnaire in chronic pain patients.Pain Pract. 2014 Nov;14(8):745-51. doi: 10.1111/papr.12123. Epub 2013 Oct 17. Pain Pract. 2014. PMID: 24131768
-
Validation of the Mandarin Chinese Version of the Pain Sensitivity Questionnaire.Pain Pract. 2018 Feb;18(2):180-193. doi: 10.1111/papr.12587. Epub 2017 Jun 6. Pain Pract. 2018. PMID: 28422444
-
Cross-cultural adaptation, reliability and validity of the Fremantle Knee Awareness Questionnaire in Italian subjects with painful knee osteoarthritis.Health Qual Life Outcomes. 2021 Apr 7;19(1):114. doi: 10.1186/s12955-021-01754-4. Health Qual Life Outcomes. 2021. PMID: 33827594 Free PMC article.
-
Cross-cultural adaptation of the Neck Pain and Disability Scale: a methodological systematic review.Spine J. 2019 Jun;19(6):1057-1066. doi: 10.1016/j.spinee.2019.01.007. Epub 2019 Jan 29. Spine J. 2019. PMID: 30708113
Cited by
-
Pain descriptors and determinants of pain sensitivity in knee osteoarthritis: a community-based cross-sectional study.Rheumatol Adv Pract. 2022 Mar 2;6(1):rkac016. doi: 10.1093/rap/rkac016. eCollection 2022. Rheumatol Adv Pract. 2022. PMID: 35350719 Free PMC article.
-
Pain predict genetics: protocol for a prospective observational study of clinical and genetic factors to predict the development of postoperative pain.BMJ Open. 2022 Nov 29;12(11):e066134. doi: 10.1136/bmjopen-2022-066134. BMJ Open. 2022. PMID: 36446453 Free PMC article.
-
The Value of Pain Sensitivity Questionnaire in Predicting Postoperative Pain in Living Kidney Donors: A Prospective Observational Study.J Pain Res. 2023 Aug 23;16:2899-2907. doi: 10.2147/JPR.S419719. eCollection 2023. J Pain Res. 2023. PMID: 37641638 Free PMC article.
-
Validation and Cross-Cultural Adaptation of the Spanish Version of the Pain Sensitivity Questionnaire (PSQ-S).J Clin Med. 2021 Dec 28;11(1):151. doi: 10.3390/jcm11010151. J Clin Med. 2021. PMID: 35011891 Free PMC article.
-
Sex Differences in Pain Sensitivity in a Dutch Cohort: Cross-Sectional and Web-Based Multidimensional Study.J Med Internet Res. 2024 Aug 9;26:e53926. doi: 10.2196/53926. J Med Internet Res. 2024. PMID: 39121479 Free PMC article.
References
Publication types
MeSH terms
LinkOut - more resources
Full Text Sources
Medical
