

HBV infection exacerbates PTEN defects in hepatocellular carcinoma through upregulation of miR-181a/382/362/19a
- PMID: 32774734
- PMCID: PMC7407694
HBV infection exacerbates PTEN defects in hepatocellular carcinoma through upregulation of miR-181a/382/362/19a
Abstract
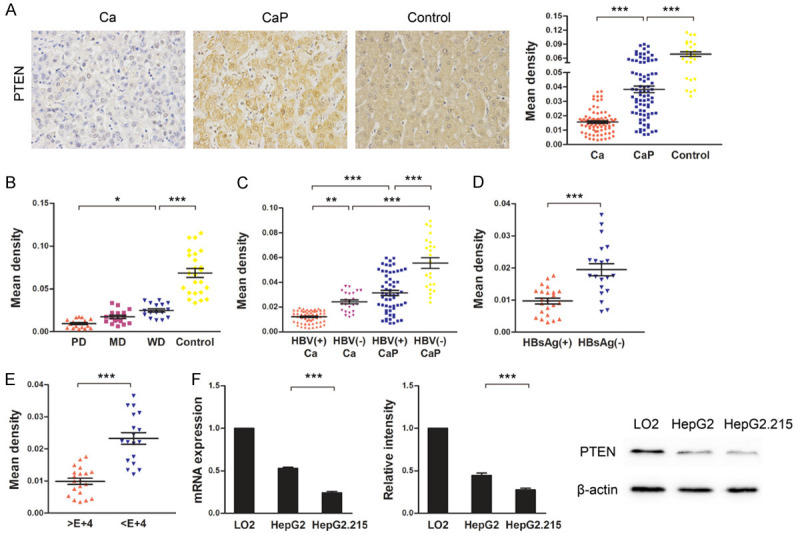
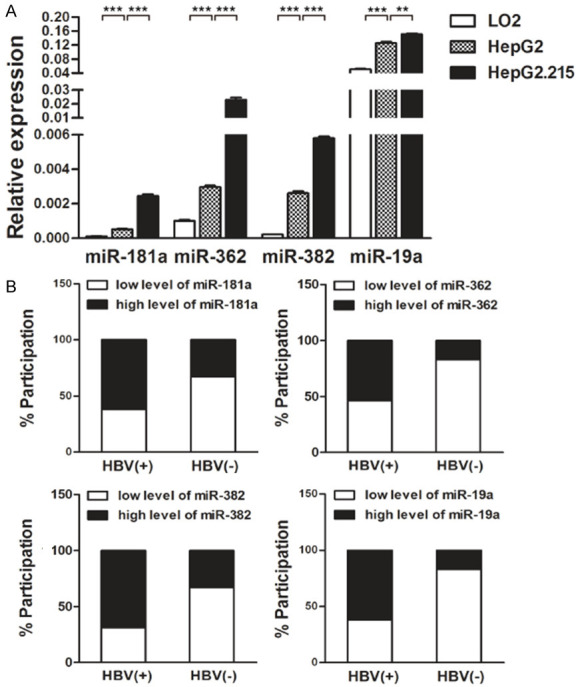
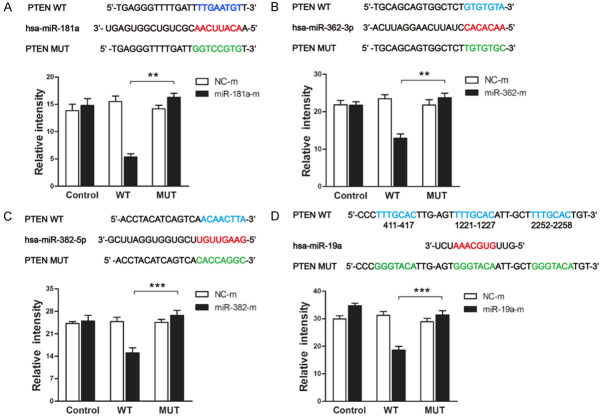
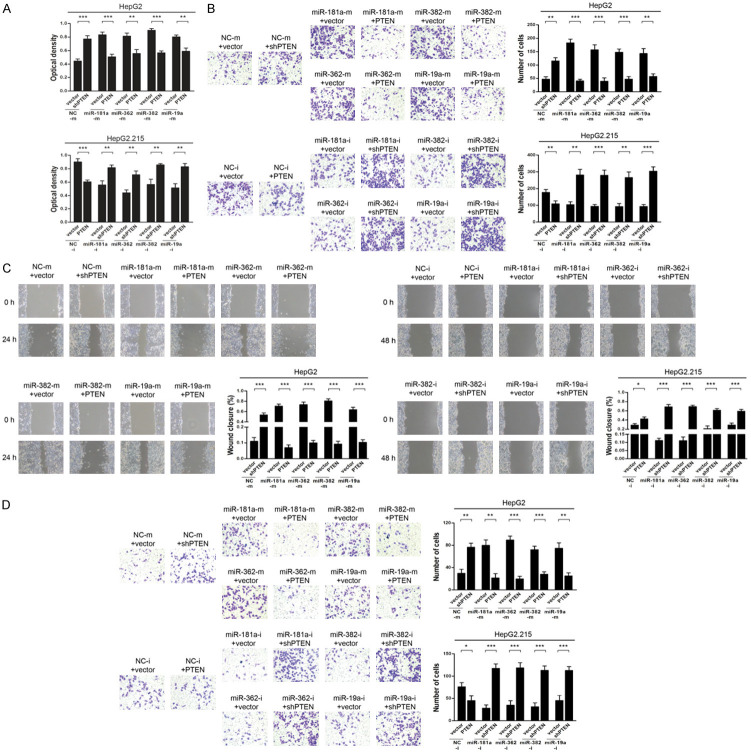
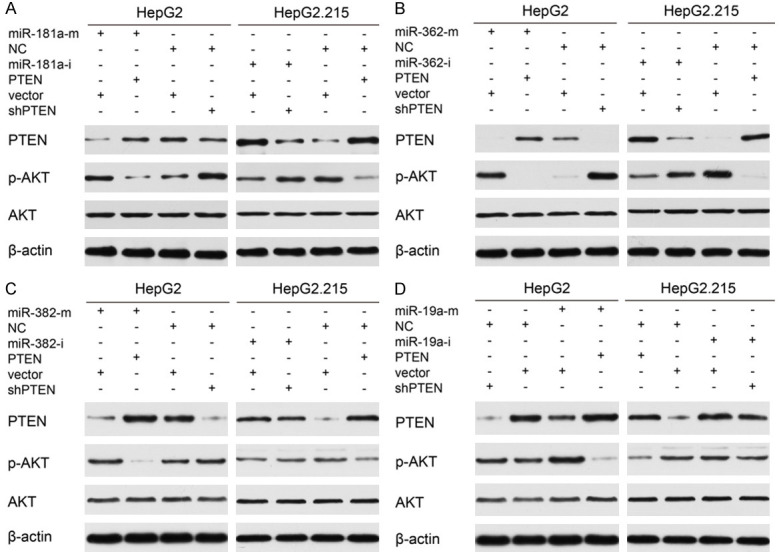
A high hepatitis B virus (HBV) load and chronic hepatitis B infection are well-recognized risk factors for the development of hepatocellular carcinoma (HCC), highlighting the need for research into the mechanisms underlying the role of HBV infection in HCC. Because phosphatase and tensin homolog (PTEN) has been implicated in HCC development, we explored whether PTEN has a role in HBV-related hepatocarcinogenesis. We found that PTEN expression was correlated with advanced clinicopathological features and that HBV infection exacerbates PTEN defects in HCC. Using an integrated approach, we then investigated if miRNAs linked HBV infection to PTEN downregulation in HCC and found that PTEN was a target of miR-181a/382/362/19a. We also show that miR-181a/382/362/19a-mediated inhibition of PTEN led to an enhanced malignant phenotype and stimulation of AKT signaling in HCC cells. Collectively, our results indicate that HBV infection exacerbates PTEN defects in hepatocellular carcinoma through upregulation of miR-181a/362/382/19a. Our work implicates miR-181a/362/382/19a and PTEN as potential biomarkers and targets for novel prognostic, diagnostic, and therapeutic strategies targeting HBV-related HCC.
Keywords: HBV; hepatocellular carcinoma; microRNA; phosphatase and tensin homolog deleted on chromosome 10.
AJTR Copyright © 2020.
Conflict of interest statement
None.
Figures

Similar articles
-
MiR-19a, miR-122 and miR-223 are differentially regulated by hepatitis B virus X protein and involve in cell proliferation in hepatoma cells.J Transl Med. 2016 May 5;14(1):122. doi: 10.1186/s12967-016-0888-7. J Transl Med. 2016. PMID: 27150195 Free PMC article.
-
microRNA-19a-3p promotes tumor metastasis and chemoresistance through the PTEN/Akt pathway in hepatocellular carcinoma.Biomed Pharmacother. 2018 Sep;105:1147-1154. doi: 10.1016/j.biopha.2018.06.097. Epub 2018 Jun 21. Biomed Pharmacother. 2018. PMID: 30021351
-
Role of microRNA-210-3p in hepatitis B virus-related hepatocellular carcinoma.Am J Physiol Gastrointest Liver Physiol. 2020 Mar 1;318(3):G401-G409. doi: 10.1152/ajpgi.00269.2019. Epub 2020 Jan 6. Am J Physiol Gastrointest Liver Physiol. 2020. PMID: 31905024
-
Interplay of Wnt β-catenin pathway and miRNAs in HBV pathogenesis leading to HCC.Clin Res Hepatol Gastroenterol. 2019 Aug;43(4):373-386. doi: 10.1016/j.clinre.2018.09.012. Epub 2018 Oct 28. Clin Res Hepatol Gastroenterol. 2019. PMID: 30377095 Review.
-
Hepatitis B Virus (HBV) Infection and Hepatocellular Carcinoma- New Insights for an Old Topic.Curr Cancer Drug Targets. 2017;17(6):505-511. doi: 10.2174/1568009616666160926124530. Curr Cancer Drug Targets. 2017. PMID: 27677954 Review.
Cited by
-
ALR inhibits HBV replication and autophagosome formation by ameliorating HBV-induced ROS production in hepatic cells.Virus Genes. 2025 Apr;61(2):167-178. doi: 10.1007/s11262-025-02139-1. Epub 2025 Feb 11. Virus Genes. 2025. PMID: 39934594
-
Construction and validation of prognostic signature for hepatocellular carcinoma basing on hepatitis B virus related specific genes.Infect Agent Cancer. 2022 Dec 6;17(1):60. doi: 10.1186/s13027-022-00470-y. Infect Agent Cancer. 2022. PMID: 36474267 Free PMC article.
-
Identification of Safety Biomarkers for Autologous Blood Transfusion in Hepatocellular Carcinoma Patients.J Cell Mol Med. 2025 Apr;29(7):e70504. doi: 10.1111/jcmm.70504. J Cell Mol Med. 2025. PMID: 40193290 Free PMC article.
-
miR-3 Encoded by Hepatitis B Virus Downregulates PTEN Protein Expression and Promotes Cell Proliferation.J Hepatocell Carcinoma. 2020 Oct 29;7:257-269. doi: 10.2147/JHC.S271091. eCollection 2020. J Hepatocell Carcinoma. 2020. PMID: 33154957 Free PMC article.
References
LinkOut - more resources
Full Text Sources
Research Materials