Review
. 2020 Jul 21;7(3):HEP27.
doi: 10.2217/hep-2020-0024.

Epidemiologic, humanistic and economic burden of hepatocellular carcinoma in the USA: a systematic literature review

Affiliations
Review

Epidemiologic, humanistic and economic burden of hepatocellular carcinoma in the USA: a systematic literature review

Abdalla Aly et al. Hepat Oncol. .

Abstract

Aim: To describe the epidemiologic, humanistic and economic burdens of hepatocellular carcinoma (HCC) in the USA.

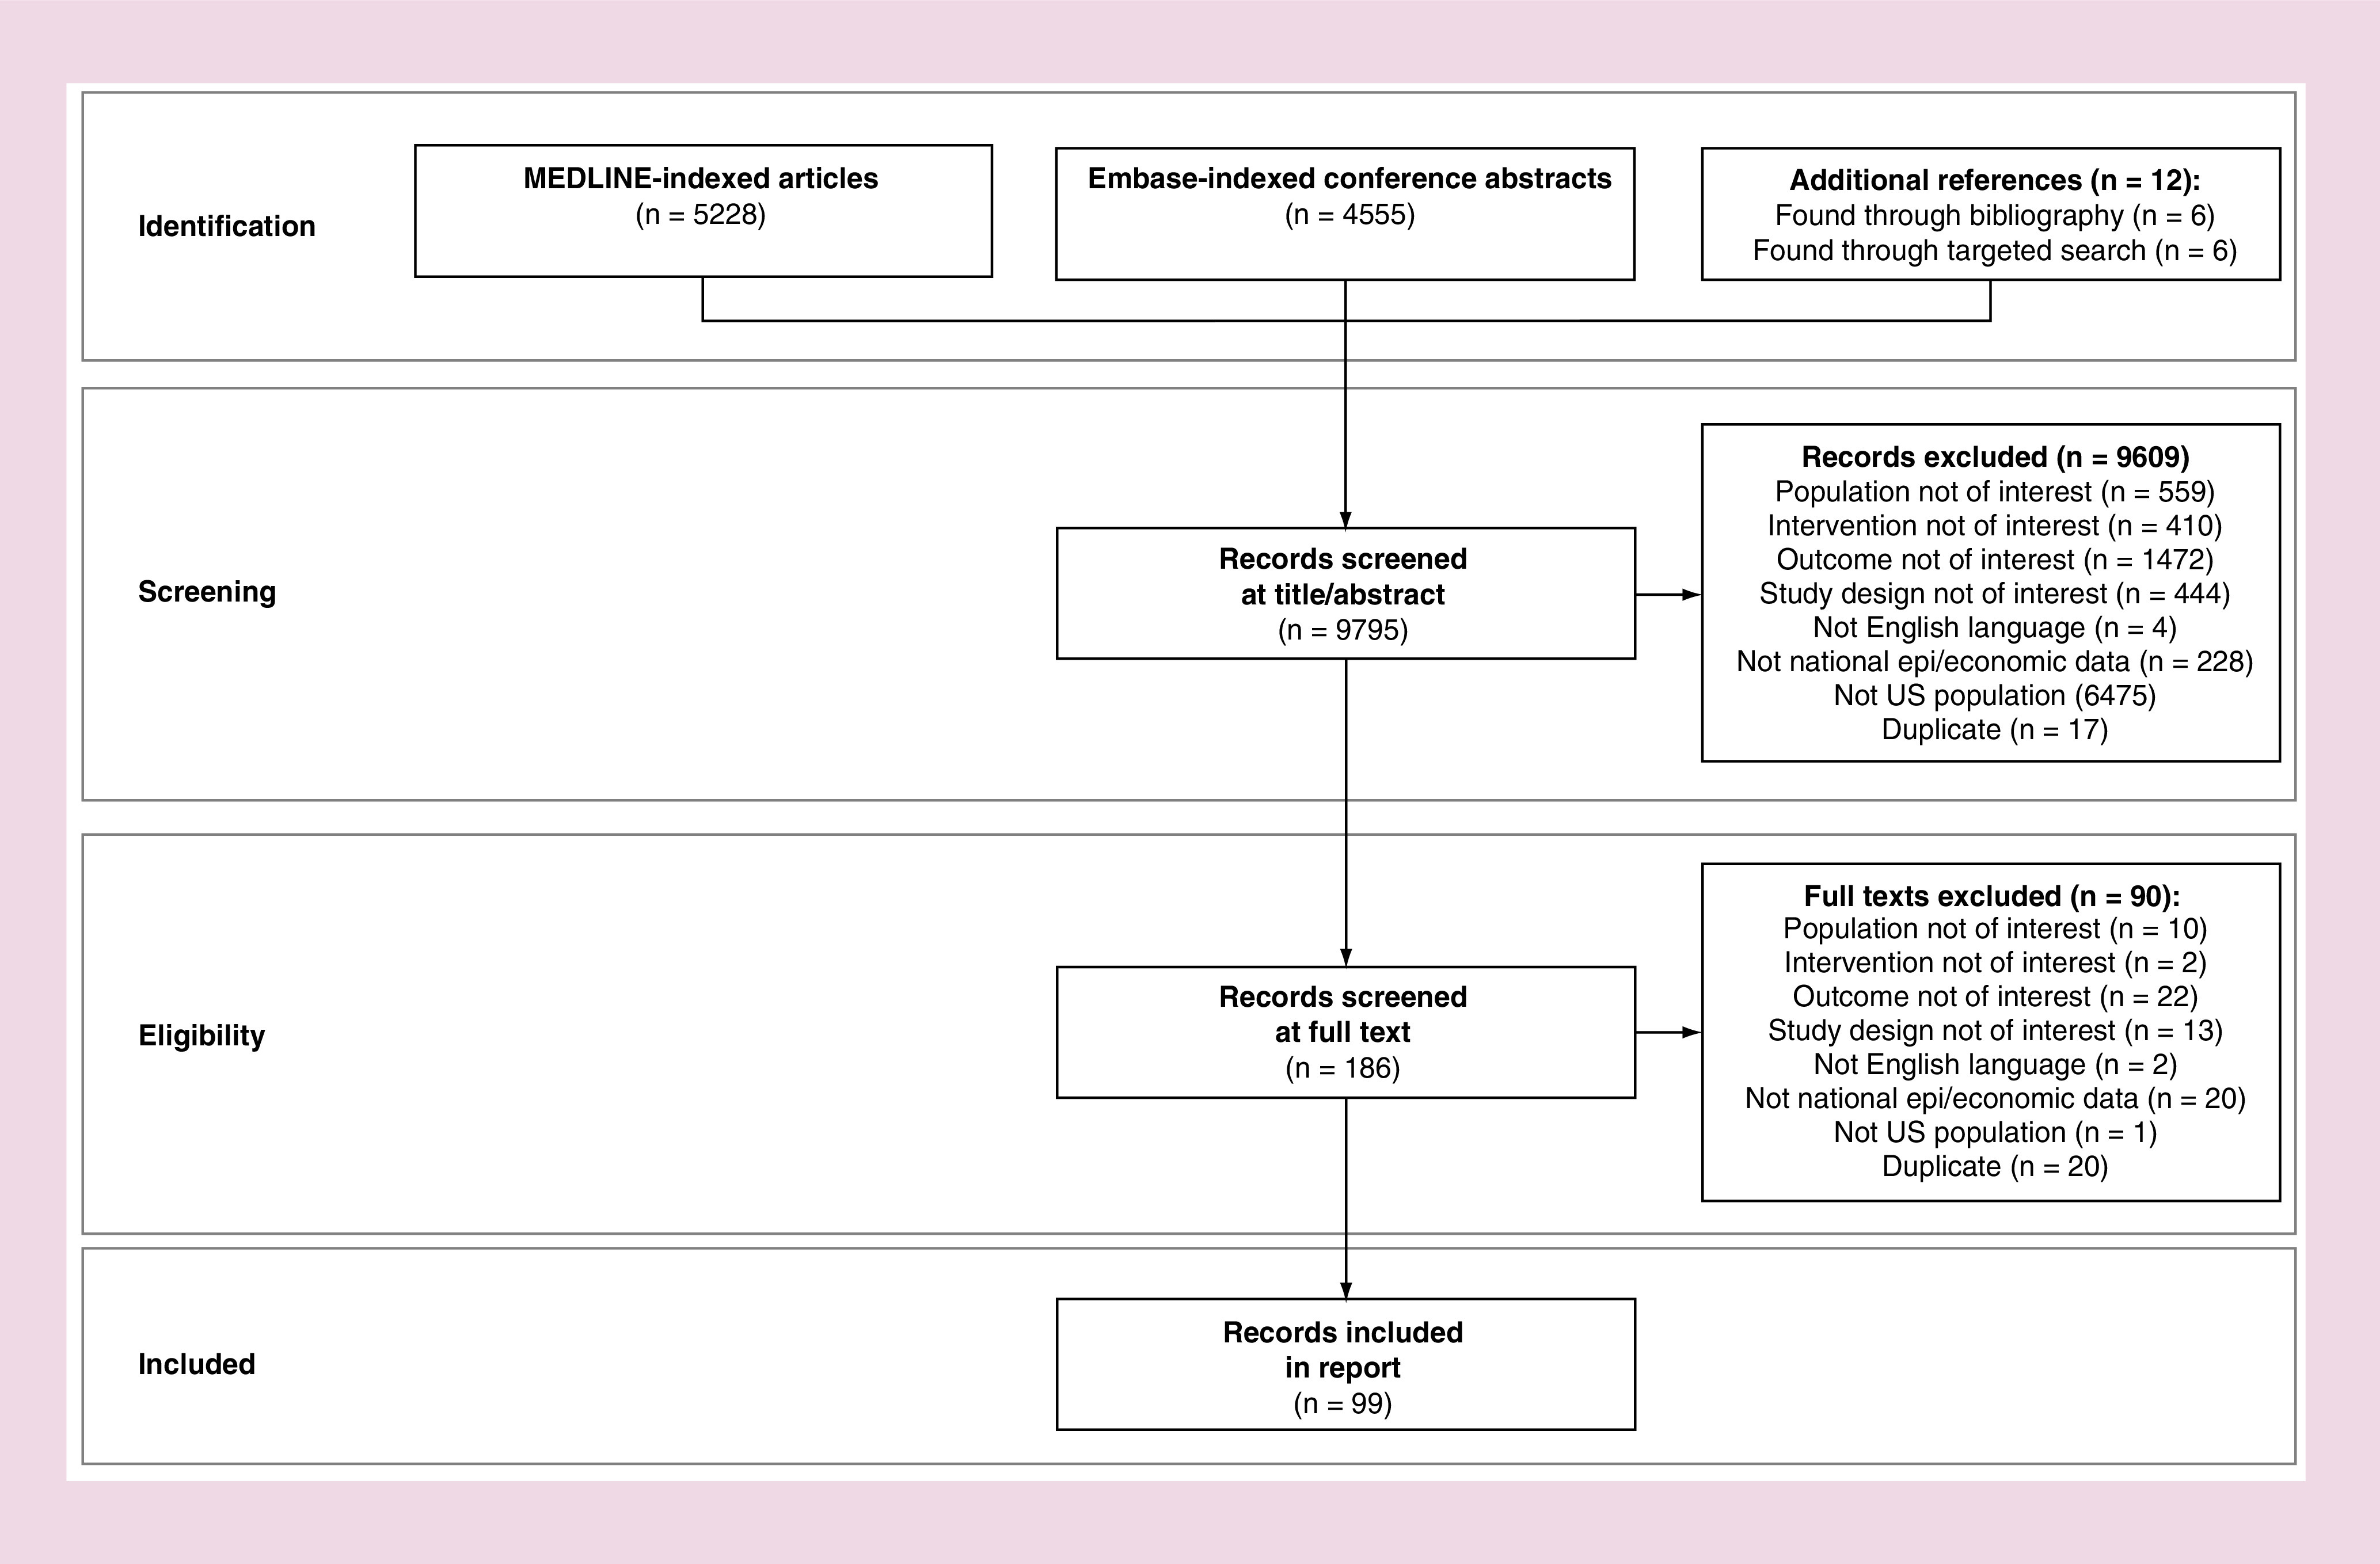
Materials & methods: Studies describing the epidemiology and economic burden from national cohorts, any economic models, or any humanistic burden studies published 2008-2018 were systematically searched.

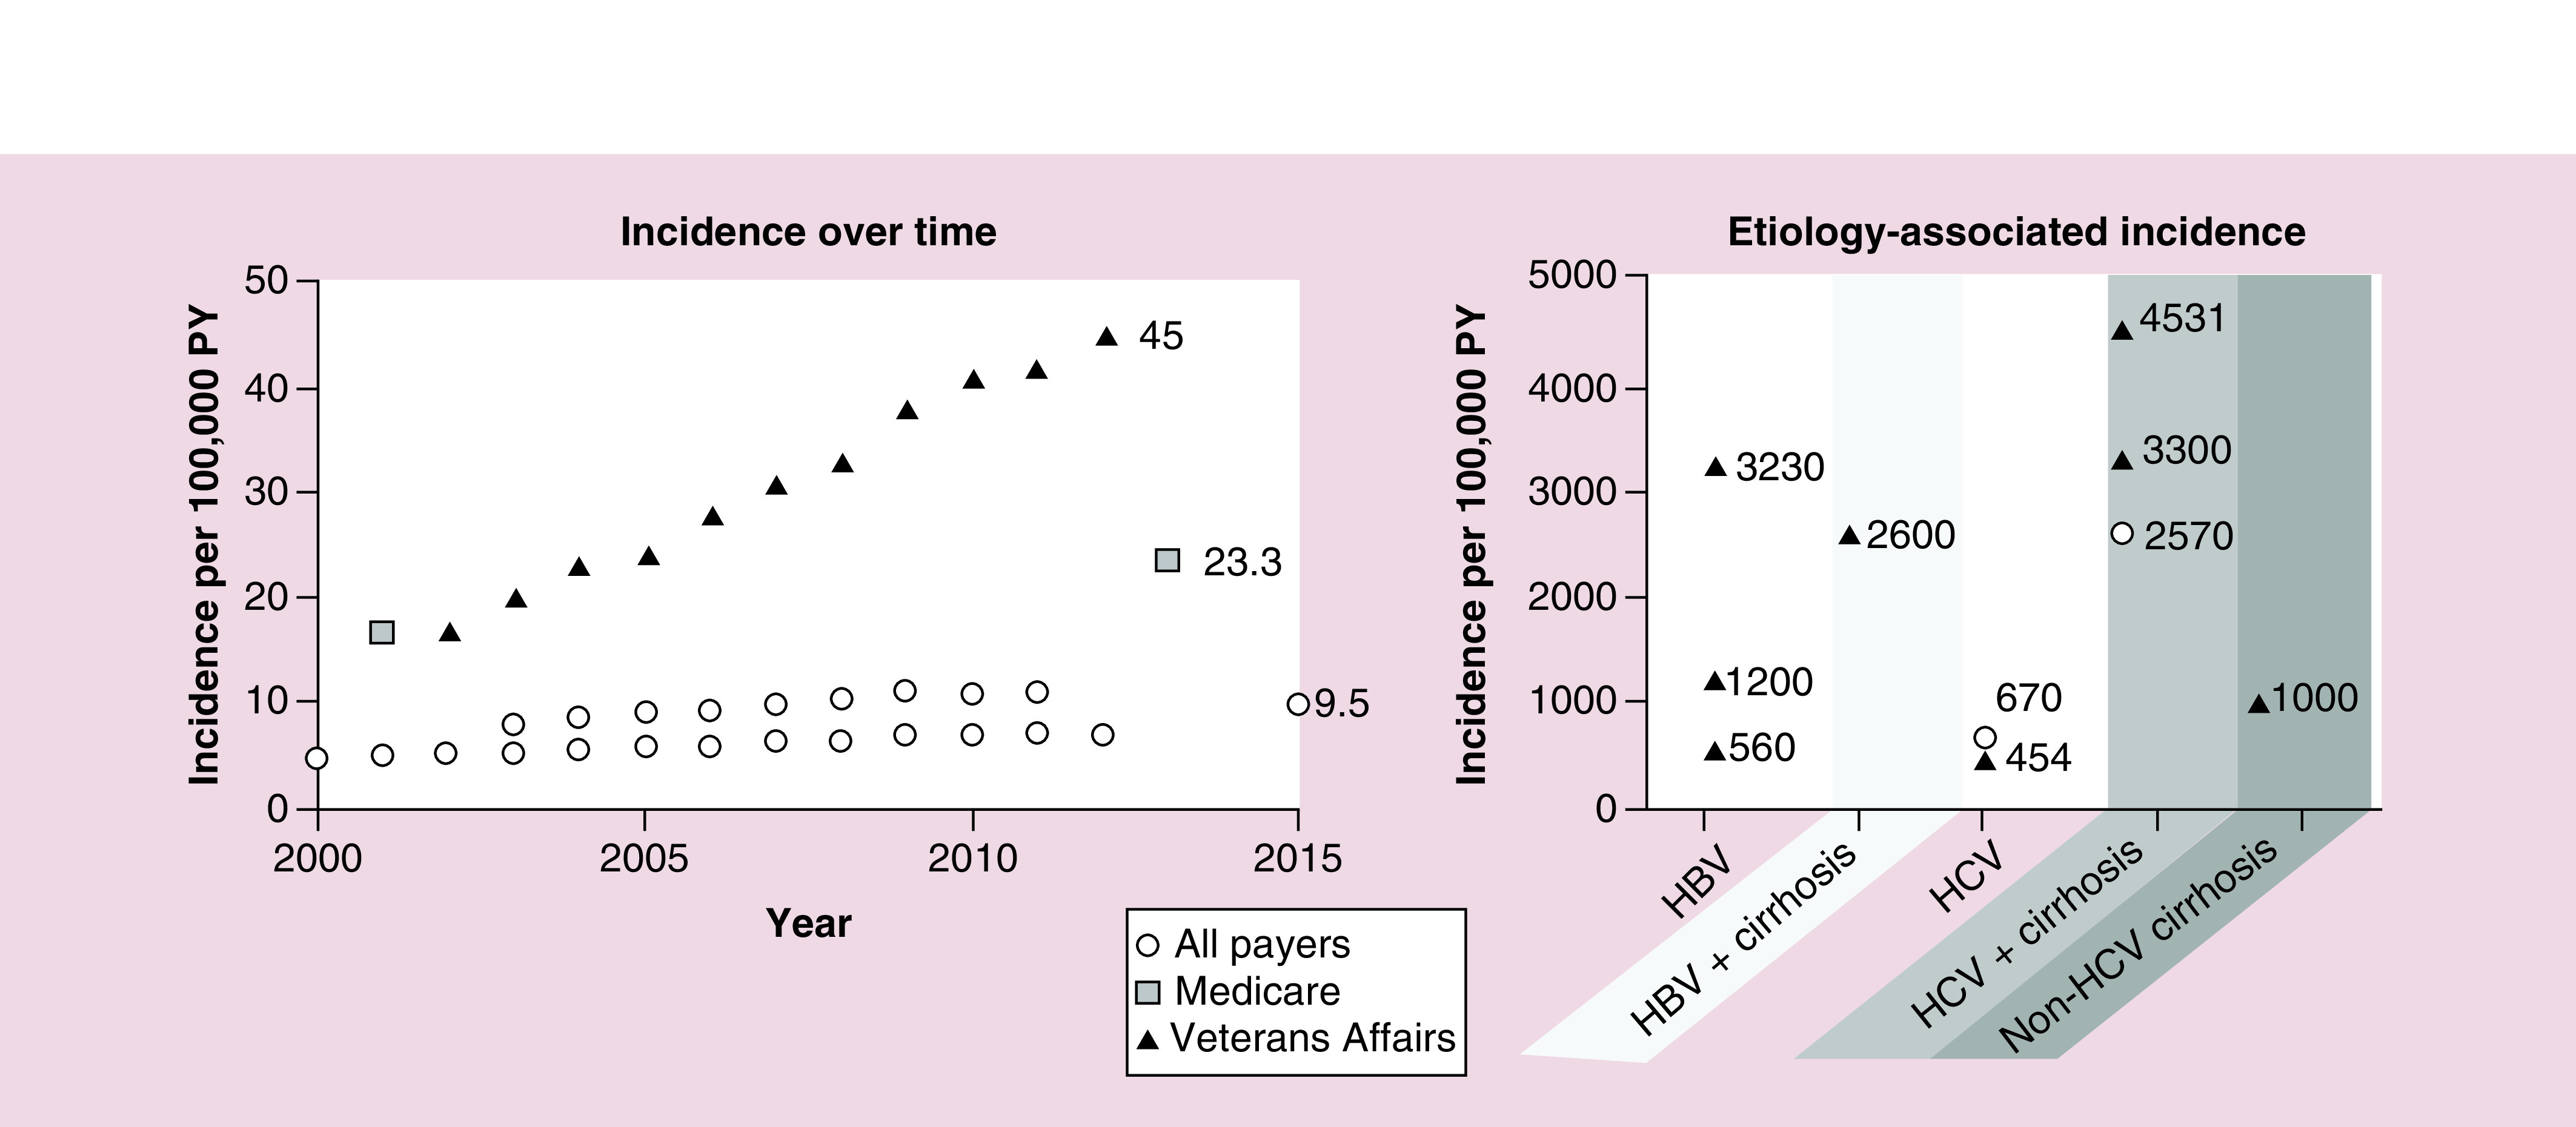
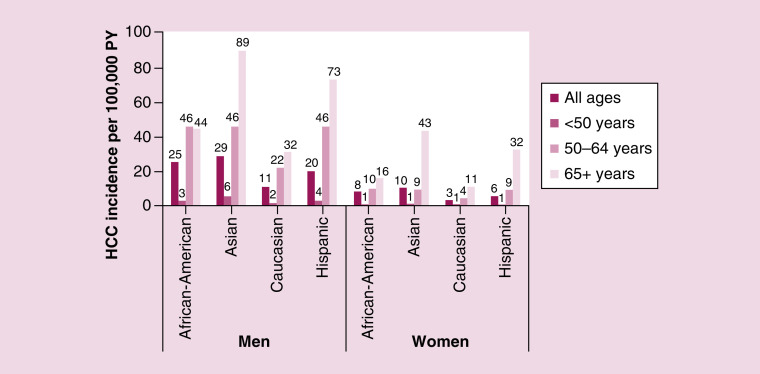
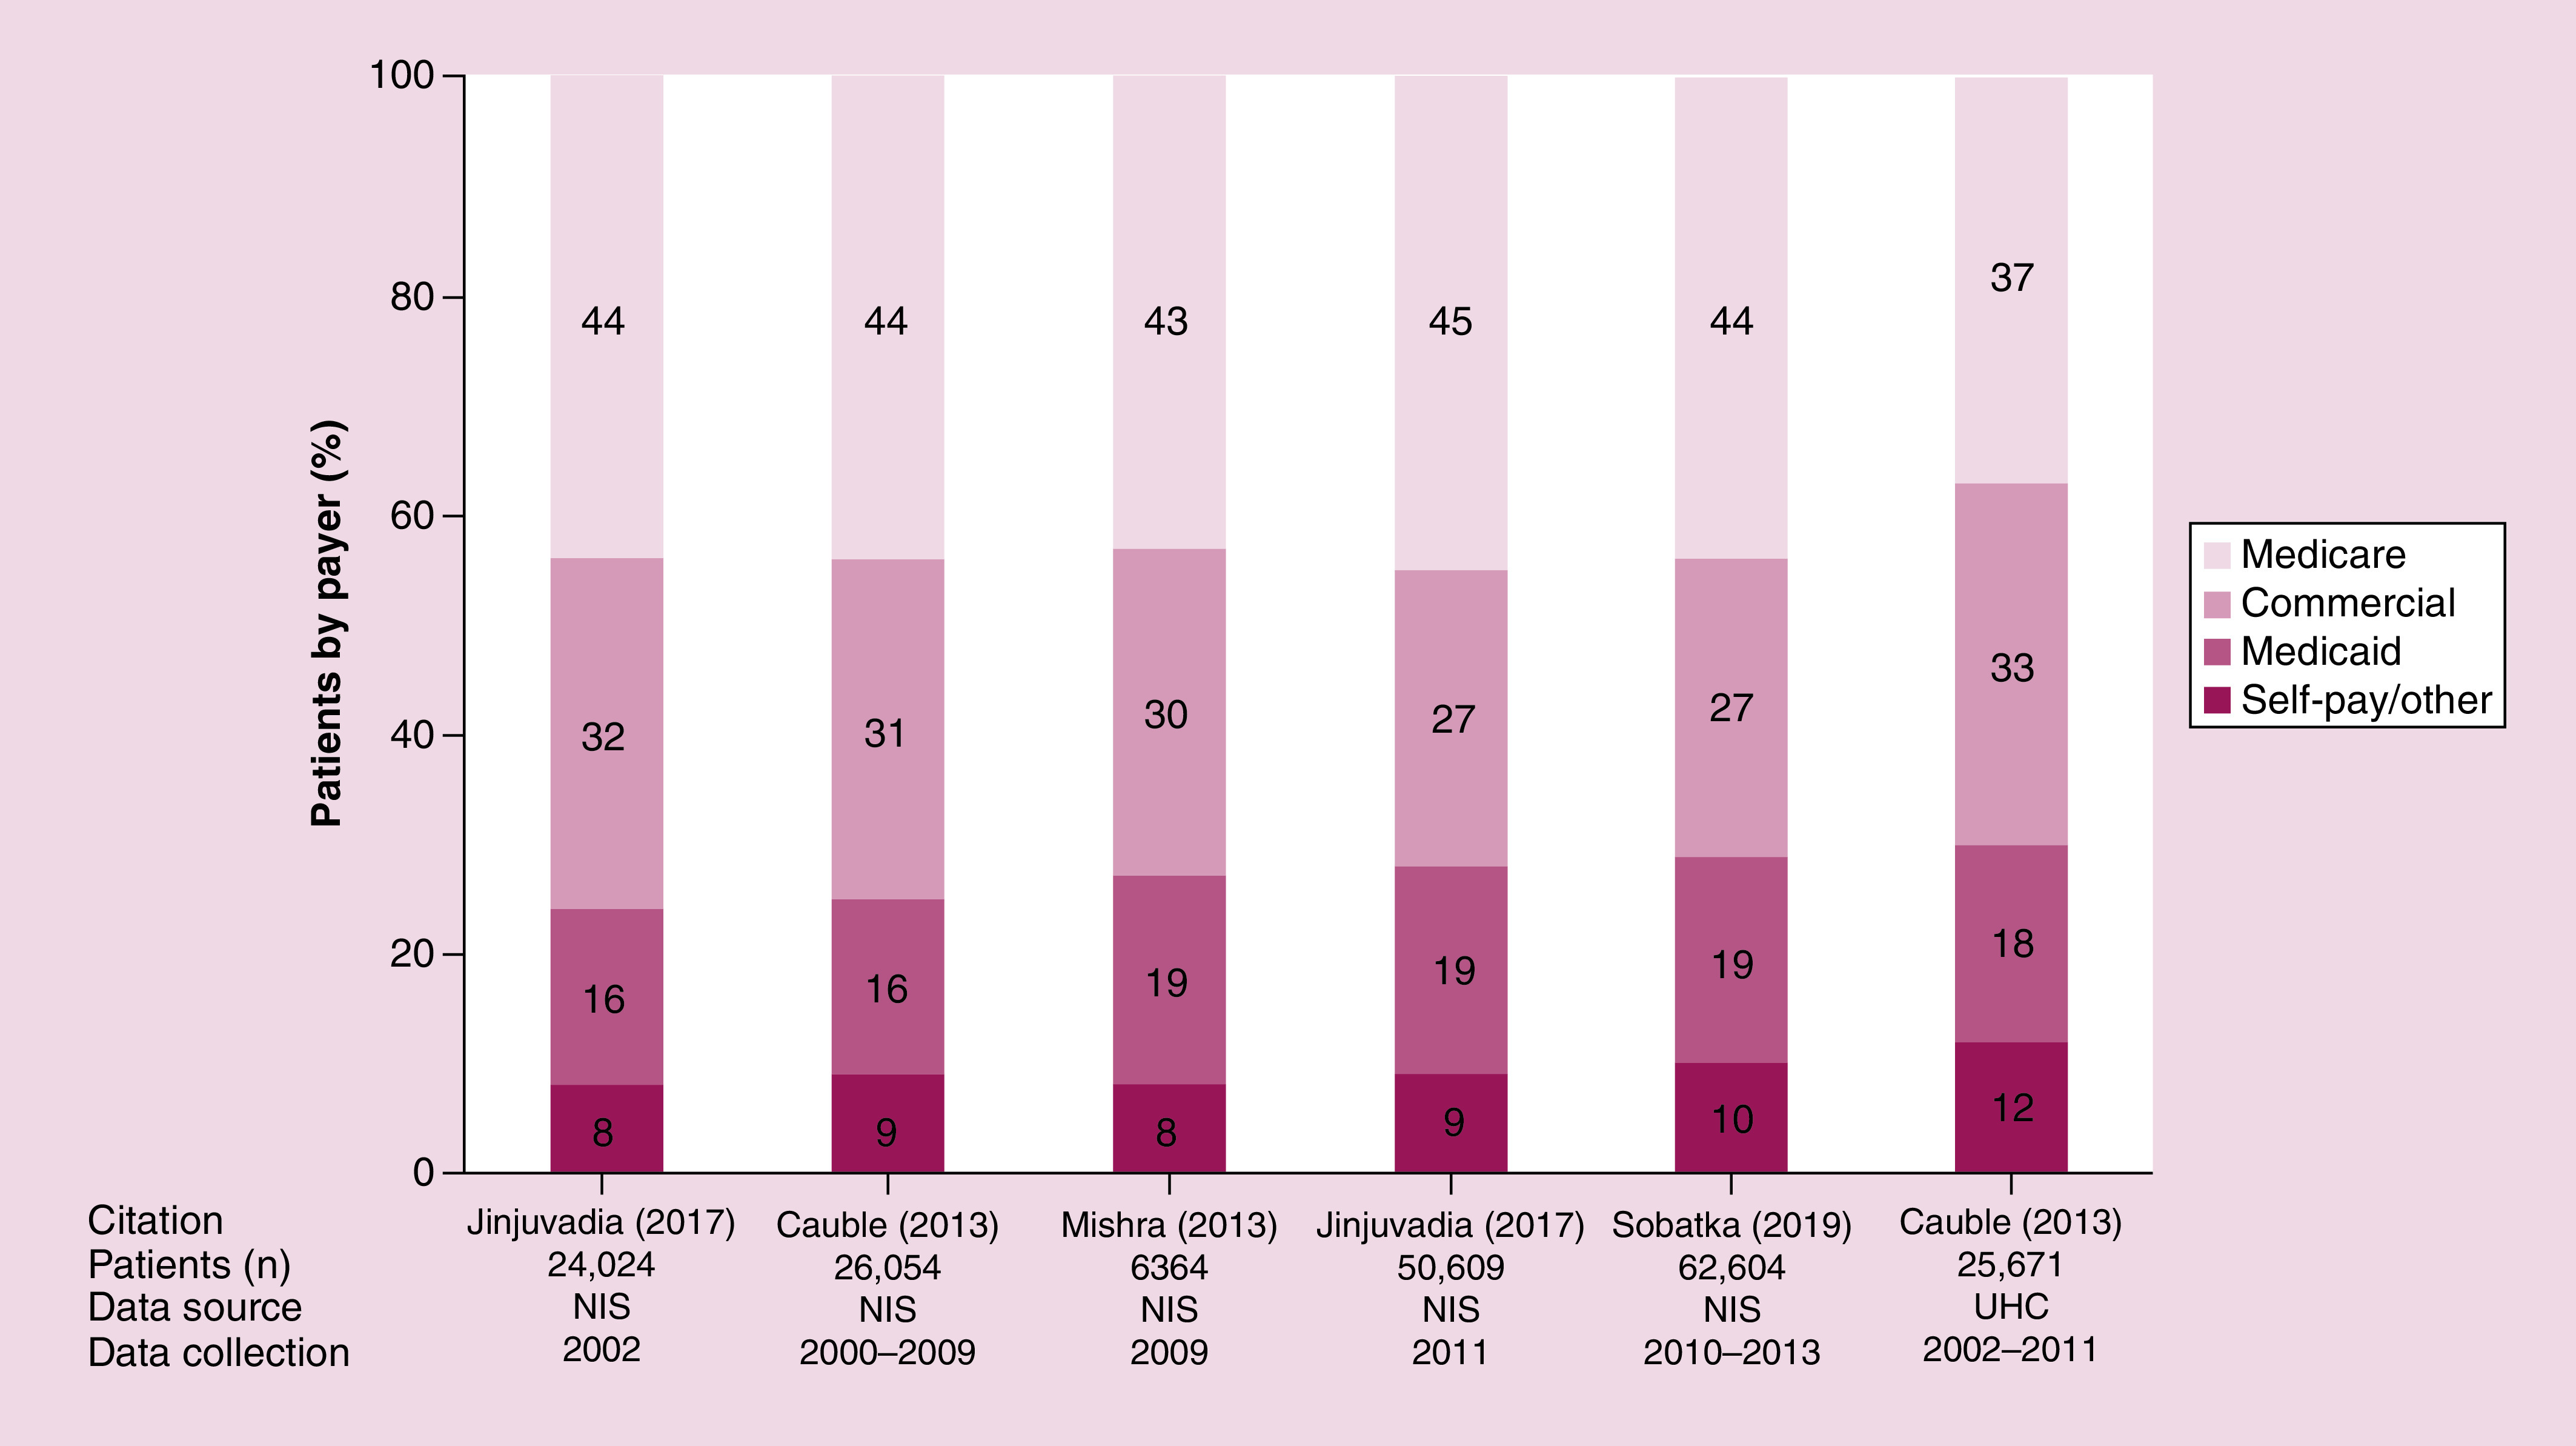
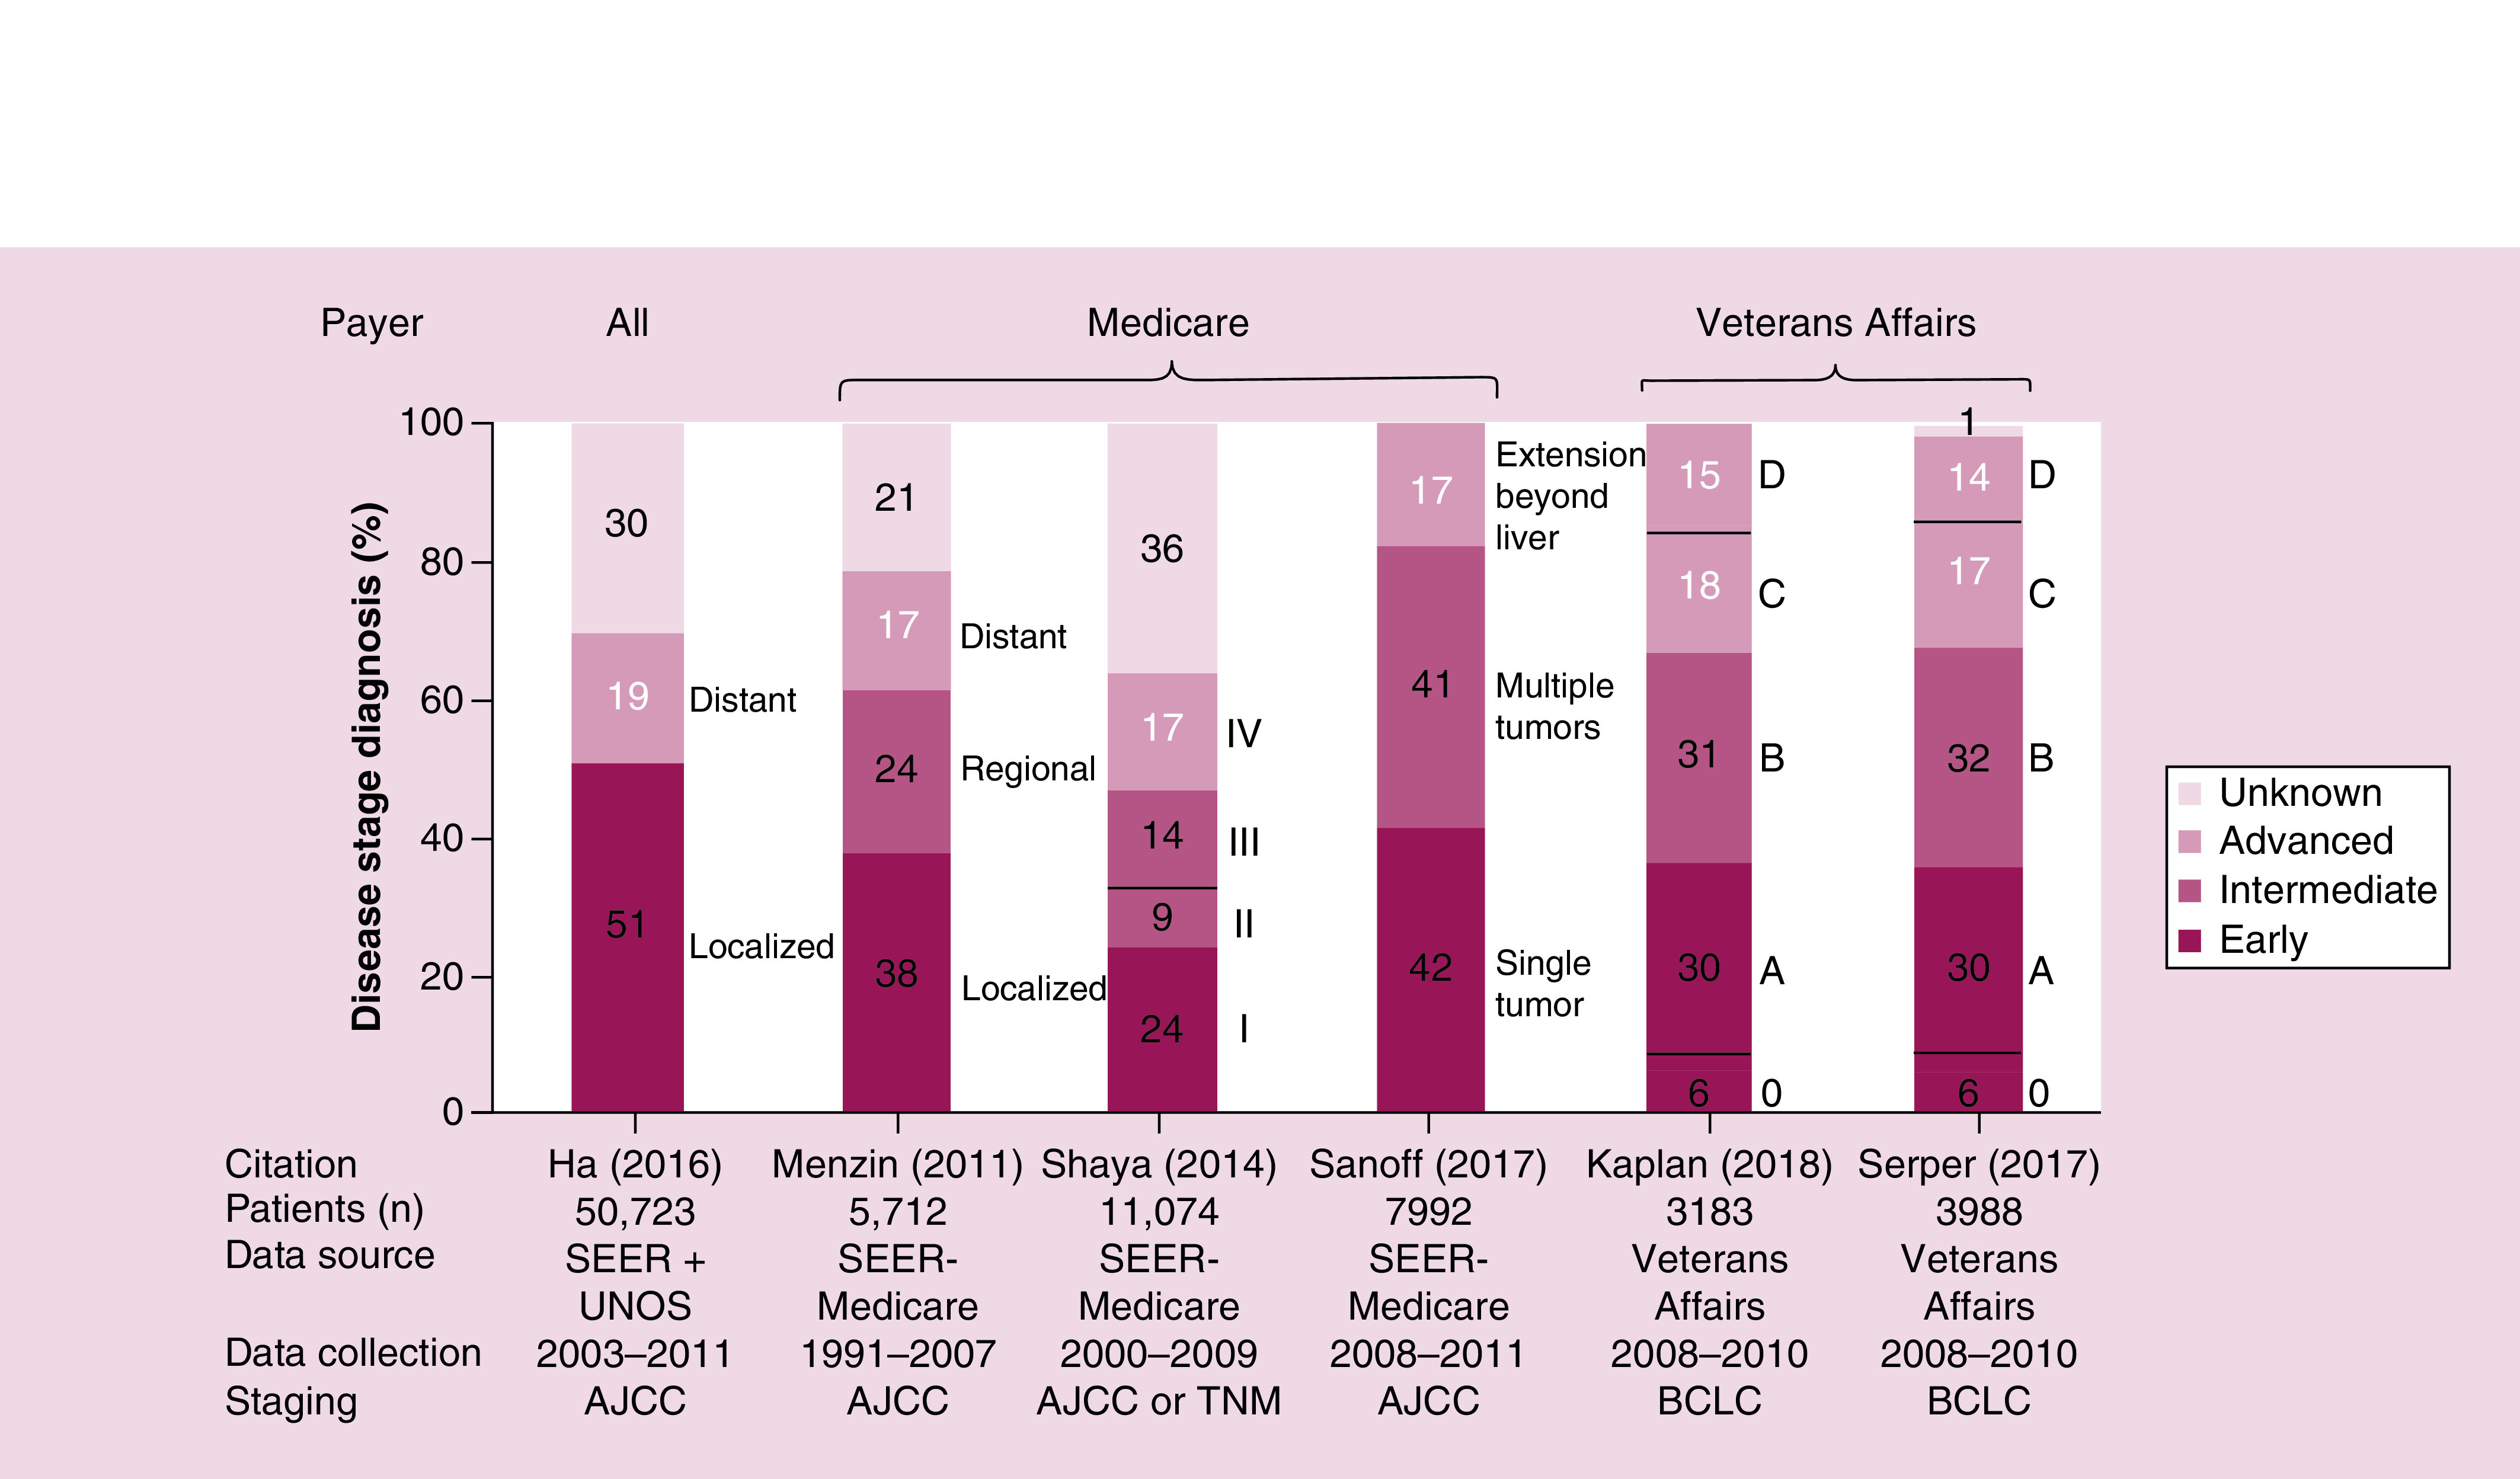
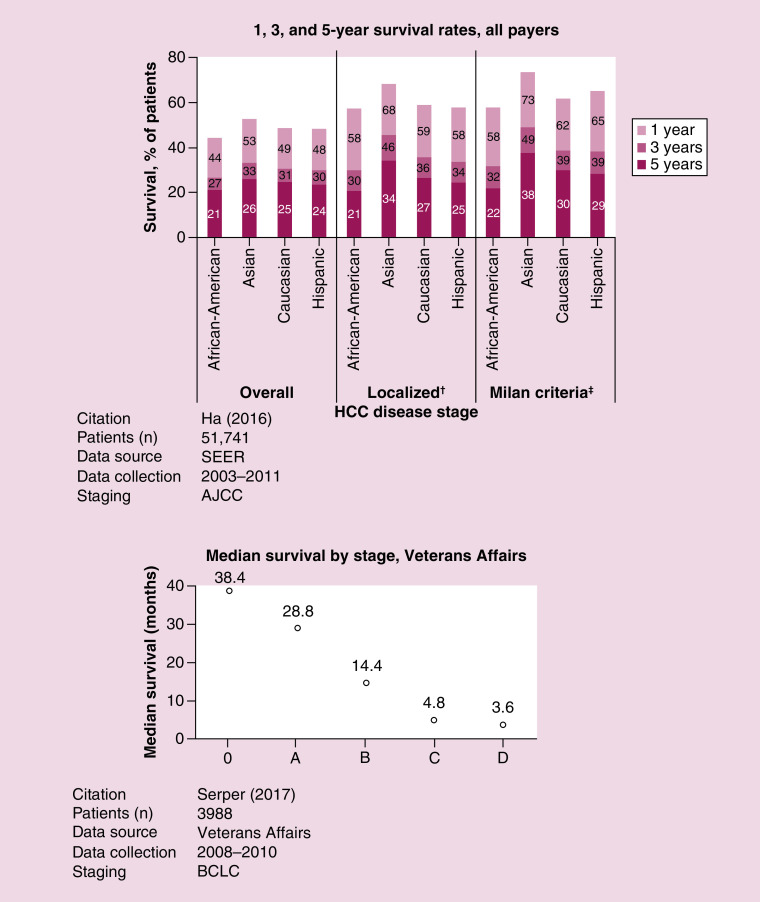
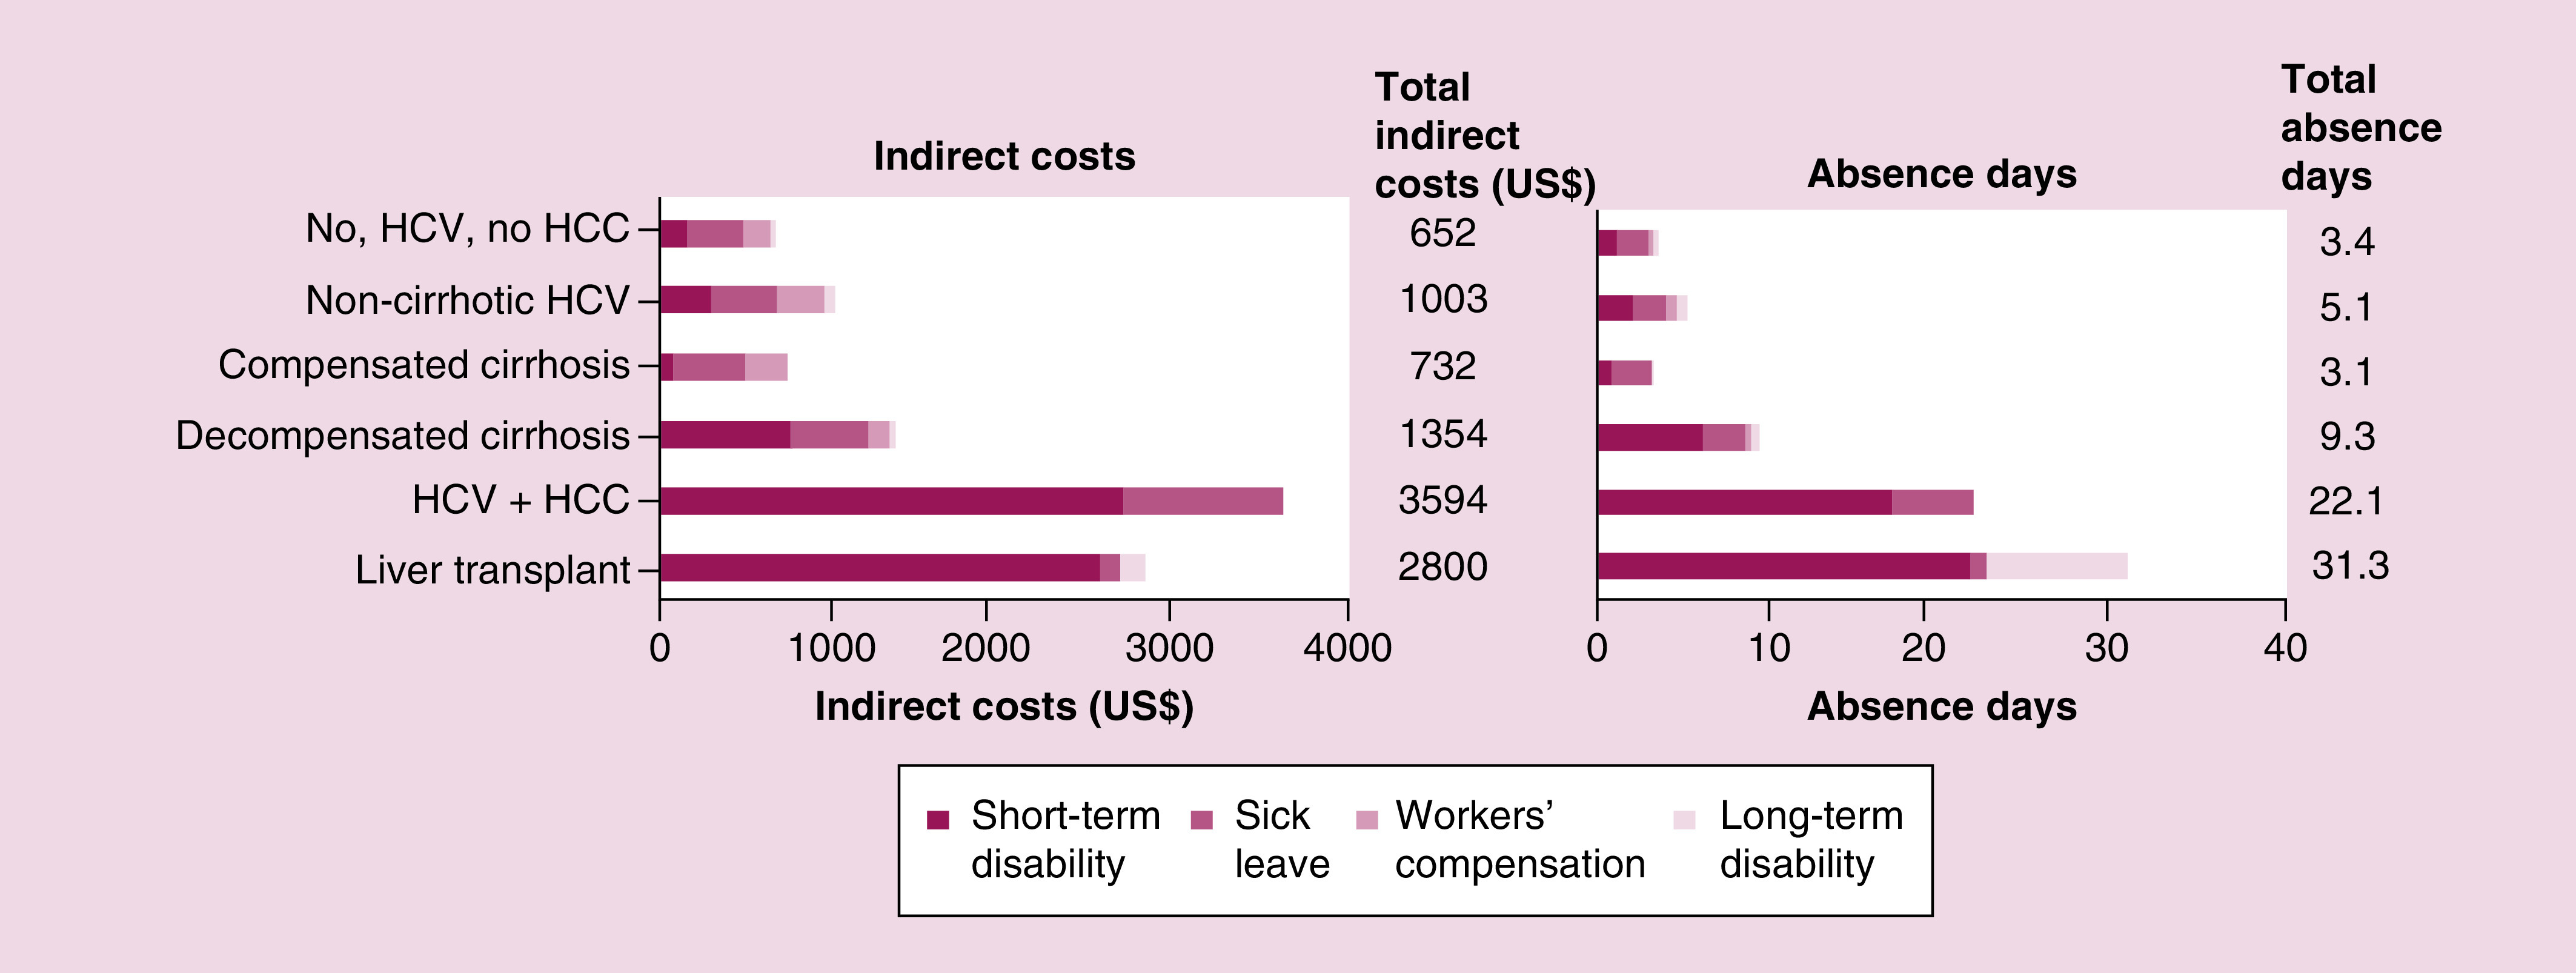
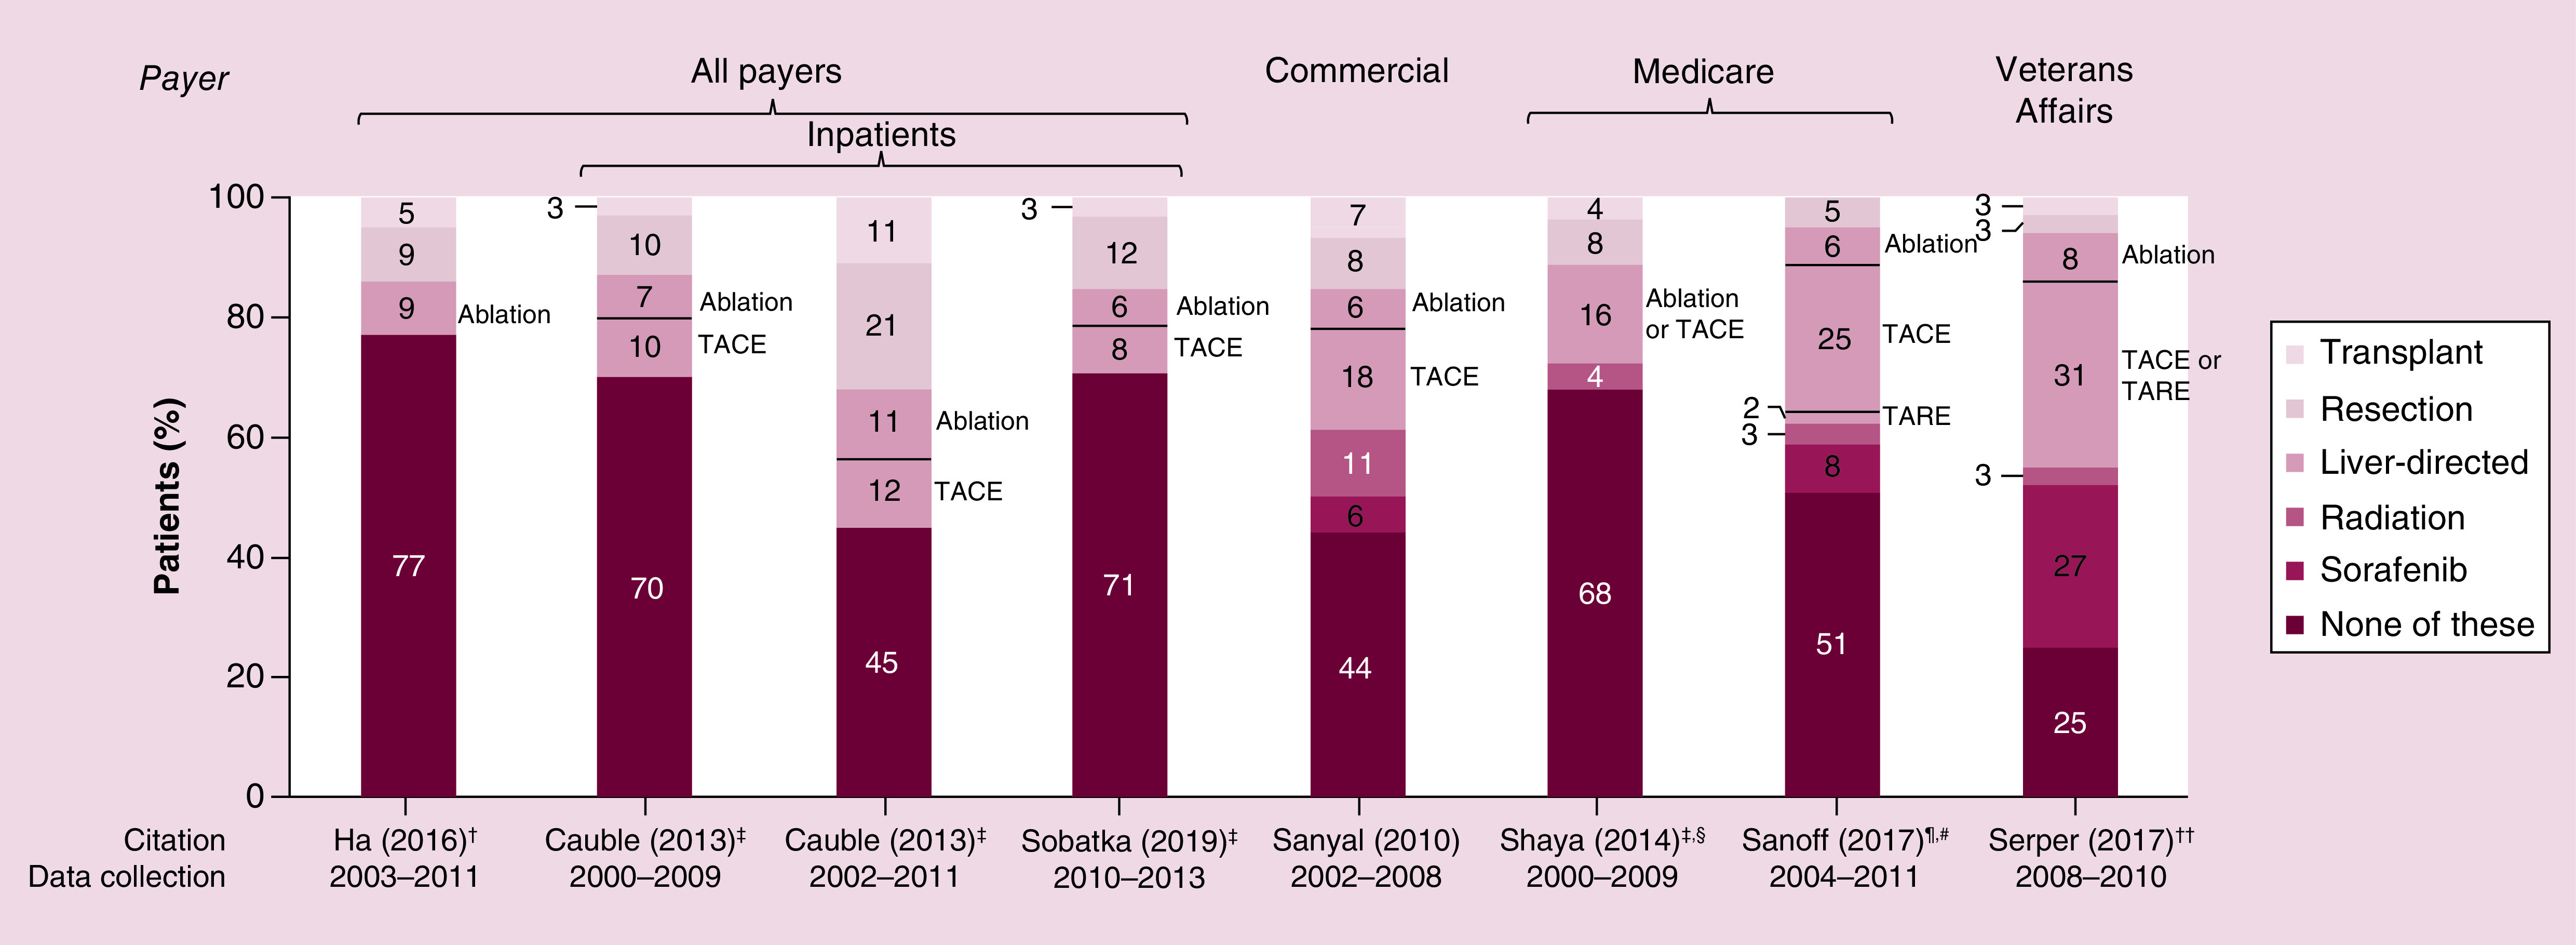
Results: HCC incidence was 9.5 per 100,000 person-years in most recent data, but was ∼100-times higher among patients with hepatitis/cirrhosis. Approximately a third of patients were diagnosed with advanced disease. Patients with HCC experienced poor quality of life. Direct costs were substantial and varied based on underlying demographics, disease stage and treatment received. Between 25-77% of patients did not receive surgical, locoregional or systemic treatment.

Conclusion: Better treatments are needed to extend survival and improve quality of life for patients with HCC.

Keywords: epidemiology; hepatocellular carcinoma; pharmacoeconomics; risk factors; staging.


Conflict of interest statement

Financial & competing interests disclosure Funding for this study was provided by AstraZeneca. A Aly, Y Doleh and F Benavente are employees and stockholders of AstraZeneca. S Ronnebaum and D Patel are employees of Pharmerit - an OPEN Health Company. The authors have no other relevant affiliations or financial involvement with any organization or entity with a financial interest in or financial conflict with the subject matter or materials discussed in the manuscript apart from those disclosed. No writing assistance was utilized in the production of this manuscript.

Figures

Figure 1.
Figure 1.. PRISMA flow diagram.
Figure 2.
Figure 2.. Incidence.
Each symbol represents an estimate from a given study. HBV: Hepatitis B virus; HCV: Hepatitis C virus; PY: Person-years. (Incidence over time) All payers sources: Ha, 2016 (SEER) [24]; Rich, 2019 (SEER) [19]; and White, 2017 (US Cancer Statistics registry) [23]; Medicare source: Shiels, 2019 [21]; Veterans Affairs source: Beste, 2015 [16]. (Etiology-associated incidence) Choi, 2015 [25]; El-Serag, 2016 [26]; Ioannou, 2018 [27]; Li, 2018 [28]; Mittal, 2014 [29]; Park, 2019 [30]; Su, 2018 [31].
Figure 3.
Figure 3.. Incidence by patient demographics.
Data from SEER, 2003–2011; n = 50,723 patients with HCC included. Bars represent an annual estimate for 2003–2011. HCC: Hepatocellular carcinoma; PY: Person-year. Ha, 2016 [24].
Figure 4.
Figure 4.. Patient characteristics.
HBV: Hepatitis B virus; HCV: Hepatitis C virus; NASH: Nonalcoholic steatohepatitis. Aggarwal, 2018 [50]; Beste, 2015 [16]; Campbell, 2016 [54]; Cauble, 2013 [55]; Ha, 2016 [24]; Hester, 2019 [17]; Hyder, 2013 [58]; Jinjuvadia, 2017 [59]; Kaplan, 2018 [60]; Kasmari, 2017 [62]; Menzin, 2011 [65]; Mishra, 2013 [66]; Poklepovic, 2010 [68]; Sanoff, 2017 [69]; Sanyal, 2010 [20]; Serper, 2017 [79]; Shaya, 2014 [70]; Shiels, 2019 [21]; Sobotka, 2019 [72]; Tsong, 2010 [74]; Tsong, 2010 [75]. Each bubble represents a figure from a given study. Bubble size indicates total study sample size. Note that the circles indicating 99% male populations represent 3 studies using data from Veterans Affairs [16,61,79].
Figure 5.
Figure 5.. Payers among inpatients with hepatocellular carcinoma.
Each stacked bar represents a cohort from a given year or timeframe, as indicated. HCC: Hepatocellular carcinoma; NIS: National Inpatient Sample; UHC: University Health Consortium. Sources: Cauble, 2013 [55]; Jinjuvadia, 2017 [59]; Mishra, 2013 [66]; Sobotka, 2019 [72].
Figure 6.
Figure 6.. Disease stage.
Each bar represents the staging information within a given study cohort. Text adjacent to each bar notes the disease stage as described by study authors. AJCC: American Joint Committee on Cancer; BCLC: Barcelona Clinic Liver Cancer; SEER: Surveillance, Epidemiology, and End Results; UNOS: United Network on Organ Sharing. Sources: Ha, 2016 [77]; Kaplan, 2018 [60]; Menzin, 2011 [65]; Sanoff, 2017 [69]; Serper, 2017 [79]; Shaya, 2014 [70].
Figure 7.
Figure 7.. Survival.
“Localized” refers to tumors involving a single lobe of the liver. Milan Criteria refers to a single lesion measuring <5 cm, or no more than 3 lesions measuring <3 cm each [83]. AJCC: American Joint Committee on Cancer; BCLC: Barcelona Clinic Liver Cancer; SEER: Surveillance, Epidemiology and End Results. Sources: Ha, 2016 [24]; Serper, 2017 [79].
Figure 8.
Figure 8.. Indirect costs.
Data source: Human Capital Management Services integrated databases; 2001–2013. Patients with HCV, n = 1,386; non-HCV patients, n = 727,588. Each stacked bar represents data from one patient group, as indicated. HCC: Hepatocellular carcinoma; HCV: Hepatitis C virus. Source: Baran, 2015 [39].
Figure 9.
Figure 9.. Treatment.
Each bar represents treatment utilization within a given study cohort. Text adjacent to each bar notes the specific liver-direct treatment used, as described by study authors. Treatment categories considered in analysis were transplant, resection, ablation, or none. Most invasive treatment listed if patient underwent multiple procedures. §Sorafenib was not considered in analysis. Initial treatment. #Data from subset of patients in which sorafenib and radiation were separated were used for this figure. ††Treatments not mutually exclusive. NIS: National Inpatient Sample; SEER: Surveillance, Epidemiology and End Results; TACE: Transarterial chemoembolization; TARE: Transarterial radioembolization; UHC: University Health Consortium; UNOS: United Network on Organ Sharing. Sources: Cauble, 2013 [55]; Ha, 2016 [77]; Sanoff, 2017 [69]; Sanyal, 2010 [20]; Serper, 2017 [79]; Shaya, 2014 [70]; Sobotka, 2019 [72].

References

    1. Global Cancer Observatory (2018). https://gco.iarc.fr/today/home
    1. Siegel RL, Miller KD, Jemal A. Cancer statistics, 2019. CA Cancer J. Clin. 69(1), 7–34 (2019). - PubMed
    1. Islami F, Goding Sauer A, Miller KD. et al. Proportion and number of cancer cases and deaths attributable to potentially modifiable risk factors in the United States. CA Cancer J. Clin. 68(1), 31–54 (2018). - PubMed
    1. Ward EM, Sherman RL, Henley SJ. et al. Annual report to the nation on the status of cancer, featuring cancer in men and women age 20–49 years. J. Natl Cancer Inst. 111(12), 1279–1297 (2019). - PMC - PubMed
    1. Bray F, Ferlay J, Soerjomataram I, Siegel RL, Torre LA, Jemal A. Global cancer statistics 2018: GLOBOCAN estimates of incidence and mortality worldwide for 36 cancers in 185 countries. CA Cancer J. Clin. 68(6), 394–424 (2018). - PubMed

LinkOut - more resources