Effects of core titanium crystal dimension and crystal phase on ROS generation and tumour accumulation of transferrin coated titanium dioxide nanoaggregates
- PMID: 32774845
- PMCID: PMC7409989
- DOI: 10.1039/d0ra01878c
Effects of core titanium crystal dimension and crystal phase on ROS generation and tumour accumulation of transferrin coated titanium dioxide nanoaggregates
Abstract
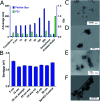
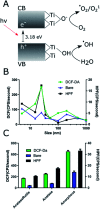
Radionuclide-stimulated therapy (RaST), which is enhanced by Cherenkov radiation, has enabled deep tissue stimulation of UV photosensitizers, providing a new path for cancer treatment. Previous reports have shown UV-active titanium dioxide (TiO2) nanoparticles (NPs) modified with transferrin inhibit tumour growth after orthogonal treatment with Cherenkov radiation-emitting radionuclides such as 18F-fluorodeoxyglucose (FDG). However, poor understanding of TiO2 NP parameters on reactive oxygen species (ROS) generation and particle distribution limits effective therapy. Here we sought to delineate the effects of crystal phase and core TiO2 crystal dimension (cTd) on ROS production and particle morphology. We prepared Transferrin (Tf)-TiO2 nanoaggregates (NAGs) using solvothermally synthesized cTd sizes from 5 to 1000 nm diameter and holo- or apo-transferrin. Holo-transferrin was unable to stabilize TiO2 NPs while apo-transferrin stabilized TiO2 into uniform nanoaggregates (NAGs), which were invariant with differing cTd, averaging 116 ± 1.04 nm for cTds below 100 nm. ROS production increased from 5 to 25 nm cTd, attaining a peak at 25 nm before decreasing with larger sizes. The supra-25 nm ROS production decrease was partially driven by a ~1/r 3 surface area decline. Additionally, amorphous TiO2 of equal core size exhibited a 2.6-fold increase in ROS production compared to anatase NAGs, although limited stability halted further use. Although both 5 and 25 nm anatase cTds formed similarly sized NAGs, 5 nm anatase showed a four-fold higher tumour-to-muscle ratio than the 25 nm NPs in tumour-bearing mice, demonstrating the intricate relationships between physical and biological properties of NAGs. The combined in vivo and ROS results demonstrate that anatase crystals and cTd size of 25 nm or less are ideal particle parameters to balance biodistribution with ROS production efficiency.
Conflict of interest statement
Conflicts of interest There are no conflicts to declare.
Figures


References
-
- Allison R. R. Cuenca R. Downie G. H. Randall M. E. Bagnato V. S. Sibata C. H. Photodiagn. Photodyn. Ther. 2005;2:51–63. - PubMed
-
- Verma R. S. and Bonavida B., Resistance to Targeted Anti-Cancer Therapeutics, 2015, vol. 6
Grants and funding
LinkOut - more resources
Full Text Sources
Miscellaneous

