

Influencer identification in dynamical complex systems
- PMID: 32774857
- PMCID: PMC7391989
- DOI: 10.1093/comnet/cnz029
Influencer identification in dynamical complex systems
Abstract
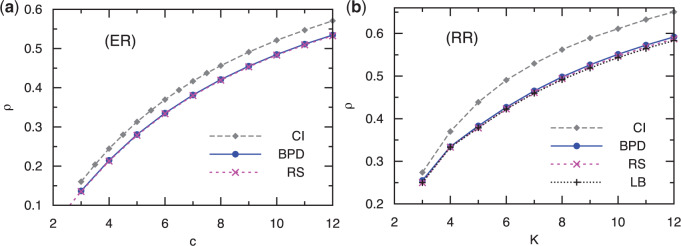
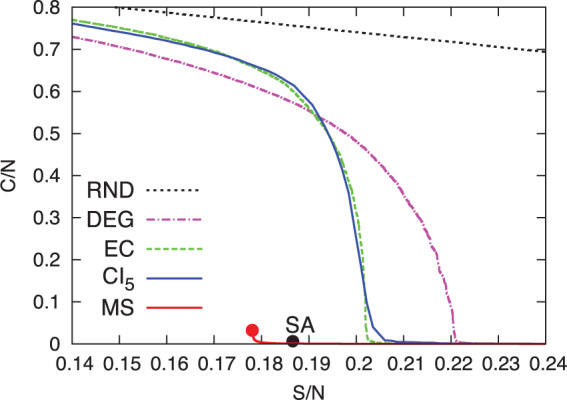
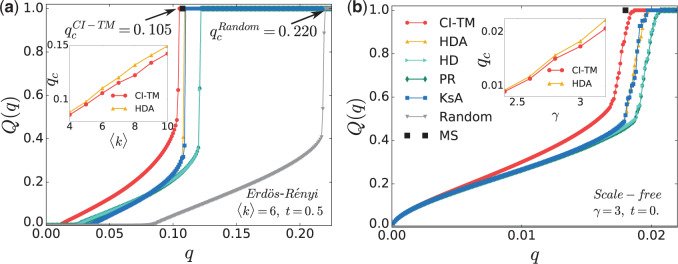
The integrity and functionality of many real-world complex systems hinge on a small set of pivotal nodes, or influencers. In different contexts, these influencers are defined as either structurally important nodes that maintain the connectivity of networks, or dynamically crucial units that can disproportionately impact certain dynamical processes. In practice, identification of the optimal set of influencers in a given system has profound implications in a variety of disciplines. In this review, we survey recent advances in the study of influencer identification developed from different perspectives, and present state-of-the-art solutions designed for different objectives. In particular, we first discuss the problem of finding the minimal number of nodes whose removal would breakdown the network (i.e. the optimal percolation or network dismantle problem), and then survey methods to locate the essential nodes that are capable of shaping global dynamics with either continuous (e.g. independent cascading models) or discontinuous phase transitions (e.g. threshold models). We conclude the review with a summary and an outlook.
Keywords: influencer identification; k-core percolation; optimal percolation; spreading dynamics; threshold models.
© The authors 2019. Published by Oxford University Press. All rights reserved.
Figures
Similar articles
-
Coherence resonance in influencer networks.Nat Commun. 2021 Jan 4;12(1):72. doi: 10.1038/s41467-020-20441-4. Nat Commun. 2021. PMID: 33398017 Free PMC article.
-
Optimal percolation on multiplex networks.Nat Commun. 2017 Nov 16;8(1):1540. doi: 10.1038/s41467-017-01442-2. Nat Commun. 2017. PMID: 29147014 Free PMC article.
-
Influence maximization in complex networks through optimal percolation.Nature. 2015 Aug 6;524(7563):65-8. doi: 10.1038/nature14604. Epub 2015 Jul 1. Nature. 2015. PMID: 26131931
-
A Survey on Social Media Influence Environment and Influencers Identification.Soc Netw Anal Min. 2022;12(1):145. doi: 10.1007/s13278-022-00972-y. Epub 2022 Oct 3. Soc Netw Anal Min. 2022. PMID: 36213258 Free PMC article. Review.
-
What Is Influencer Marketing and How Does It Target Children? A Review and Direction for Future Research.Front Psychol. 2019 Dec 3;10:2685. doi: 10.3389/fpsyg.2019.02685. eCollection 2019. Front Psychol. 2019. PMID: 31849783 Free PMC article. Review.
Cited by
-
Characteristic functional cores revealed by hyperbolic disc embedding and k-core percolation on resting-state fMRI.Sci Rep. 2022 Mar 22;12(1):4887. doi: 10.1038/s41598-022-08975-7. Sci Rep. 2022. PMID: 35318429 Free PMC article.
-
The dynamic resilience of urban labour networks.R Soc Open Sci. 2023 Jul 5;10(7):230214. doi: 10.1098/rsos.230214. eCollection 2023 Jul. R Soc Open Sci. 2023. PMID: 37416825 Free PMC article.
References
-
- Pastor-Satorras, R., Castellano, C., Van Mieghem, P. & Vespignani, A. (2015) Epidemic processes in complex networks. Rev. Mod. Phys., 87, 925.
-
- Zhang, Z.-K., Liu, C., Zhan, X.-X., Lu, X., Zhang, C.-X. & Zhang, Y.-C. (2016) Dynamics of information diffusion and its applications on complex networks. Phys. Rep., 651, 1–34.
-
- Bullmore, E. & Sporns, O. (2009) Complex brain networks: graph theoretical analysis of structural and functional systems. Nat. Rev. Neurosci., 10, 186. - PubMed
-
- Montoya, J. M., Pimm, S. L. & Solé, R. V. (2006) Ecological networks and their fragility. Nature, 442, 259. - PubMed
-
- Newman, M. E. J. (2003) The structure and function of complex networks. SIAM Rev., 45, 167–256.
Publication types
Grants and funding
LinkOut - more resources
Full Text Sources