

Effects of resistance training and turmeric supplementation on reactive species marker stress in diabetic rats
- PMID: 32774865
- PMCID: PMC7409633
- DOI: 10.1186/s13102-020-00194-9
Effects of resistance training and turmeric supplementation on reactive species marker stress in diabetic rats
Abstract
Background: Type 1 diabetes mellitus (T1DM) is a metabolic disease characterized by hyperglycemia and excessive generation of reactive oxygen species caused by autoimmune destruction of beta-cells in the pancreas. Among the antioxidant compounds, Curcuma longa (CL) has potential antioxidant effects and may improve hyperglycemia in uncontrolled T1DM/TD1, as well as prevent its complications (higher costs for the maintenance of health per patient, functional disability, cardiovascular disease, and metabolic damage). In addition to the use of compounds to attenuate the effects triggered by diabetes, physical exercise is also essential for glycemic control and the maintenance of skeletal muscles. Our objective is to evaluate the effects of CL supplementation associated with moderate- to high-intensity resistance training on the parameters of body weight recovery, glycemic control, reactive species markers, and tissue damage in rats with T1DM/TD1.
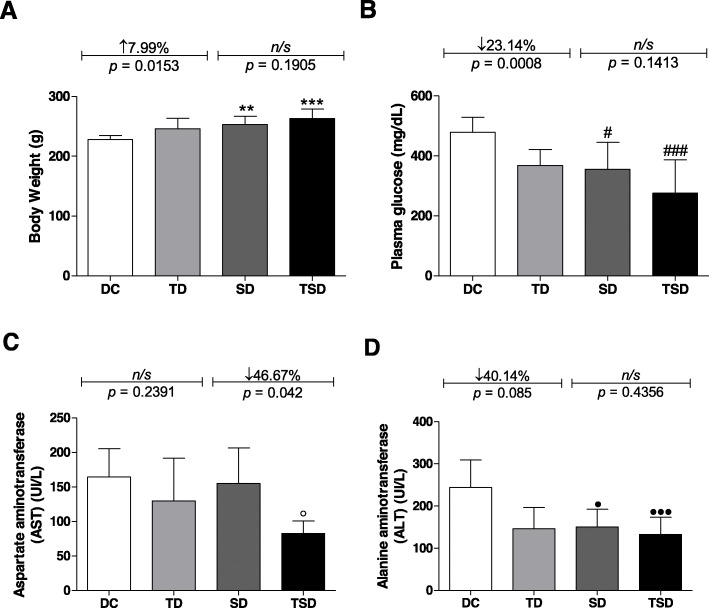
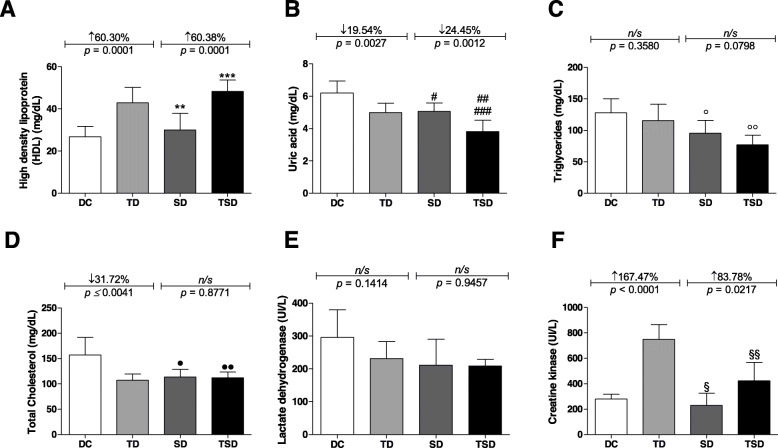
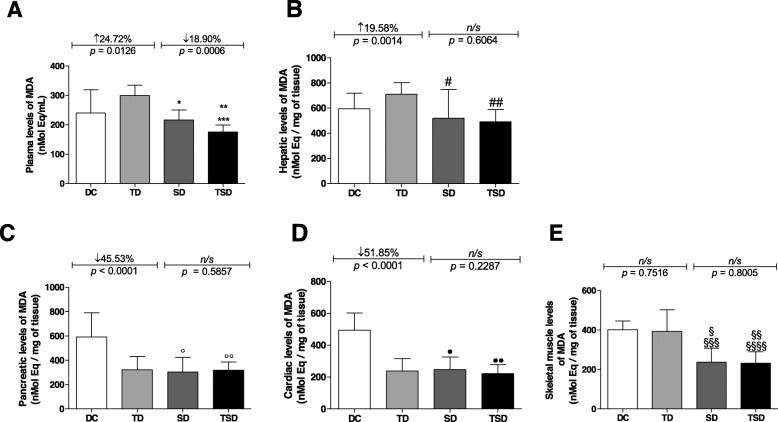
Methods: Forty male 3-month-old Wistar rats (200-250 g) with alloxan-induced T1DM were divided into 4 groups (n = 7-10): sedentary diabetics (DC); diabetic rats that underwent a 4-week resistance training protocol (TD); CL-supplemented diabetic rats (200 mg/kg body weight, 3x a week) (SD); and supplemented diabetic rats under the same conditions as above and submitted to training (TSD). Body weight, blood glucose, and the following biochemical markers were analyzed: lipid profile, aspartate aminotransferase (AST), alanine aminotransferase (ALT), uric acid, creatine kinase (CK), lactate dehydrogenase (LDH), and thiobarbituric acid reactive substances (TBARS).
Results: Compared to the DC group, the TD group showed body weight gain (↑7.99%, p = 0.0153) and attenuated glycemia (↓23.14%, p = 0.0008) and total cholesterol (↓31.72%, p ≤ 0.0041) associated with diminished reactive species markers in pancreatic (↓45.53%, p < 0.0001) and cardiac tissues (↓51.85%, p < 0.0001). In addition, compared to DC, TSD promoted body weight recovery (↑15.44%, p ≤ 0.0001); attenuated glycemia (↓42.40%, p ≤ 0.0001), triglycerides (↓39.96%, p ≤ 0.001), and total cholesterol (↓28.61%, p ≤ 0.05); and attenuated the reactive species markers in the serum (↓26.92%, p ≤ 0.01), pancreas (↓46.22%, p ≤ 0.0001), cardiac (↓55.33%, p ≤ 0.001), and skeletal muscle (↓42.27%, p ≤ 0.001) tissues caused by T1DM.
Conclusion: Resistance training associated (and/or not) with the use of Curcuma longa attenuated weight loss, the hypoglycemic and hypolipidemic effects, reactive species markers, and T1DM-induced tissue injury.
Keywords: Diabetes mellitus; Resistance training; Turmeric.
© The Author(s). 2020.
Conflict of interest statement
Competing interestsNone.
Figures
Similar articles
-
Whether or Not the Effects of Curcuma longa Supplementation Are Associated with Physical Exercises in T1DM and T2DM: A Systematic Review.Nutrients. 2020 Dec 31;13(1):124. doi: 10.3390/nu13010124. Nutrients. 2020. PMID: 33396291 Free PMC article.
-
Ethanolic extract and ethyl acetate fraction of Coutoubea spicata attenuate hyperglycemia, oxidative stress, and muscle damage in alloxan-induced diabetic rats subjected to resistance exercise training program.Appl Physiol Nutr Metab. 2020 Apr;45(4):401-410. doi: 10.1139/apnm-2019-0331. Epub 2019 Sep 20. Appl Physiol Nutr Metab. 2020. PMID: 31539486
-
Effect of garlic on rats with chronic intermittent hypoxia combined with diabetes mellitus.Mol Med Rep. 2018 Apr;17(4):6174-6184. doi: 10.3892/mmr.2018.8568. Epub 2018 Feb 7. Mol Med Rep. 2018. PMID: 29436658
-
The role of resistance and aerobic exercise training on insulin sensitivity measures in STZ-induced Type 1 diabetic rodents.Metabolism. 2013 Oct;62(10):1485-94. doi: 10.1016/j.metabol.2013.05.012. Epub 2013 Jun 28. Metabolism. 2013. PMID: 23810201
-
Exercise interventions for patients with type 1 diabetes mellitus: A narrative review with practical recommendations.World J Diabetes. 2023 May 15;14(5):539-548. doi: 10.4239/wjd.v14.i5.539. World J Diabetes. 2023. PMID: 37273254 Free PMC article. Review.
Cited by
-
Whether or Not the Effects of Curcuma longa Supplementation Are Associated with Physical Exercises in T1DM and T2DM: A Systematic Review.Nutrients. 2020 Dec 31;13(1):124. doi: 10.3390/nu13010124. Nutrients. 2020. PMID: 33396291 Free PMC article.
References
-
- International Diabetes Federation. IDF Diabetes Atlas. 9th ed. Brussels; 2019. Available from: https://www.diabetesatlas.org.
-
- Sociedade Brasileira de Diabetes . Diretrizes da Sociedade Brasileira de Diabetes (2019-2020) São Paulo: Clanad; 2019.
-
- Alberti KGMM, Eckel RH, Grundy SM, Zimmet PZ, Cleeman JI, Donato KA, et al. Harmonizing the metabolic syndrome: a joint interim statement of the International Diabetes Federation task force on Epidemiology and Prevention; National Heart, Lung, and Blood Institute; American Heart Association; World Heart Federation; International Atherosclerosis Society; and International Association for the Study of Obesity. Circ. 2019;120(16):1640–1645. doi: 10.1161/CIRCULATIONAHA.109.192644. - DOI - PubMed
LinkOut - more resources
Full Text Sources
Research Materials
